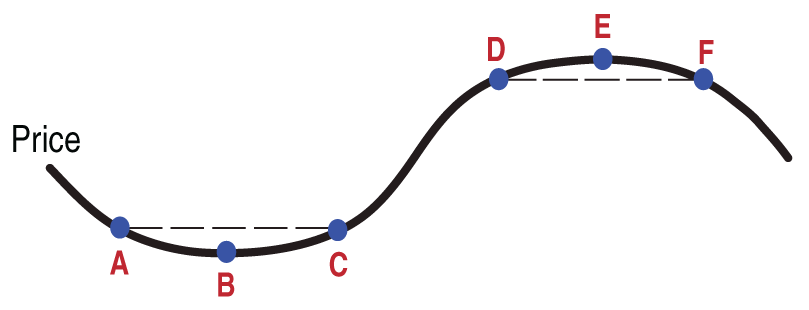
FIGURE 1: SMILES AND FROWNS. Price moves up and down in waves, signaling the perfect entry & exit locations. For the highest profit, buy at C and sell at D.
CHART PATTERNS
Patterns With Personality
Can a technique this simple really boost trading profits? Find out more.
Buy smiles and sell frowns: It’s easy to remember, but is it easy to trade? In this article I will show you how this simple pattern-recognition technique works and how it could improve your bottom line.
HOW IT WORKS
Figure 1 shows an idealized trade. Price is the wavy black line. In any trade, one price represents the perfect entry. Which of the labels — A, B, or C —represents the best buy price? The correct choice is B. Price bottoms at B, and forms the lowest price on the chart.

FIGURE 1: SMILES AND FROWNS. Price moves up and down in waves, signaling the perfect entry & exit locations. For the highest profit, buy at C and sell at D.
Points A and C are at the same price, as denoted by the horizontal dashed line. If you buy at point A, price is still heading down toward the perfect entry price. This is the entry that novices often use when bottom-fishing. They see the stock dropping and feel that it can’t go any lower, so they buy. The market knows better and continues to punish the stock, driving price lower. Within days of buying the stock, the trader who bought at point A is already losing money.
If the trader is lucky, price will bottom close to their buy price. If they are unlucky, price continues lower. Eventually, the pain of holding a stock whose value drops almost daily becomes so great that they finally sell. Often, this happens about a week or two before the stock bottoms at B.