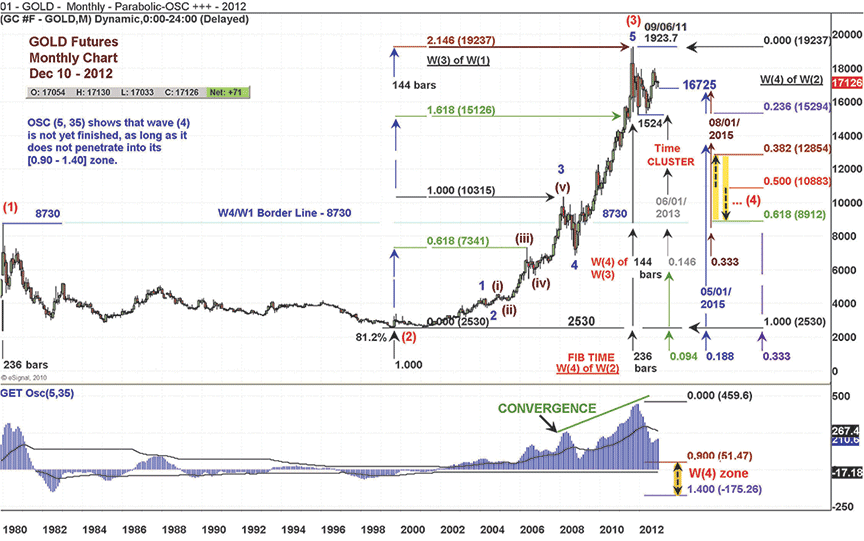
FIGURE 1: TIME & PRICE ELEMENTS. Looking at this monthly chart of the gold continuous futures contract, you can see that the time & price elements predict the development of W(4) and W(5).
CHART PATTERNS
A Golden Approach
In this second part of a two-part series, you see the time & price relationship develop in real time on a chart of gold futures.
Last month in part 1, I discussed how I examine the time & price relationship in the market by focusing on the fourth wave, W(4). I used a combination of Elliott wave analysis, Gann methodology, and mapping multiple time frames, all of which I consider before making any final trade determinations. Once this analysis has been performed, the next step, which is a detailed study of the particular market you are trading, comes naturally. Here, I’ll use the gold continuous futures contract as an example.
The price of gold futures tends to exhibit a complex development, which is why I chose to use it as an example to discuss the relationship between time & price. Understanding this relationship can help you identify the optimal time frame setup for your market.
The development of W(4) wave is fundamental in revealing where the current impulsive pattern, or main direction of the trend, terminates. Here, I will present some arguments that expose the future potential of W(4) and W(5) waves, with W(5) terminating the current parabolic impulsive pattern.
INDIRECT AND DIRECT
If you closely observe the monthly chart of the gold continuous futures contract in Figure 1, you can see that the time & price elements efficiently predict the development of W(4) wave and W(5) wave.

FIGURE 1: TIME & PRICE ELEMENTS. Looking at this monthly chart of the gold continuous futures contract, you can see that the time & price elements predict the development of W(4) and W(5).
Indirect impact: The indirect impact of the price & time relationship of W(2) wave on the development of W(3) is relevant. The long duration of W(2) implied a strong buildup of the market’s kinetic energy, which, as a consequence, had a strong W(3) wave momentum, responsible for its parabolic shape. Price-wise, the size of W(3) wave was 2.146 times the size of W(1), climbing all the way up to the 1923.7 key level, thus halting the market flow at exactly this Fibonacci key level.