TRADERS’ TIPS
October 2013

For this month’s Traders’ Tips, the focus is Sylvain Vervoort’s article in this issue, “An Expert Of A System.” Here we present the October 2013 Traders’ Tips code with possible implementations in various software.
Code for NinjaTrader is already provided in Vervoort’s article. Subscribers will find that code at the Subscriber Area of our website, www.traders.com. (Click on “Article Code” from the S&C menu.) Presented here is an overview of possible implementations for other software.
Traders’ Tips code is provided to help the reader implement a selected technique from an article in this issue. The entries are contributed by various software developers or programmers for software that is capable of customization.

TRADESTATION: OCTOBER 2013
In “An Expert Of A System” in this issue, author Sylvain Vervoort describes the use of two moving averages to develop indicators and a trading strategy. The moving averages are exponential moving averages (EMA) of the typical price and haClose. The formulas used for these price calculations can be found in Vervoort’s article.
As Vervoort describes, the price bars can be painted to aid in visually identifying entries. Provided here are some indicators, some functions, and a strategy. The indicator “_SVEHaTypeCross” paints the bars based on Vervoort’s code logic and according to colors that can be configured in the inputs. The moving averages can be plotted as well based on the input settings.
The indicator “_SVEHaTypCrossInd” plots the “cross” value below price (Figure 1). The strategy provided here illustrates some of the logic described in Vervoort’s article. Long positions are entered when the cross value changes to 1, and short positions are entered when the cross value changes to zero. The strategy is provided for illustrative purposes only.
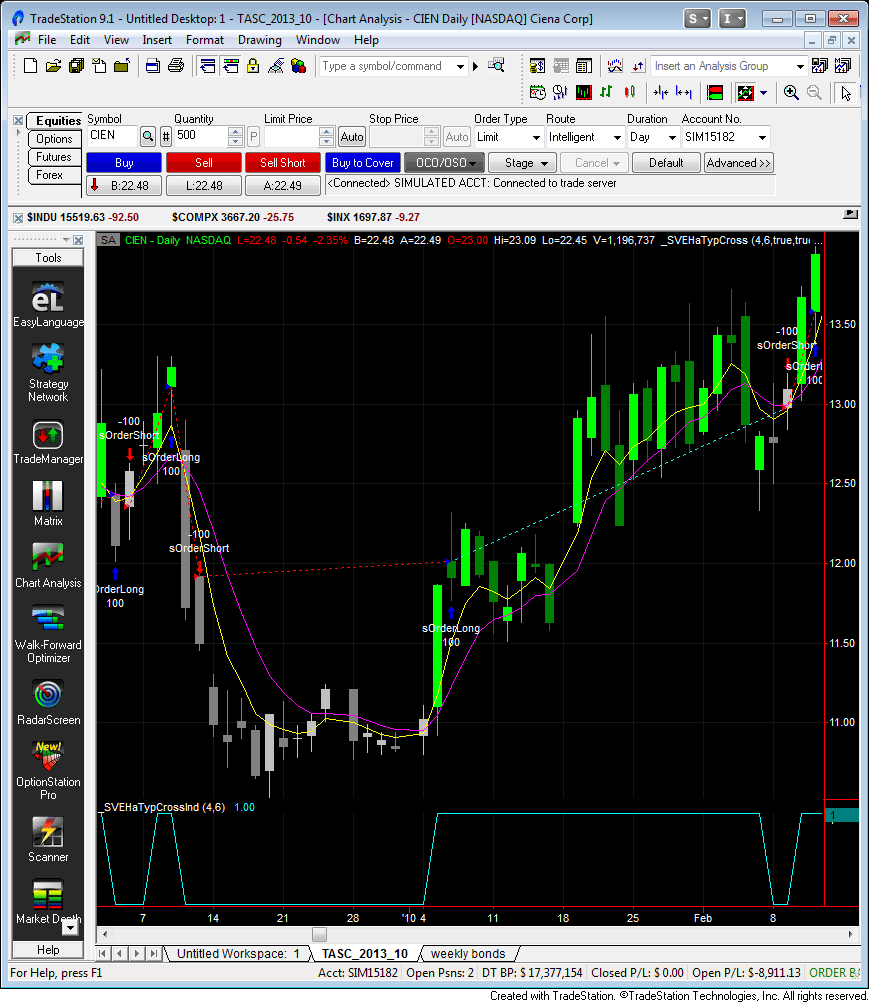
FIGURE 1: TRADESTATION. Here is a daily chart of CIEN with the two indicators and strategy applied to the chart with the average lengths set to “4” for the typical price and “6” for the haClose. The _SVEHaTypCross indicator is configured to plot the moving averages, which are plotted in yellow and magenta.
To download the EasyLanguage code, please visit our TradeStation and EasyLanguage support forum. The code for this topic can be found at https://www.tradestation.com/TASC-2013 and is also shown below. The ELD filename is “_SVEHaTypCross.ELD.”
_SVE_haClose (Function)

{ TASC - October 2013 }
{ An Expert Of A System }
{ Sylvain Vervoort }

_SVE_haClose = ( ( Open + High + Low + Close ) / 4
 + _SVE_haOpen
 + MaxList( High, _SVE_haOpen )
 + Minlist( Low, _SVE_haOpen ) ) / 4 ;


_SVE_haOpen (Function)

{ TASC - October 2013 }
{ An Expert Of A System }
{ Sylvain Vervoort }

if CurrentBar >  1 then
	_SVE_haOpen = ( ( Open[1] + High[1]
	+ Low[1] + Close[1] ) / 4
	+ _SVE_haOpen[1] ) / 2
else
	_SVE_haOpen = Open ;


_ SVEHaTypCross (Indicator)
{ TASC - October 2013 }
{ An Expert Of A System }
{ Sylvain Vervoort }

inputs:
	double EMATypLen( 5 ),
	double EMAhaCLen( 8 ),
	bool ShowAVGTypPlot( false ),
	bool ShowAVGhaCPlot( false ),
	bool PaintTheBars( true ),
	int CandleFillUp( Green ),
	int CandleFillDn( LightGray ),
	int CandleUpFill( DarkGreen ),
	int CandleDnFill( DarkGray ) ;

variables:
	double AVGTyp( 0 ),
	double AVGhaC( 0 ),
	int MAcross( -1 ),
	int CandleBodyColor( 0 ),
	bool UpBar( false ) ;

{ calculate averages of Typical Price and haC }
AVGTyp = XAverage( TypicalPrice, EMATypLen ) ;
AVGhaC = XAverage( _SVE_haClose, EMAhaCLen ) ;

if AVGTyp >  AVGhaC and Close >  Open then
	MAcross = 1
else if AVGTyp <  AVGhaC and Close <  Open then
	MAcross = 0 ;

if CurrentBar >  1 then
	begin
	{ plots }
	if ShowAVGhaCPlot then
		Plot1( AVGhaC, "AVGhaC" ) ;

	if ShowAVGTypPlot then
		Plot2( AVGtyp, "AVGtyp" ) ;

	{ paint the bars }
	if PaintTheBars then
		begin

		UpBar = Close > = Open ;

		if MAcross = 1 then
			CandleBodyColor = IFF( UpBar,
			 CandleFillUp, CandleUpFill ) astype int
		else
			CandleBodyColor = IFF( UpBar,
			 CandleFillDn, CandleDnFill ) astype int ;

		{ set the colors }
		SetPlotColor( 3, CandleBodyColor ) ;
		SetPlotColor( 4, CandleBodyColor ) ;
		SetPlotColor( 5, CandleBodyColor ) ;
		SetPlotColor( 6, CandleBodyColor ) ;

		{ paint the bars }
		Plot3( High, "PBHigh" ) ;
		Plot4( Low, "PBLow" ) ;
		Plot5( Open, "PBOpen" ) ;
		Plot6( Close, "PBClose" ) ;

		end ;

	end ;


_ SVEHaTypCrossInd (Indicator)

{ TASC - October 2013 }
{ An Expert Of A System }
{ Sylvain Vervoort }

inputs:
	double EMATypLen( 5 ),
	double EMAhaCLen( 8 ) ;

variables:
	double AVGTyp( 0 ),
	double AVGhaC( 0 ),
	int MAcross( -1 ) ;

{ calculate averages of Typical Price and haC }
AVGTyp = XAverage( TypicalPrice, EMATypLen ) ;
AVGhaC = XAverage( _SVE_haClose, EMAhaCLen ) ;

if AVGTyp >  AVGhaC and Close >  Open then
	MAcross = 1
else if AVGTyp <  AVGhaC and Close <  Open then
	MAcross = 0 ;

if CurrentBar >  1 then
	Plot1( MAcross, "cross" ) ;

_ SVEHaTypCross_Strat (Strategy)

{ TASC - October 2013 }
{ An Expert Of A System }
{ Sylvain Vervoort }

[Intrabarordergeneration = false]

inputs:
	double EMATypLen( 5 ),
	double EMAhaCLen( 8 ),
	double StopLossPerc( 25 ),
	double BreakEvenPerc( 15 ),
	int NumShares( 100 ) ;

variables:
	double MP( 0 ),
	double AEP( 0 ),
	double BSE( 0 ),
	double HighSinceEntry( 0 ),
	double LowSinceEntry( 0 ),
	double LXStopLossPrice( 0 ),
	double SXStopLossPrice( 0 ),
	double LXBreakEvenTrigger( 0 ),
	double SXBreakEvenTrigger( 0 ),
	double AVGTyp( 0 ),
	double AVGhaC( 0 ),
	int MAcross( -1 ) ;

{ strategy information }
MP = MarketPosition ;
AEP = AvgEntryPrice ;
BSE = BarsSinceEntry ;

{ track the High and Low since entry }
if MP < >  0 then { in a postion }
	begin

	if BSE = 0 then { entry bar }
		begin
		HighSinceEntry = High ;
		LowSinceEntry = Low ;
		end
	else
		begin
		HighSinceEntry = MaxList( HighSinceEntry,
		 High ) ;
		LowSinceEntry = MinList( LowSinceEntry,
		 Low ) ;
		end ;

	end ;

LXStopLossPrice = AEP * ( 1 - StopLossPerc * 0.01 ) ;
SXStopLossPrice = AEP * ( 1 + StopLossPerc * 0.01 ) ;
LXBreakEvenTrigger = AEP *
 ( 1 + BreakEvenPerc * 0.01 ) ;
SXBreakEvenTrigger = AEP *
 ( 1 - BreakEvenPerc * 0.01 ) ;

{ calculate averages of Typical Price and haC }
AVGTyp = XAverage( TypicalPrice, EMATypLen ) ;
AVGhaC = XAverage( _SVE_haClose, EMAhaCLen ) ;

if AVGTyp >  AVGhaC and Close >  Open then
	MAcross = 1
else if AVGTyp <  AVGhaC and Close <  Open then
	MAcross = 0 ;

if CurrentBar >  1 then
	begin

	{ entries }
	if MAcross = 1 and MAcross[1] = 0 then
		Buy ( "sOrderLong" ) NumShares
		 Shares next bar market ;

	if MAcross = 0 and MAcross[1] = 1 then
		SellShort( "sOrderShort" ) NumShares
		 Shares next bar market ;

	{ StopLoss exits }
	if MP = 1 then
		Sell ( "SVE LX" ) next bar
		 LXStopLossPrice stop ;

	if MP = -1 then
		BuyToCover( "SVE SX" ) next bar
		 SXStopLossPrice stop ;

	{ Breakeven exits }
	if MP = 1 and HighSinceEntry > =
	 LXBreakEvenTrigger then
		Sell ( "SVE BE LX" ) next bar AEP stop ;

	if MP = -1 and LowSinceEntry < =
	 SXBreakEvenTrigger then
		BuyToCover ( "SVE BE SX" ) next bar AEP stop ;

	end ;
For more information about EasyLanguage in general, visit https://www.tradestation.com/EL-FAQ.
This article is for informational purposes. No type of trading or investment recommendation, advice, or strategy is being made, given, or in any manner provided by TradeStation Securities or its affiliates.
—Chris Imhof
TradeStation Securities, Inc.
www.TradeStation.com
BACK TO LIST

METASTOCK: OCTOBER 2013
In “An Expert Of A System” in this issue, which is author Sylvain Vervoort’s sixth article in his ongoing series, he explains the use of an expert advisor with signals from two moving averages crossing. The MetaStock code for these formulas is shown here:
Expert highlights
Name: Buy Position:
Formula:

tpha:= 8;  {Heikin-Ashi MA periods}
tpty:= 5;  {typical MA periods}
avp:= (O + H + L + C)/4;
hao:= Ref( (avp + O)/2, -1);
hac:= (avp + hao + Max(H,hao) + Min(L,hao))/4;
maha:= Mov(hac, tpha, E);
maty:= Mov(Typical(), tpty, E);
bs:= Cross(maty, maha) AND C >  O;
ss:= Cross(maha, maty) AND C <  O;
track:= If(bs, 1, If(ss, -1, PREV));
track=1

Name: Sell Position:
Formula:

tpha:= 8;  {Heikin-Ashi MA periods}
tpty:= 5;  {typical MA periods}
avp:= (O + H + L + C)/4;
hao:= Ref( (avp + O)/2, -1);
hac:= (avp + hao + Max(H,hao) + Min(L,hao))/4;
maha:= Mov(hac, tpha, E);
maty:= Mov(Typical(), tpty, E);
bs:= Cross(maty, maha) AND C >  O;
ss:= Cross(maha, maty) AND C <  O;
track:= If(bs, 1, If(ss, -1, PREV));
track=1

Expert symbols
Name:  Buy Signal
Formula:

tpha:= 8;  {Heikin-Ashi MA periods}
tpty:= 5;  {typical MA periods}
avp:= (O + H + L + C)/4;
hao:= Ref( (avp + O)/2, -1);
hac:= (avp + hao + Max(H,hao) + Min(L,hao))/4;
maha:= Mov(hac, tpha, E);
maty:= Mov(Typical(), tpty, E);
bs:= Cross(maty, maha) AND C >  O;
ss:= Cross(maha, maty) AND C <  O;
track:= If(bs, 1, If(ss, -1, PREV));
track=1 AND Ref(track=-1, -1)

Name:  Sell Signal:
Formula:

tpha:= 8;  {Heikin-Ashi MA periods}
tpty:= 5;  {typical MA periods}
avp:= (O + H + L + C)/4;
hao:= Ref( (avp + O)/2, -1);
hac:= (avp + hao + Max(H,hao) + Min(L,hao))/4;
maha:= Mov(hac, tpha, E);
maty:= Mov(Typical(), tpty, E);
bs:= Cross(maty, maha) AND C >  O;
ss:= Cross(maha, maty) AND C <  O;
track:= If(bs, 1, If(ss, -1, PREV));
track=-1 AND Ref(track=1, -1)
—William Golson
MetaStock Technical Support
www.metastock.com
BACK TO LIST

eSIGNAL: OCTOBER 2013
For this month’s Traders’ Tip, we’ve provided the formulas SVEHaTypeCross_Bars.efs, SVEHaTypeCross_Indicator.efs, and SVEHaTypeCross_Strategy.efs based on the formula code from Sylvain Vervoort’s article in this issue, “An Expert Of A System.”
All studies contain formula parameters to set the values for the heikin-ashi average and typical price average, which may be configured through the edit chart window (right-click on chart and select edit chart). The strategy study (Figure 2) is configured for backtesting and contains additional formula parameters for the long and short position colors. The bars study (Figure 3) contains additional formula parameters to set the colors for the up fill, outline down, and outline up.
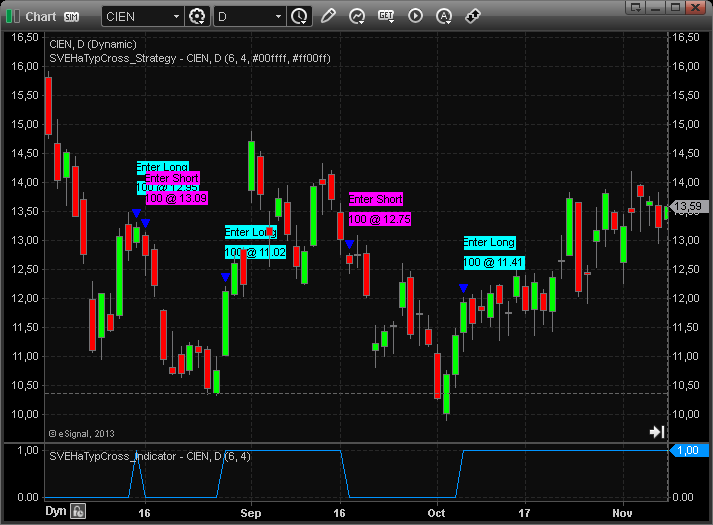
FIGURE 2: eSIGNAL. The strategy study is configured for backtesting and contains additional formula parameters for the long and short position colors.
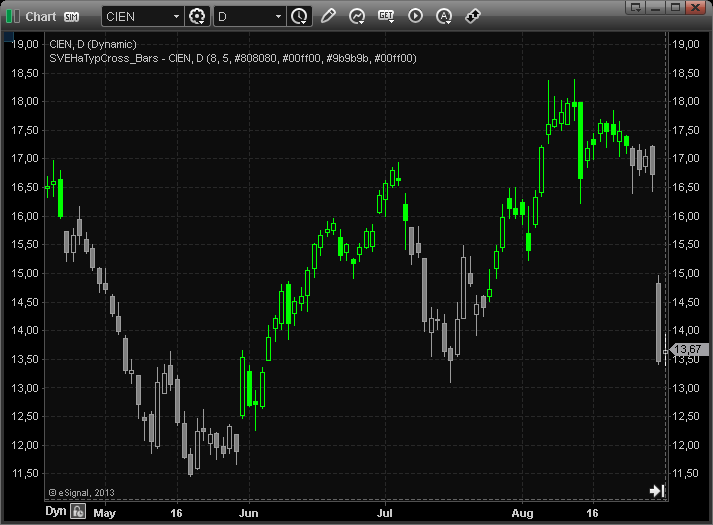
FIGURE 3: eSIGNAL. The bars study contains parameters to set the colors for the up fill, outline down, and outline up.
To discuss this study or download a complete copy of the formula code, please visit the EFS Library Discussion Board forum under the forums link from the support menu at www.esignal.com, or visit our EFS KnowledgeBase at https://www.esignal.com/support/kb/efs/. The eSignal formula scripts (EFS) are also available for downloading here: SVEHaTypeCross_Bars.efs, SVEHaTypeCross_Indicator.efs, SVEHaTypeCross_Strategy.efs.
—Jason Keck
eSignal, an Interactive Data company
800 779-6555, www.eSignal.com
BACK TO LIST

WEALTH-LAB: OCTOBER 2013
Sylvain Vervoort’s article in this issue, “An Expert Of A System,” is the sixth part of a seven-part article series. The SVEHaTypCross indicator featured in his article this issue is rather simple in its construction and application, double-smoothing the source series by applying an EMA on the typical price and the heikin-ashi series.
To illustrate, we are providing both the SVEHaTypCross indicator (which can be applied to any chart via drag & drop and also utilized in rule- and code-based strategies) and a strategy based on the trading rules from Vervoort’s article. A sample chart displaying the strategy and indicator is shown in Figure 4.
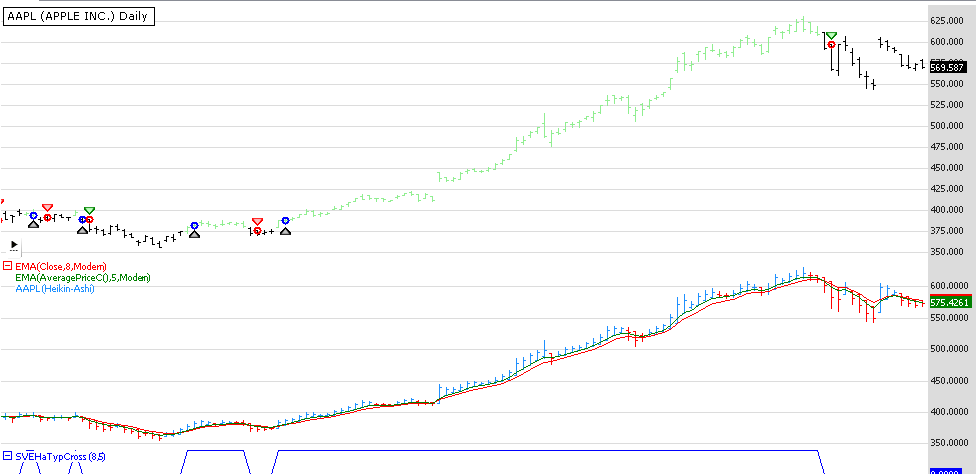
FIGURE 4: WEALTH-LAB. Here is a sample Wealth-Lab 6 chart illustrating application of the SVEHATypCross strategy and the SVEHATypCross indicator. Up bars are highlighted in green, down bars in black.
While the author’s approach in his code only checks to see whether the typical average is above (below) the heikin-ashi average, using a true crossover/crossunder may be beneficial, since it triggers fewer signals. A true crossover happens when the first average is above the second one and the previous value was less than or equal to the target value at the previous bar. Motivated traders can compare approaches by commenting and uncommenting these lines:
    if( CrossUnder( bar, tpEma, haEma ) )
	//if( tpEma[bar] < haEma[bar] )
		...
	if( CrossOver( bar, tpEma, haEma ) )
	//if( tpEma[bar] > haEma[bar] )
To run the sample strategy in Wealth-Lab, you’ll need the TASCIndicators library version 2013.09 or higher. Please install (or update) the library from www.wealth-lab.com to its latest version.
C# Code

using System;
using System.Collections.Generic;
using System.Text;
using System.Drawing;
using WealthLab;
using WealthLab.Indicators;
using TASCIndicators;

namespace WealthLab.Strategies
{
	public class SVEHATypCrossStrategy : WealthScript
	{
		private StrategyParameter paramHAPer;
		private StrategyParameter paramTypPer;
		private StrategyParameter paramBrkEven;
		private StrategyParameter paramSL;

		public SVEHATypCrossStrategy()
		{
			paramHAPer = CreateParameter("H-A Period", 8, 6, 9, 1);
			paramTypPer = CreateParameter("Typical period", 5, 4, 6, 1);
			paramBrkEven = CreateParameter("Breakeven stop %", 10, 2, 10, 2);
			paramSL = CreateParameter("Stop Loss %", 9, 2, 10, 1);
		}

		protected override void Execute()
		{
			// Parameters
			int perHA = paramHAPer.ValueInt, perTyp = paramTypPer.ValueInt;
			EMACalculation m = EMACalculation.Modern;

			// Create a Heikin-Ashi chart
			SVEHaTypCross sve = SVEHaTypCross.Series( Bars, perHA, perTyp );
			Bars bars = new Bars( Bars.Symbol.ToString() + " (Heikin-Ashi)",
				Bars.Scale, Bars.BarInterval );

			// Heikin-Ashi series
			DataSeries HO = Open + 0, HH = High + 0, HL = Low + 0;
			DataSeries HC = (Open + High + Low + Close) / 4;

			// Build the Bars object
			for (int bar = 1; bar <  Bars.Count; bar++)
			{
				double o1 = HO[bar-1];
				double c1 = HC[bar-1];
				HO[bar] = ( o1 + c1 ) / 2;
				HH[bar] = Math.Max( HO[bar], High[bar] );
				HL[bar] = Math.Min( HO[bar], Low[bar] );
				bars.Add( Bars.Date[bar],
					HO[bar], HH[bar], HL[bar], HC[bar], Bars.Volume[bar]);
			}

			bars = Synchronize( bars );

			// Build EMA of Heikin-Ashi close and EMA of Typical price
			EMA haEma = EMA.Series(bars.Close, perHA, m);
			EMA tpEma = EMA.Series(AveragePriceC.Series( Bars ), perTyp, m);

			// Plot the series
			ChartPane haPane = CreatePane(75, false, true);
			ChartPane svePane = CreatePane(10, false, true);
			PlotSymbol(haPane, bars, Color.DodgerBlue, Color.Red);
			PlotSeries(haPane, haEma, Color.Red, LineStyle.Solid, 1);
			PlotSeries(haPane, tpEma, Color.Green, LineStyle.Solid, 1);
			PlotSeries(svePane, sve, Color.Blue, LineStyle.Solid, 1);
			SetBarColors(Color.Silver, Color.Silver);
			HideVolume();

			for(int bar = 1; bar <  Bars.Count; bar++)
			{
				SetBarColor(bar, (sve[bar] >  0) ? Color.LightGreen : Color.Black );

				if (IsLastPositionActive)
				{
					Position p = LastPosition;
					if( Close[bar] <  Open[bar] )
					{
						double stopLoss = (1.0 - paramSL.Value / 100d);						double stop = p.EntryPrice * stopLoss;
						double brkEven = p.EntryPrice * 1.01;

						if( CrossUnder( bar, tpEma, haEma ) )
						//if( tpEma[bar] <  haEma[bar] )
							SellAtMarket( bar+1, p, "Regular" );
						else
						if( !SellAtStop(bar + 1, p, stop, "SL"))
						if (p.MFEAsOfBarPercent(bar) >  paramBrkEven.Value)
							SellAtStop(bar + 1, p, brkEven, "Breakeven");
					}
				}
				else
				{
					if( Close[bar] >  Open[bar] )
					{
						if( CrossOver( bar, tpEma, haEma ) )
						//if( tpEma[bar] >  haEma[bar] )
							BuyAtMarket( bar+1 );
					}
				}
			}
		}
	}
}
—Wealth-Lab team
MS123, LLC
www.wealth-lab.com
BACK TO LIST

AMIBROKER: OCTOBER 2013
In “An Expert Of A System” in this issue, author Sylvain Vervoort presents a simple system based on heikin-ashi techniques and moving averages. AmiBroker code based on the indicator described in his article is presented here. To display the indicator (Figure 5), simply input the code into the formula editor and press apply indicator. To backtest a trading system, choose backtest from the Tools menu in the formula editor.
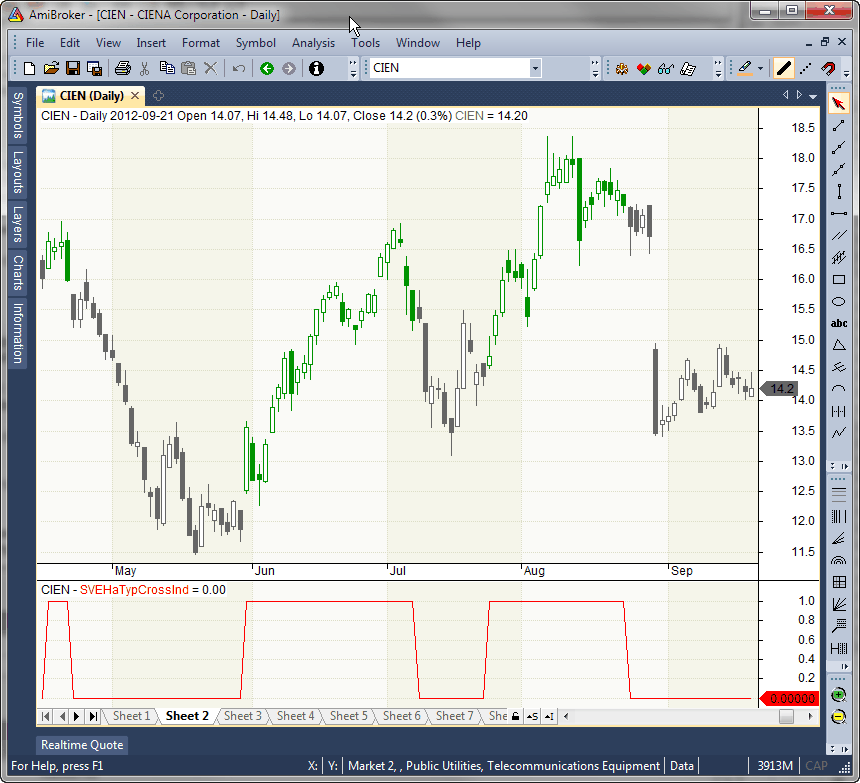
FIGURE 5: AMIBROKER. Here is a daily candlestick chart of CIEN with the SVEHaTypCrossInd in the bottom pane.
LISTING 1.
APrice = ( Open + High + Low + Close )/4;
HaOpen = AMA( APrice , 0.5 );
HaHigh = Max( High, HaOpen );
HaLow  = Min( Low, HaOpen );
HaClose = ( APrice + HaOpen + HaHigh + HaLow ) / 4;

typical = ( High + Low + Close ) / 3;

HaCAverage = 8;
TypicalAverage = 5;

AvgTyp = EMA( Typical, TypicalAverage );
AvgHaC = EMA( HaClose, HaCAverage );

CondSet = AvgTyp >  AvgHaC AND Close >  Open;
CondReset = AvgTyp <  AvgHaC AND Close <  Open;

SVEHaTypCrossInd = Flip( CondSet, CondReset );

Plot( SVEHaTypCrossInd, "SVEHaTypCrossInd", colorRed );

Buy = Cross( SVEHaTypCrossInd, 0.5 );
Sell = Cross( 0.5, SVEHaTypCrossInd );
Short = Sell;
Cover = Buy;

SetPositionSize( 100, spsShares ); // 100 shares per position
ApplyStop( stopTypeLoss, stopModePercent, 25, True ); // 25% stop loss
—Tomasz Janeczko, AmiBroker.com
www.amibroker.com
BACK TO LIST

NEUROSHELL TRADER: OCTOBER 2013
The expert trading system described by Sylvain Vervoort in his article in this issue, “An Expert Of A System,” can be implemented with a few of NeuroShell Trader’s 800+ indicators. Simply select “New trading strategy” from the insert menu and enter the following in the appropriate locations of the Trading Strategy Wizard:
Generate a buy long order if all of the following are true:

And2(A> B(ExpAvg(Avg3(High,Low,Close),5),ExpAvg(HeikinAshiClose(Open,High,Low,Close),8)),A> B(Close,Open))

Generate a long protective stop order at the following price levels:

PriceFloor%(Trading Strategy,9)
EntryPrice%(Trading Strategy,10)

Generate a sell short order if all of the following are true:

And2(A< B(ExpAvg(Avg3(High,Low,Close),5),ExpAvg(HeikinAshiClose(Open,High,Low,Close),8)),A< B(Close,Open))

Generate a short protective stop order at the following price level:

PriceFloor%(Trading Strategy,9)
EntryPrice%(Trading Strategy,10)
If you have NeuroShell Trader Professional, you can also choose whether the parameters should be optimized. After backtesting the trading strategy, use the “Detailed analysis” button to view the backtest and trade-by-trade statistics for the strategy.
Users of NeuroShell Trader can go to the Stocks & Commodities section of the NeuroShell Trader free technical support website to download the HeikinAschiClose indicator.
A sample chart of the system is shown in Figure 6.
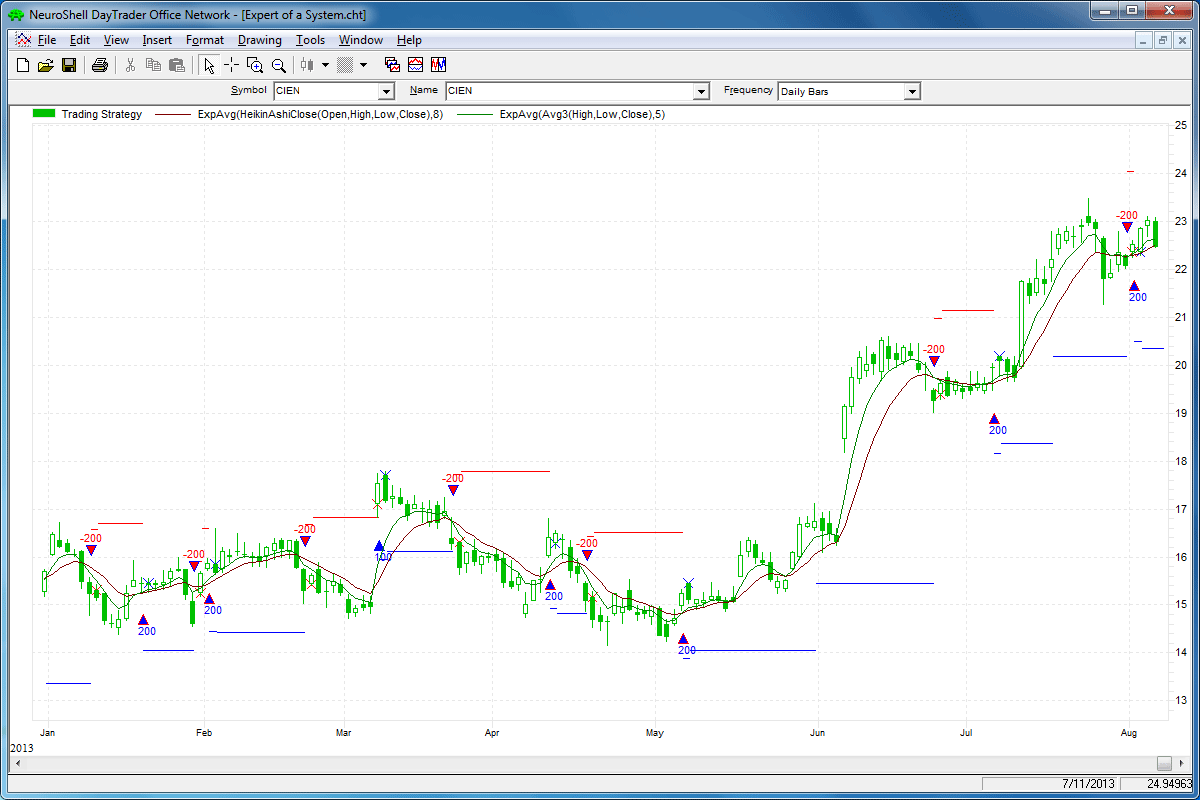
FIGURE 6: NEUROSHELL TRADER. This NeuroShell Trader chart displays Sylvain Vervoort’s expert trading system on CIEN.
—Marge Sherald, Ward Systems Group, Inc.
301 662-7950, sales@wardsystems.com
www.neuroshell.com
BACK TO LIST

AIQ: OCTOBER 2013
The AIQ code for Sylvain Vervoort’s color study and system described in his article in this issue, “An Expert Of A System,” is provided at www.TradersEdgeSystems.com/traderstips.htm.
Figure 7 is a chart of Netflix (NFLX) with a color bar study that shows when the expert system is in a buy mode (green bars). A buy mode occurs when the typical price exponential moving average (typEMA) is above the heinkin-ashi close exponential moving average (haEMA), and the close is above the open after having been in the sell mode. For the sell to be true (red bars), the typEMA must be below the haEMA and the close must be below the open for the initial signal to go short after having been in the buy mode.
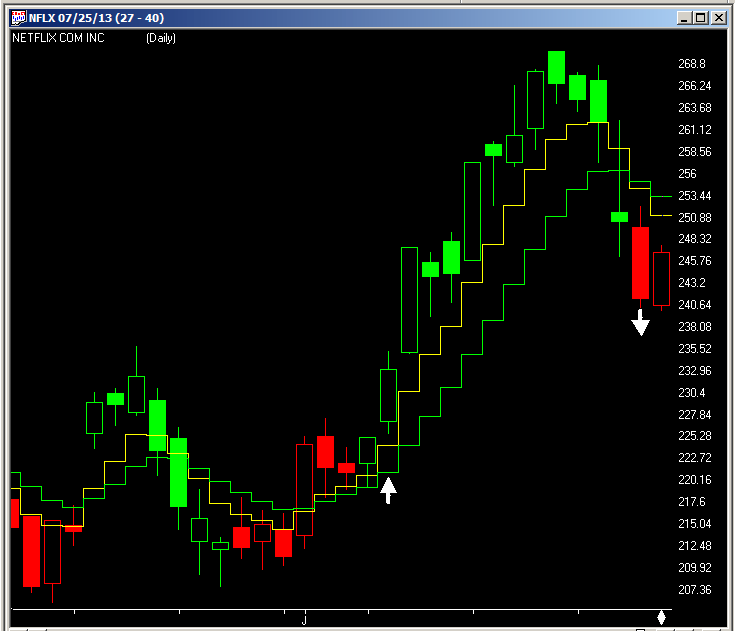
FIGURE 7: AIQ, TYPEMA AND HAEMA. Here is a sample chart of NFLX with typEMA (yellow) and haEMA (green), with the color study showing buys (green bars with up white arrows) and sells (red bars with down white arrows).
Figure 7 also shows the two moving averages typEMA in yellow and the haEMA in green. White arrows show the signal dates for the sample trade on NFLX. The entries & exits are the next day at the open. I simplified the system and did not code the stop-loss or the breakeven exits. I ran a test on the NASDAQ 100 from August 11, 2000 to August 9, 2013.
The long-side test results are summarized in Figure 8. The average return for all 13,295 trades is 0.64% per trade before commissions & slippage. This return assumes that all trades are taken. I tested the short side over this same period, and there were 13,256 trades averaging a loss of 1.00% per trade (summary not shown).
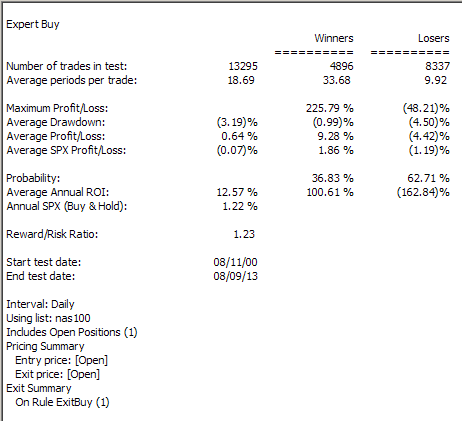
FIGURE 8: AIQ, BACKTEST RESULTS. Here is a summary of the backtest results of the long side on the NASDAQ 100 list of stocks from August 11, 2000 to August 9, 2013.
The code and EDS file can be downloaded from www.TradersEdgeSystems.com/traderstips.htm, and is shown below.
! AN EXPERT OF A SYSTEM

! Author: Sylvain Vervoort, TASC, October 2013

! Coded by: Richard Denning

! www.TradersEdgeSystems.com


! INPUTS:

H is [high].

L is [low].

C is [close].

O is [open].

OSD is offsettodate(month(),day(),year()).

typLen is 5.

haLen is 8.


!----------------HEIKIN-ASHI-----------------

haC is (O + H +L + C) / 4.

DaysInto is ReportDate() - RuleDate().

end if DaysInto >  30.

endHAO is iff(end,O, haO).

haO is (valresult(endHAO,1)

	+valresult(haC,1))/2.

haH is Max(H,max(haO,haC)).

haL is Min(L,min(haO,haC)).

haCL is (haC + haO + haH + haL) / 4.

haEMA is expavg(haCL,haLen).  !PLOT

!---------------end HEIKIN-ASHI---------------


!---------------TYPICAL PRICE ----------------

TYP is (H+L+C)/3.

typEMA is expavg(TYP,typLen). !PLOT


!-----------------end TYPICAL-----------------


!--------------COLOR STUDY--------------------

G if (typEMA >  haEMA and C >  O).

Gos is scanany(G,200) then OSD.

R if typEMA <  haEMA and C <  O.

Ros is scanany(R,200) then OSD.

GREEN if G or ^Gos <  ^Ros.

RED if  R or ^Ros <  ^Gos.

!-------------end COLOR STUDY-----------------


!-------------TRADING SYSTEM------------------

Buy if G.

ExitBuy if R.

Sell if R.

ExitSell if G.

!-------------end TRADING SYSTEM--------------
—Richard Denning
info@TradersEdgeSystems.com
for AIQ Systems
BACK TO LIST

TRADERSSTUDIO: OCTOBER 2013
The TradersStudio code based on Sylvain Vervoort’s article in this issue, “An Expert Of A System,” is provided at the following websites:
The code replicates the two moving averages and system from Vervoort’s article. The following files are contained in the download:
- Function: HA_CLOSE gets the value of the heinkin-ashi close
- Function: TYP_PRICE gets the typical price
- Indicator plot: SV_EXPERT_IND is a plotting function that allows the SVE moving averages to be displayed on a chart
- System code: SV_EXPERT_SYS is a system to trade a version of Vervoort’s system. Note: My version omits the stop-loss and breakeven exit.
In Figure 9, I show an equity curve and underwater equity curve using the parameters of 5 for the heikin-ashi exponential moving average (haEMA) and 10 for the typical price exponential moving average (typEMA) trading the futures contract on the Australian dollar (AD) using data from Pinnacle Data. The parameter set of haEMA=5, typEMA=10 was derived by optimizing over the entire data history from 1988 to 2013. Commissions and slippage were not taken out.
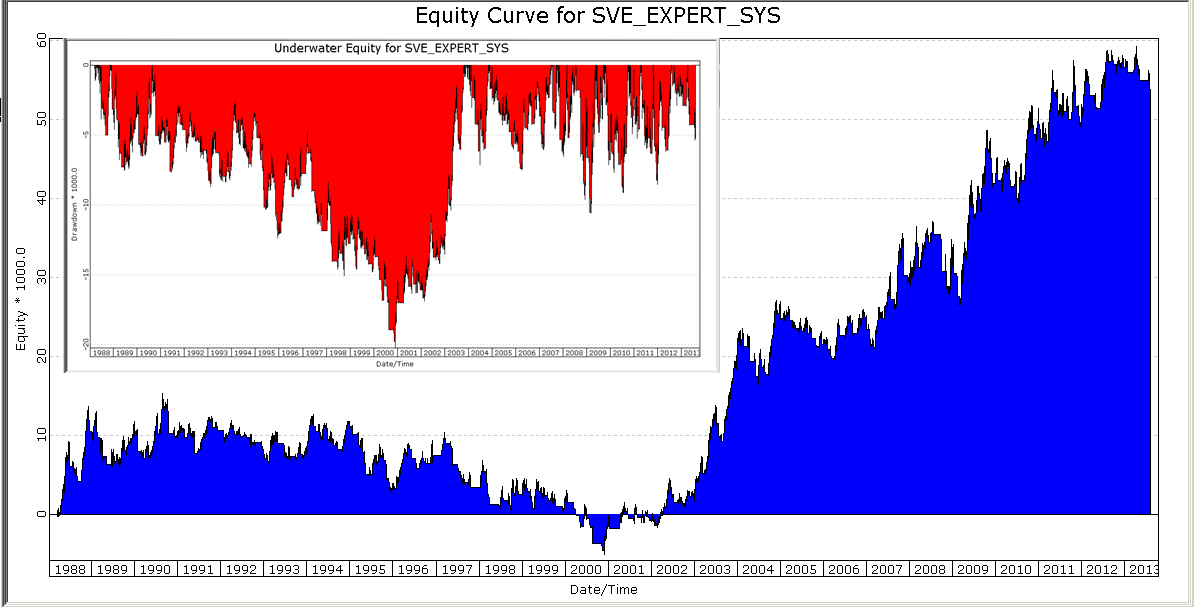
FIGURE 9: TRADERSSTUDIO, OPTIMIZATION RESULTS. Equity and underwater equity curves are shown for an implementation of Vervoort’s system trading the AN futures contract using the most profitable parameter set obtained via optimization (haEMA=5, typEMA=10).
Next, I performed a walkforward analysis using a training window of 250 bars and a forward window of 125 bars. This test did not show good results, and in fact, two of the three boundary exit options showed that the system lost money over the period. Only when I chose the “exit all trades and reenter” option for the boundaries did the system show a net profit.
This result is shown in Figure 10. It is clear that the system failed the walkforward. Due to time constraints, I did not try other training or forward-test periods, which may have produced better results.
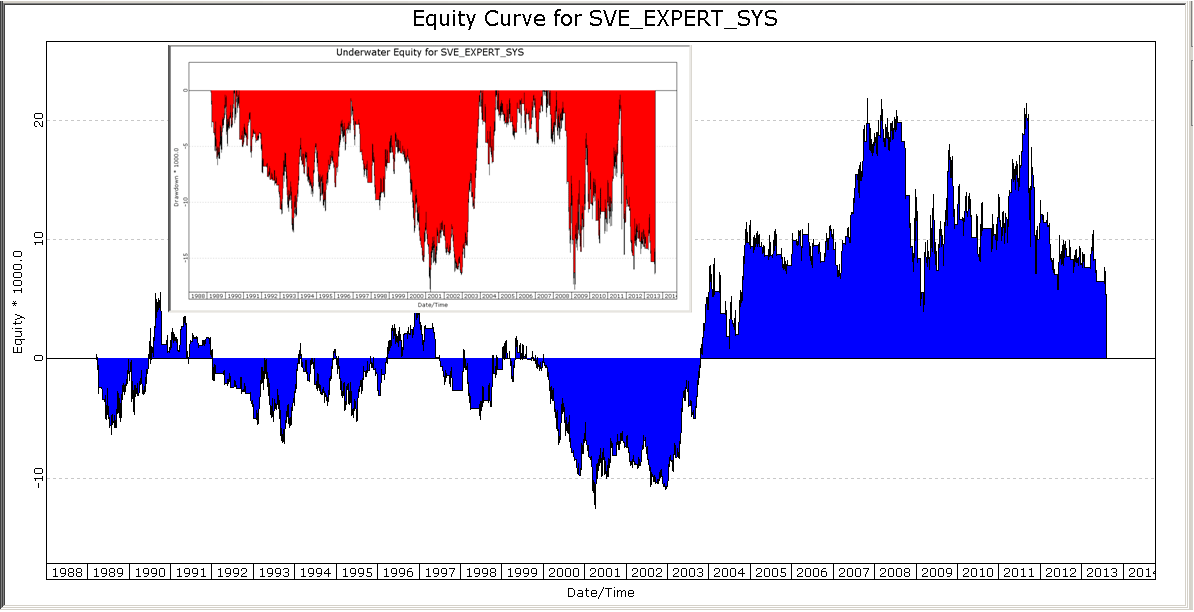
FIGURE 10: TRADERSSTUDIO, WALKFORWARD RESULTS. Equity and underwater equity curves are shown for an implementation of Vervoort’s system trading the AN futures contract using the results of a walkforward test with a training period of 250 bars and a forward period of 125 bars.
The code is shown here:
' AN EXPERT OF A SYSTEM

' Author: Sylvain Vervoort, TASC, October 2013

' Coded by: Richard Denning 8/11/2013

' www.TradersEdgeSystems.com


'--------------------------------------------------------

'Function to get Heinkin-Ashi close:

Function HA_CLOSE()

    Dim haC As BarArray

    Dim haO As BarArray

    Dim haH As BarArray

    Dim haL As BarArray

    Dim haCL As BarArray

    haC = (O+H+L+C)/4

    haO = IIF(BarNumber = FirstBar,O,(haO[1] + haC[1])/2)

    haH = Max(H,haO)

    haL = Min(L,haO)

    haCL = (haC+haO+haH+haL)/4

HA_CLOSE = haCL

End Function

'-------------------------------------------------------

'Function to get typical price:

Function TYP_PRICE()

TYP_PRICE = (H + L + C) / 3

End Function

'-------------------------------------------------------

'Code for custom indicator to plot the two moving averages:

Sub SV_EXPERT_IND(typLen,haLen)

    Dim typEMA As BarArray

    Dim haEMA As BarArray

    typEMA = XAverage(TYP_PRICE(),typLen)

    haEMA = XAverage(HA_CLOSE(),haLen)

    plot1(typEMA)

    plot2(haEMA)

End Sub

'--------------------------------------------------------

'Trading system cose:

Sub SV_EXPERT_SYS(typLen,haLen,LSB)

    'typLen = 5,haLen = 8

    'LSB = 1 (Longs only)

       ' = -1 (Shorts only)

       ' = 0 (Both Longs and Shorts)

    Dim typEMA As BarArray

    Dim haEMA As BarArray

    Dim Green, Red

    typEMA = XAverage(TYP_PRICE(),typLen)

    haEMA = XAverage(HA_CLOSE(),haLen)

    Green = typEMA >  haEMA And C >  O

    Red = typEMA <  haEMA And C <  O

    If Green And (LSB = 1 Or LSB = 0) Then Buy("LE",1,0,Market,Day)

    If Red Then ExitLong("LX","",1,0,Market,Day)

    If Red And (LSB = 0 Or LSB = -1) Then Sell("SE",1,0,Market,Day)

    If Green Then ExitShort("SX","",1,0,Market,Day)

End Sub
—Richard Denning
info@TradersEdgeSystems.com
for TradersStudio
BACK TO LIST

NINJATRADER: OCTOBER 2013
We have implemented the SpreadOscillator, as discussed in Sylvain Vervoort’s article in this issue, “An Expert Of A System,” as an indicator available for download at www.ninjatrader.com/SC/October2013SC.zip.
This indicator will allow you to calculate the spread between two commodities that you define, such as the S&P emini and the NASDAQ emini. There is also an SMA and standard deviation channel of the spread included to make finding extremes easier.
The study was based on intercommodity spreads, such as in cracks, sparks, and crushes:
- A crack spread is between crude oil and one of its byproducts such as gasoline or heating oil
- A spark spread is between natural gas and electricity from the gas-fired power stations
- A crush spread is between soybeans and one of it byproducts such as soy meal or soy oil.
This oscillator will give you the spread between the closing prices of the two commodities. You can then use the information as an input for your trading decision framework for both commodities.
Note that in our screenshot in Figure 11, the NQ was manually added to the chart for better visualization; it would not be needed for the actual study, though. The process of adding the additional series is done via the code programmatically.
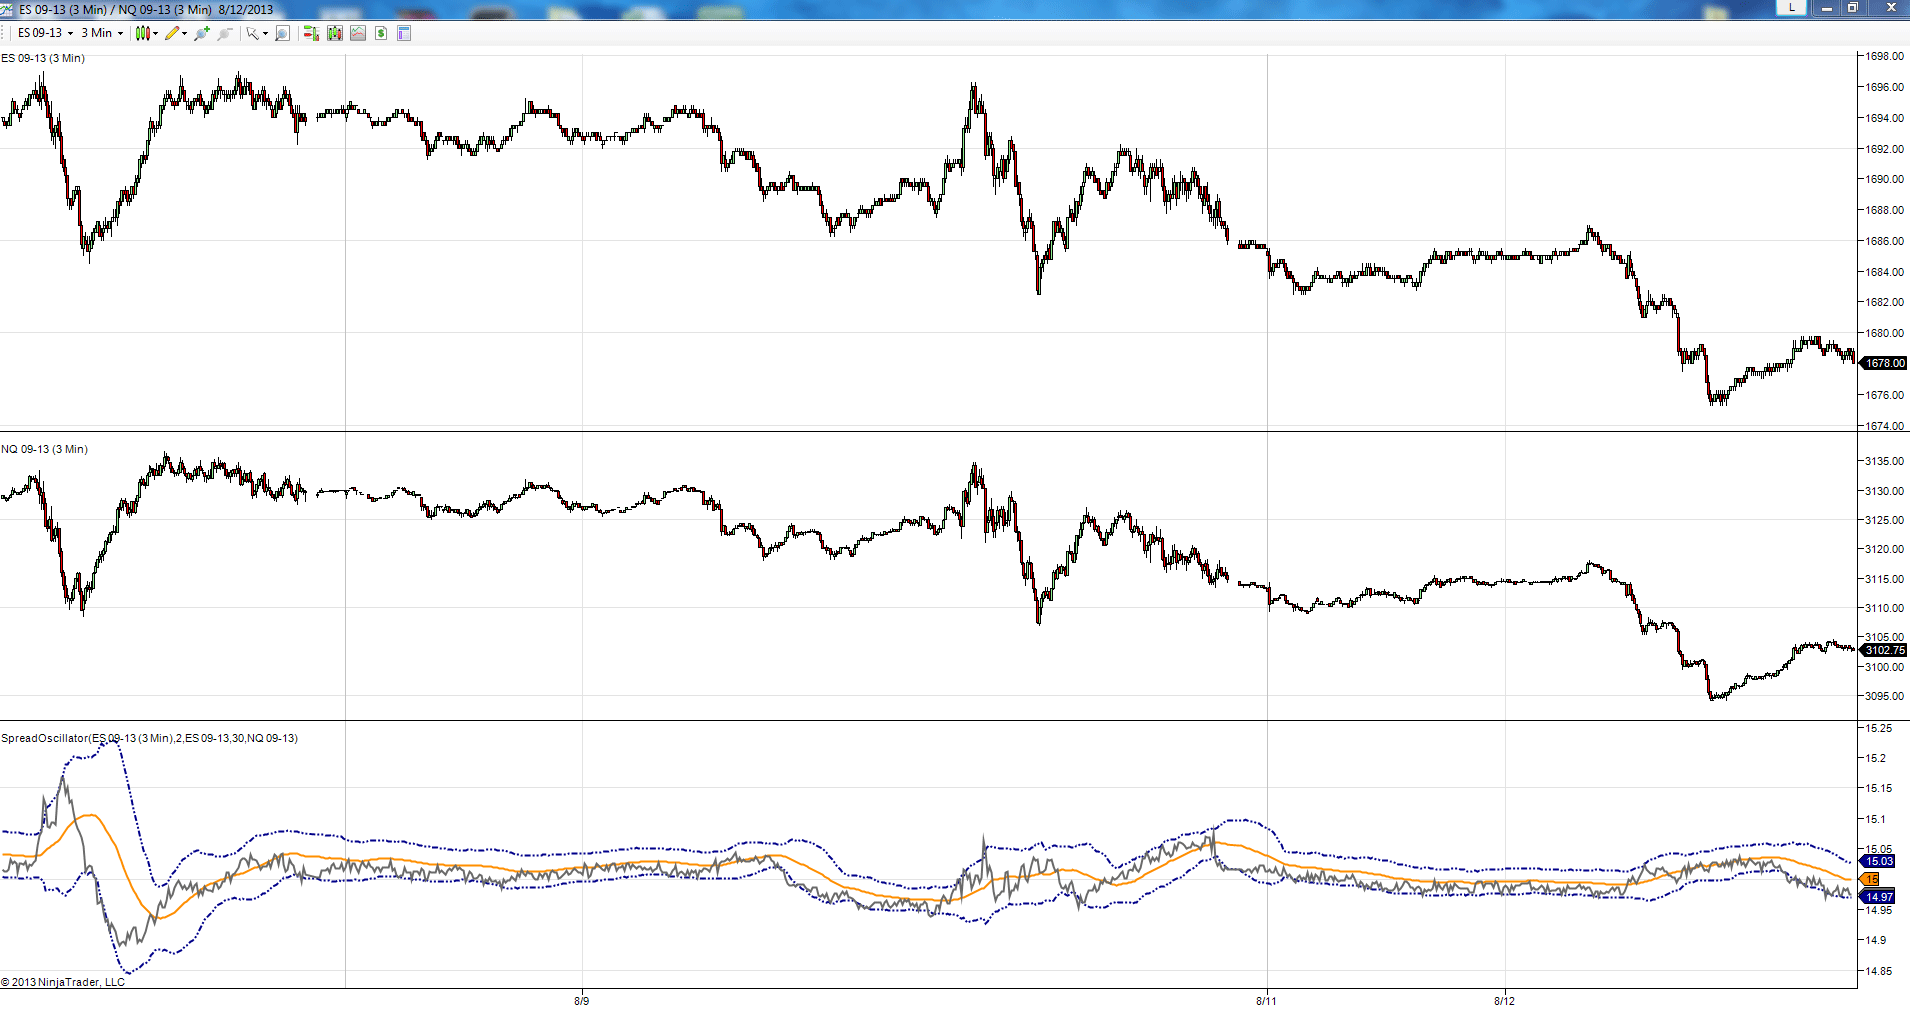
FIGURE 11: NINJATRADER. This screenshot shows the SpreadOscillator applied to a three-minute ES and NQ chart, with the spread between these two instruments in the last panel.
—Raymond Deux, Cal Hueber, & JC Wheatley
NinjaTrader, LLC
www.ninjatrader.com
BACK TO LIST

UPDATA: OCTOBER 2013
In “An Expert Of A System” in this issue, author Sylvain Vervoort presents the penultimate part in his ongoing series with a system utilizing heikin-ashi techniques to simplify entry & exit decisions. Vervoort exponentially smoothes the heikin-ashi candle close, and together with the exponentially smoothed typical price, he thus creates the basis of a crossover system. The system incorporates a percentage-based stop. All parameter values can be optimized within the Updata system optimizer.
The Updata code for this system (as well as the Updata code for Vervoort’s other articles in his ongoing series) has been added to the Updata library, which may be downloaded by clicking the custom menu and then system library. Those who cannot access the library due to a firewall may paste the code provided here into the Updata custom editor and save it.
NAME Heikin-Ashi Candle With Averages
NAME6 "Heikin-Ashi | Typical Cross" ""
PARAMETER "H-A Avg. Period" #haPERIOD=8
PARAMETER "Typical Avg. Period" #typPERIOD=5
PARAMETER "Stop Loss [%]" @STOPPCT=3
DISPLAYSTYLE 6LINES
INDICATORTYPE TOOL
INDICATORTYPE6 CHART
PLOTSTYLE CANDLE
PLOTSTYLE4 THICK2 RGB(0,200,0)
PLOTSTYLE5 THICK2 RGB(200,0,0)
PLOTSTYLE2 DOT RGB(150,150,150)
PLOTSTYLE3 DOT RGB(0,0,0)
@TYPICAL=0
@TYPICALAVG=0
@HEIKIN_ASHIAVG=0
@HA_TYPCROSS=0
@LONGSTOP=0
@SHORTSTOP=0
@LONGENTRYPRICE=0
@SHORTENTRYPRICE=0
FOR #CURDATE=MAX(#typPERIOD,#haPERIOD) TO #LASTDATE
   'VARIABLES
   @PLOTOPEN=(@PLOTOPEN+@PLOT)/2
   @PLOT=(OPEN+HIGH+LOW+CLOSE)/4
   @PLOTHIGH=MAX(MAX(HIGH,@PLOTOPEN),@PLOT)
   @PLOTLOW=MIN(MIN(LOW,@PLOTOPEN),@PLOT)
   @TYPICAL=(HIGH+LOW+CLOSE)/3
   @TYPICALAVG=SGNL(@TYPICAL,#typPERIOD,E)
   @HEIKIN_ASHIAVG=SGNL(@PLOT,#haPERIOD,E)
   'STOP ADJUSTMENT
   IF ORDERISOPEN=1
      IF CLOSE> @LONGENTRYPRICE*(1+(@STOPPCT/100))
         @LONGSTOP=@LONGENTRYPRICE
      ENDIF
      IF CLOSE< @LONGSTOP
         SELL CLOSE
      ENDIF
      @PLOT2=@LONGSTOP
      @PLOT3=-10000
   ELSEIF ORDERISOPEN=-1
      IF CLOSE< @SHORTENTRYPRICE*(1-(@STOPPCT/100))
         @SHORTSTOP=@SHORTENTRYPRICE
      ENDIF
      IF CLOSE> @SHORTSTOP
         COVER CLOSE
      ENDIF
      @PLOT3=@SHORTSTOP
      @PLOT2=-10000
   ELSE
      @PLOT2=-10000
      @PLOT3=-10000
   ENDIF
   'CROSSING AVG CONDITION
   IF @TYPICALAVG> @HEIKIN_ASHIAVG AND CLOSE> OPEN
      @HA_TYPCROSS=1
   ELSEIF @TYPICALAVG< @HEIKIN_ASHIAVG AND CLOSE< OPEN
      @HA_TYPCROSS=0
   ENDIF
   'MOV AVG EXITS
   IF @HA_TYPCROSS=1
      COVER CLOSE
   ELSEIF @HA_TYPCROSS=0
      SELL CLOSE
   ENDIF
   'ENTRY
   IF @HA_TYPCROSS=1
      IF ORDERISOPEN = 0
         @LONGSTOP=CLOSE*(1-(@STOPPCT/100))
         @LONGENTRYPRICE=CLOSE
      ENDIF
      BUY CLOSE
   ENDIF
   IF @HA_TYPCROSS=0
      IF ORDERISOPEN = 0
         @SHORTSTOP=CLOSE*(1+(@STOPPCT/100))
         @SHORTENTRYPRICE=CLOSE
      ENDIF
      SHORT CLOSE
   ENDIF
   'PLOT LINES
   @PLOT4=@TYPICALAVG
   @PLOT5=@HEIKIN_ASHIAVG
   @PLOT6=@HA_TYPCROSS
NEXT
A sample chart is shown in Figure 12.
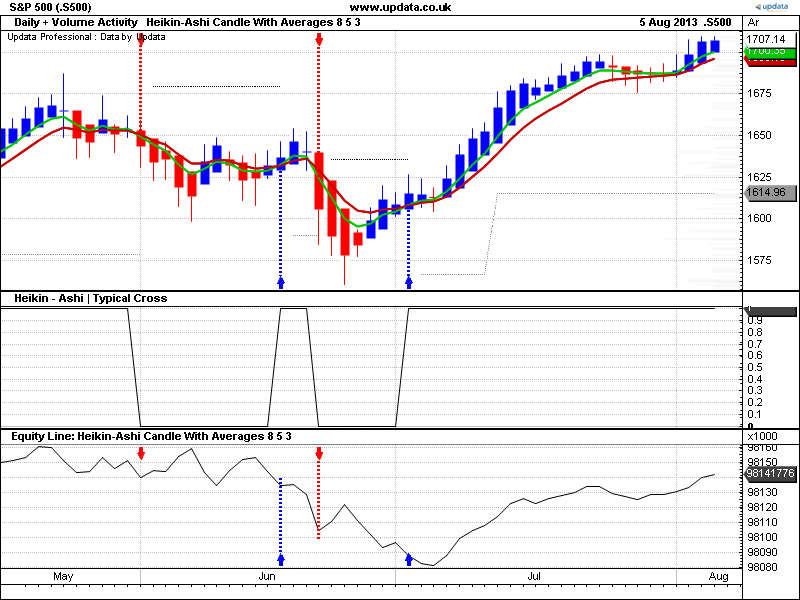
FIGURE 12: UPDATA. This chart shows the system catching a rally since July in the S&P 500.
—Updata support team
support@updata.co.uk
www.updata.co.uk
BACK TO LIST

TRADING BLOX: OCTOBER 2013
In “An Expert Of A System” in this issue, Sylvain Vervoort presents a trading system based on a moving average crossover of the heikin-ashi closing price and the typical closing price. The system uses a stop-loss and a breakeven stop to move the stop to breakeven once the trade has reached its target.
Creating an indicator in the variables section is preferable to using the update indicators script for calculations, since an indicator will have values by the start date of the test, allowing the system to take trades immediately. This is referred to as priming. The update indicators script starts its calculations on the start date, causing the indicator to be primed only after the bar length of the indicator has been reached. In this example, the heikin-ashi open price references a previous value of itself, so we must use the update indicators script to calculate the indicators.
The entry rules are defined in the entry orders script. A buy entry occurs when the typical moving average crosses above the heikin-ashi moving average and the close is greater than the open. The reverse is true for sell orders. A sample trade is shown in Figure 13.
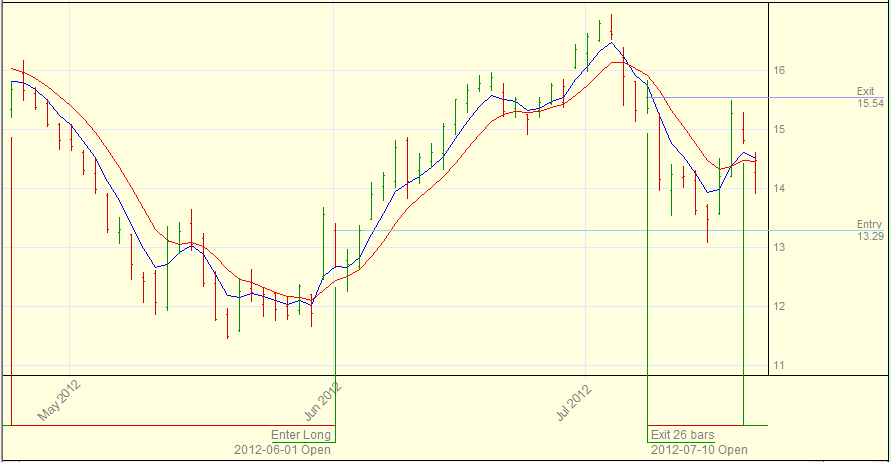
FIGURE 13: TRADING BLOX. Here is an example trade.
The stop-loss and breakeven are defined in the exit orders script. For this example, we set a label for each of the orders allowing identification in the trade report (Figure 14).

FIGURE 14: TRADING BLOX. Here is a sample trade report with rule label.
Vervoort’s article presents a forward-test from 2010 to 2013 on Ciena Corporation using values optimized from a back sample. The test we are presenting here for Trading Blox replicates Vervoort’s, starting with $10,000 and using a trade size of 100 shares. Our sample performance summary for the system is shown in Figure 15.
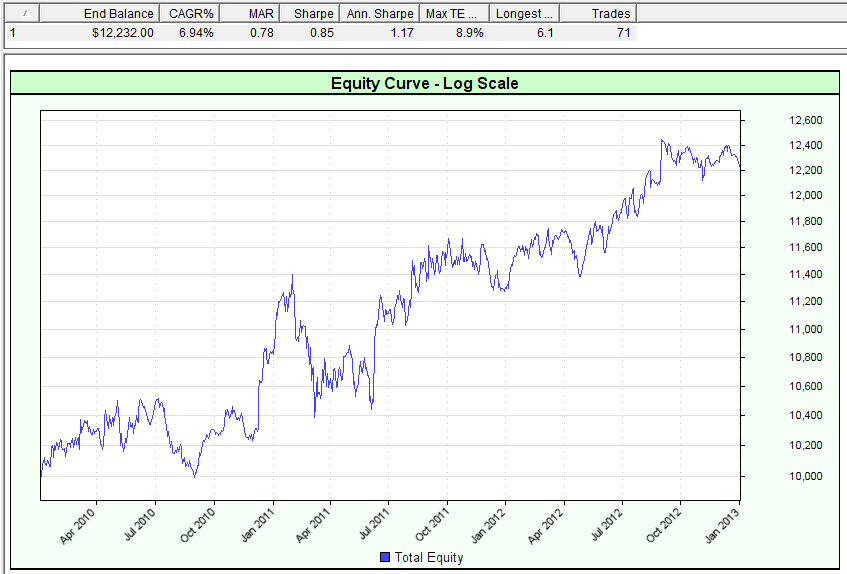
FIGURE 15: TRADING BLOX. Here is the performance summary for the moving average crossover system.
—Trading Blox
tradingblox.com
BACK TO LIST

VT TRADER: OCTOBER 2013
This Traders’ Tip is based on “An Expert Of A System” by Sylvain Vervoort in this issue. In the article, Vervoort describes a trading strategy using a five-period typical price and an eight-period moving average based on the heikin-ashi close.
We’ll be offering our version of the SVEHaTypCross trading system for download in our VT client forums at https://forum.vtsystems.com along with hundreds of other precoded and free trading systems. The complete VT Trader instructions for recreating the system are shown here.
- Ribbon→Technical Analysis menu→Trading Systems group→Trading Systems Builder command→[New] button
- In the General tab, type the following text for each field:
Name: TASC - 10/2013 - SVE Typ/haC MA Cross System
Function Name Alias: tasc_SVEHaTypCrossSys
Label Mask: 	TASC - 10/2013 - SVE Typ/haC MA Cross System
TypMA (%TypMaPeriods%) = %TypMa%
haCMA (%haCMaPeriods%) = %haCMa%
- In the Input Variable(s) tab, create the following variables:
[New] button...
Name: TypMaPeriods
Display Name: Typical MA Periods
Type: integer
Default: 5

[New] button...
Name: haCMaPeriods
Display Name: Heikin-Ashi MA Periods
Type: integer
Default: 8
- In the Output Variable(s) tab, create the following variables:
[New] button...
Var Name: TypMa
Name: Typical Price MA
* Checkmark: Indicator Output
Select Indicator Output Tab
Line Color: blue
Line Width: 2
Ling Style: solid
Placement: Price Frame
[OK] button...

[New] button...
Var Name: haCMA
Name: Heikin-Ashi Close Moving Avererage
* Checkmark: Indicator Output
Select Indicator Output Tab
Line Color: red
Line Width: 2
Ling Style: solid
Placement: Price Frame
[OK] button...

[New] button...
Var Name: LongTrend
Name: Long Trend
* Checkmark: Trends enabled
Select Trends Tab
	Display Vertical Lines: check
Background: green
Pattern: Solid
Symbol: Up Arrow
Symbol Color: white
[OK] button...

[New] button...
Var Name: ShortTrend
Name: Short Trend
* Checkmark: Trends enabled
Select Trends Tab
	Display Vertical Lines: check
Background: pink
Pattern: Solid
Symbol: Down Arrow
Symbol Color: white
[OK] button...

[New] button...
Var Name: LongSignal
Name: Long Signal
* Checkmark: Graphic Enabled
* Checkmark: Alerts Enabled
Select Graphic Tab
Font [...]: Up Arrow
Size: Medium
Color: Green
Symbol Position: Below price plot
	Select Alerts Tab
		Alert Message: Long signal detected!
		Alert Sound: others.wav
[OK] button...

[New] button...
Var Name: ShortSignal
Name: Short Signal
* Checkmark: Graphic Enabled
* Checkmark: Alerts Enabled
Select Graphic Tab
Font [...]: Down Arrow
Size: Medium
Color: Pink
Symbol Position: Above price plot
	Select Alerts Tab
		Alert Message: Short signal detected!
		Alert Sound: others.wav
[OK] button...

[New] button...
Var Name: OpenBuy
Name: Open Buy
* Checkmark: Trading Enabled
Select Trading Tab
Trading Action: BUY
[OK] button...

[New] button...
Var Name: CloseBuy
Name: Close Buy
* Checkmark: Trading Enabled
Select Trading Tab
Trading Action: SELL
[OK] button...

[New] button...
Var Name: OpenSell
Name: Open Sell
* Checkmark: Trading Enabled
Select Trading Tab
Trading Action: SELL
[OK] button...

[New] button...
Var Name: CloseSell
Name: Close Sell
* Checkmark: Trading Enabled
Select Trading Tab
Trading Action: BUY
[OK] button...
- In the Formula tab, copy and paste the following formula:
{Provided By: Visual Trading Systems, LLC}
{Copyright: 2013}
{Description: TASC, October 2013 2011 - "An Expert of a System" by Sylvain Vervoort}
{File: tasc_SVEHaTypCrossSys.vttrs - Version 1.0}

{Moving Averages}

TypMa:= Mov(TypicalPrice,TypMaPeriods,E);
haCMa:= Mov(haClose,haCMaPeriods,E);

{Signal Long and Short}

Long1:= TypMa> haCMa;
Long2:= C> O;

Short1:= TypMa< haCMa;
Short2:= C< O;

LongTrend:= SignalFlag(Long1 AND Long2, Short1 AND Short2);
ShortTrend:= SignalFlag(Short1 AND Short2, Long1 AND Long2);

LongSignal:= Cross(LongTrend,0.5);
ShortSignal:= Cross(ShortTrend,0.5);

{Auto-Trading Functionality; Used in Auto-Trade Mode Only}

OpenBuy:= BuyPositionCount()=0 AND LongSignal=1;
CloseBuy:= BuyPositionCount()> 0 AND ShortSignal=1;

OpenSell:= SellPositionCount()=0 AND ShortSignal=1;
CloseSell:= SellPositionCount()> 0 AND LongSignal=1;
- Click the “Save” icon to finish building the trading system.
To add the trading system to a VT Trader chart (see Figure 16), select the option to “add trading system” from the chart’s contextual menu, select “TASC - 10/2013 - SVE Typ/haC MA Cross System” from the trading systems list, and click the [Add] button.
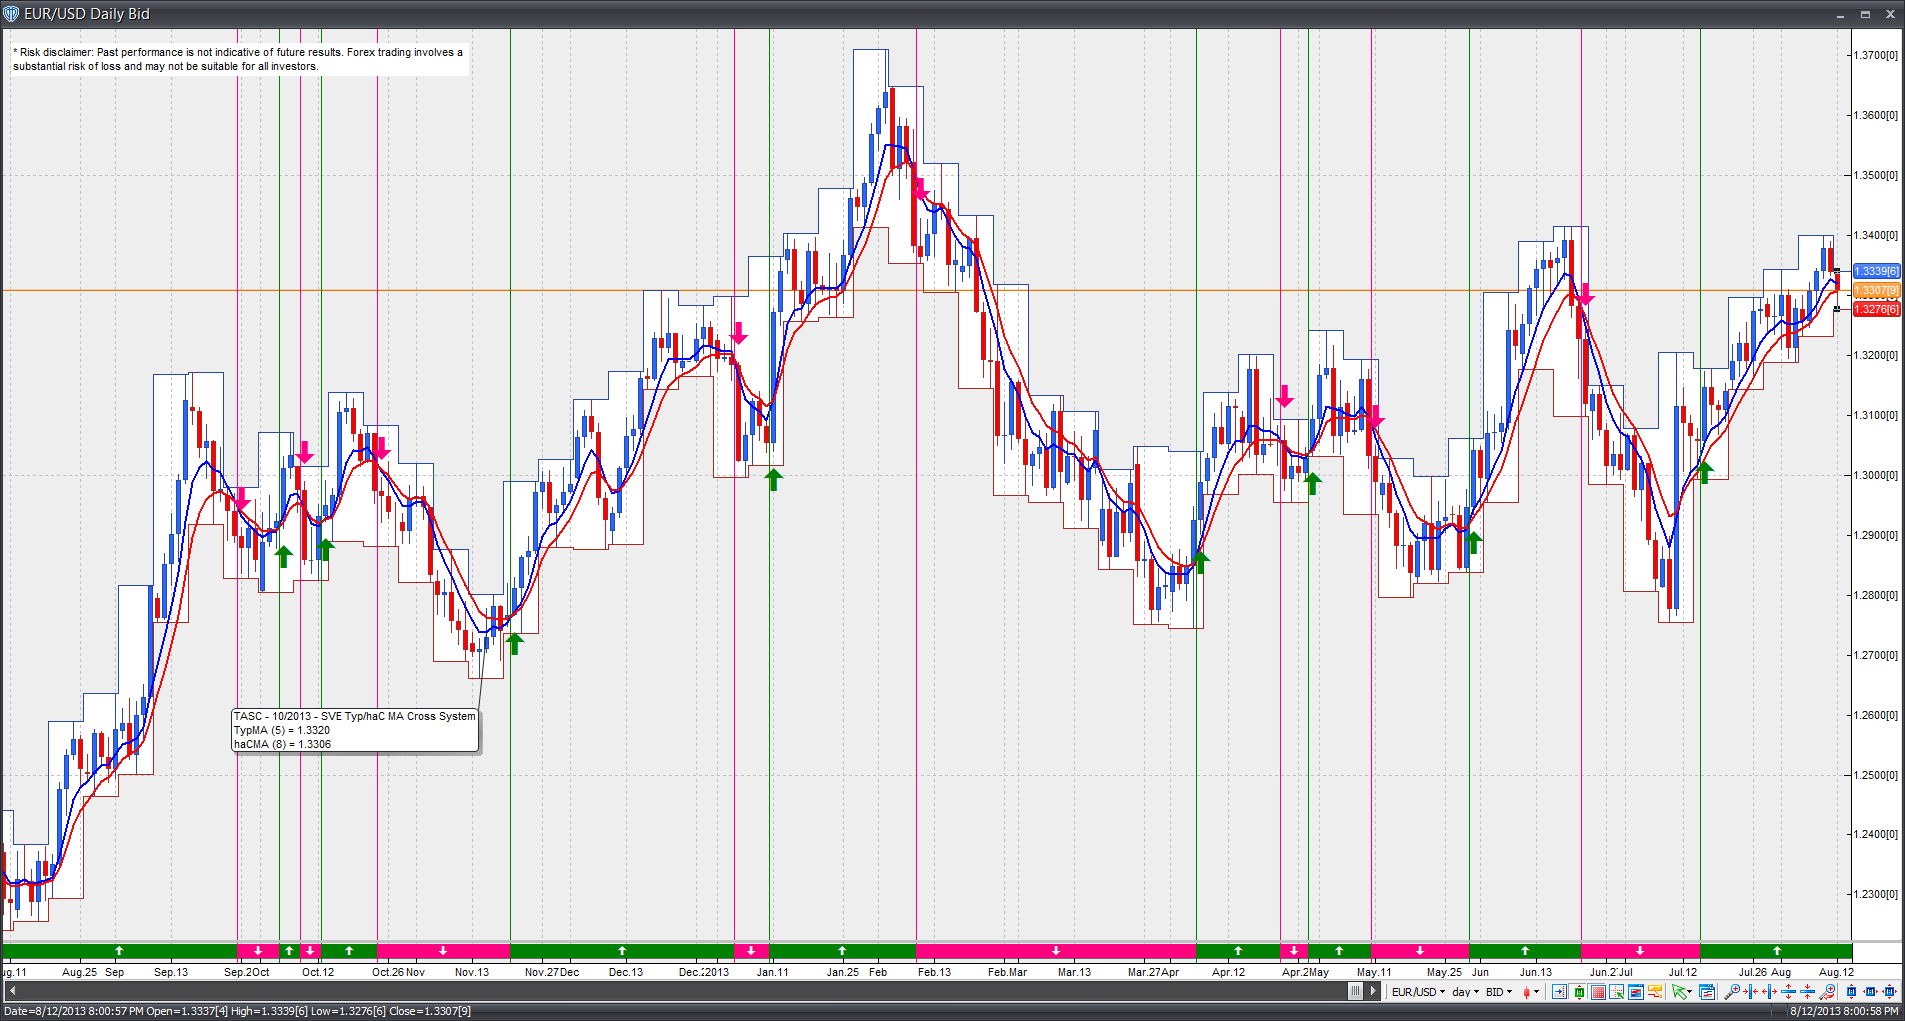
FIGURE 16: VT TRADER. Here is the SVEHaTypCross trading system attached to a EUR/USD daily candle chart.
To learn more about VT Trader, visit www.vtsystems.com.
Risk disclaimer: Past performance is not indicative of future results. Forex trading involves a substantial risk of loss and may not be suitable for all investors.
—Visual Trading Systems, LLC
vttrader@vtsystems.com, www.vtsystems.com
BACK TO LIST
MICROSOFT EXCEL: OCTOBER 2013
In “An Expert Of A System” in this issue, which is author Sylvain Vervoort’s sixth article in his ongoing series on indicator rules for a swing trading strategy (IRSTS), he shows us the basics of a crossover trading system.
The spreadsheet I am presenting here builds on last month’s spreadsheet (found in the September 2013 Traders’ Tips), which was based on Vervoort’s fifth part in his series, and is cumulative back to the beginning of the article series.
The calculations necessary for the crossover indicator described this month occupy nine columns beginning in column CK of the charts tab and extending through column CS. The calculations are straightforward and the results appear to be quite predictive of price behavior.
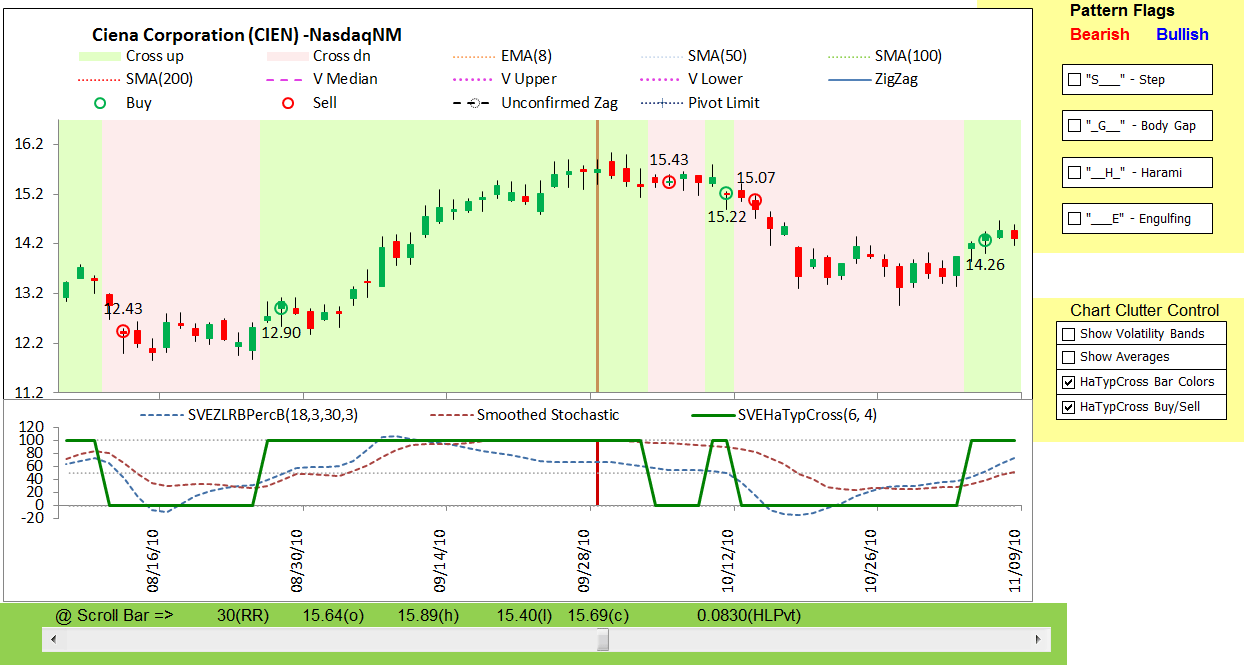
FIGURE 17: EXCEL, CROSSOVER INDICATOR. This sample chart shows Ciena Corporation with the SVEHaTypCross indicator, bar shading, and buy/sell markers similar to Figure 12 in Sylvain Vervoort’s article in this issue.
Excel does not provide a mechanism to individually color-code candlesticks similar to what Vervoort has done in Figure 2 of his article in this issue. As a stand-in, I have provided a checkbox-controlled mechanism that provides background colors.
Red and green circles show the buy & sell points using the open prices of the next bar after the signal is generated.
The “using” button will toggle between the standard EMA formula and a classic EMA formula for the crossover calculations. You may find it useful when fitting EMA length values to your data.
Note: The #N/A values you see here and elsewhere on the worksheet are not in error. This is a mechanism that allows a cell formula to produce a result so that the Excel charting engine will treat these “Not available” cells as though they were truly empty cells and thus not plot them on the chart.
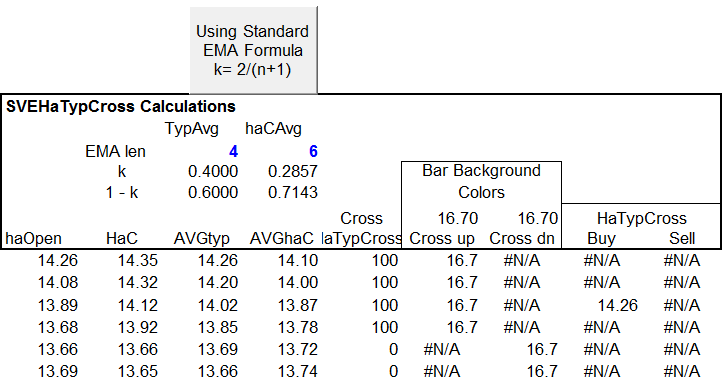
FIGURE 18: EXCEL, USER CONTROLS. User controls (in blue) for the crossover indicator can be found beginning at column CK.
The spreadsheet file for this Traders’ Tip can be downloaded here. To successfully download it, follow these steps:
- Right-click on the Excel file link, then
- Select “save target as” to place a copy of the spreadsheet file on your hard drive.
—Ron McAllister
Excel and VBA programmer
rpmac_xltt@sprynet.com
BACK TO LIST
Originally published in the October 2013 issue of
Technical Analysis of Stocks & Commodities magazine.
All rights reserved. © Copyright 2013, Technical Analysis, Inc.
Return to
Contents


