 Explore Your Options
Q&A
 Explore Your Options
Got a question about options? Tom Gentile is the chief options strategist at Optionetics (www.optionetics.com), an education and publishing firm dedicated to teaching investors how to minimize their risk while maximizing profits using options. To submit a question, post it on the Stocks & Commodities website Message-Boards. Answers will be posted there, and selected questions will appear in future issues of S&C.
“LAST IN, FIRST OUT”
Want to trade options just one day a month? One of my students wanted to and was asking me about it at a recent West Coast seminar. It seems this option trader wants to trade options short-term, based on a well known — and pretty good — system that signals a bullish day in the stock market each month. That’s right, he wants to enter the market at the close of business on one day and exit the position the following trading day at the open, and wanted to know which option strategy would best fit his bullish prognosis. Now that I have piqued your interest, let me first explain the seasonal (or psychological) tendency before discussing using options as a surrogate for the asset.
First trading day of the month
I first learned of this pattern from Jeffrey Hirsch, cofounder of the Stock Trader’s Almanac. It seems there is a tendency for the stock market to move higher over the first trading day of each month. Why does this tendency happen? It has long been thought that hedge fund, mutual fund, and retirement fund managers are putting money to work at the end of each month and the beginning of the following month, adding to their positions. Even if this is just hearsay, the idea alone is enough for the crowd to push money to the buy side. A push on various large-cap stocks is enough to move the index markets for that day. When does this move actually occur, how much of a move happens, and most important, how can a trader take advantage of this?
Past results
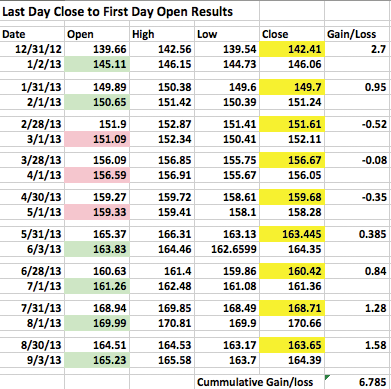
I first did some research on the long-term history of this pattern. It seems that before the mid 90s, this pattern really didn’t exist. As more and more money is being managed now, it seems the pattern has really come into its own since then. In fact, since the mid 90s, this one-day pattern has seen bigger moves, with less drawdown than buying and holding the entire month. Buy & hold as a strategy means being in the markets and at risk all of the time, while buy & sold keeps money in the market at only the most opportune time, placing it in cash and out of risk when historical probabilities are less certain. Since 1998, the first day of the month has averaged about 66% effectiveness, but since 2003, the percentage of winning days has jumped to over 75%. So how have we done this year? The table in Figure 1 looks at the S&P 500 Depository Receipts (SPY) on a month-by-month basis as it closely tracks the index.

FIGURE 1: SPY ON A MONTH-BY-MONTH BASIS.
The rows to the left all have the last trading day of the month and the corresponding first trading day of the following month this year for the SPY. I have highlighted the close in yellow, and the following opening in green if higher, red if lower. It has been a good year for our little strategy, with winners outpacing losers at a rate of 6 to 3 (through September 2013). Notice the losers — they are small, with the biggest loser amounting to 0.52. Averaging up the winners to losers represents a win-to-loss ratio of better than 5:1 this year, and that’s on the asset. So this strategy has been holding up nicely in 2013 thus far.
On to the question: How do we create a trade substitution for the SPY with an acceptable risk? It’s simple: by using call options on the SPY. But not just any options. You need something that can best replicate the movement of the SPY, and you need to be able to get in & out of it in less than a day. If you are buying calls, an in-the-money (ITM) option with a higher delta will do. Most of all, you need efficiency and liquidity due to the short-term hold on the position. What you need to look at are weekly options. Weekly options are exactly what they stand for: an option that has as much as one week to expiration. The SPY weekly options provide efficiency, liquidity, and a variety of strikes that will allow you to find an ITM option that moves like its underlying. Let’s take a look at the last example above, using an ITM option instead.
SPY closed at 163.65 at the end of August, and opened up September 2, 2013 at 165.23 for a gain of 1.58. That’s a little less than a 1% return in one day. Not bad, but using the ITM weekly 160 calls would have cost much less and yielded a better ROI. On Friday, August 30, 2013, the weekly 160 calls closed out at 4.28. The following trading day, September 3, the same 160 calls opened up at 4.56, or 28 cents higher. The return on investment here is more than 5%. There are commissions & slippage to deal with, but this strategy using options is very interesting and is something for the option trader to consider.
‡Integrated Investor (Hubb Group www.hubb.com)