TRADING SYTEMS
There’s More To It Than Luck
It sounds complicated, but it’s actually simple. In this first part of a two-part series, find out how to use this strategy to place buy & sell orders as well as the best way to test the strategy.
In a May 1998 STOCKS & COMMODITIES article, I examined a trading system that used the velocity of prices fit by a least-squares straight line through N past prices to determine buy & sell points. The reasoning behind this type of system was to only trade when the straight-line slope or velocity was above a certain threshold. Oftentimes, during the day, prices meander without a notable trend. When prices move around like that, we don’t want to trade because of the whipsaw losses that can occur from this type of price action. When a price trend finally begins, the velocity of that price trend moves above some minimum threshold value. Thus, the velocity system would only issue a trade when certain velocity barriers were crossed.
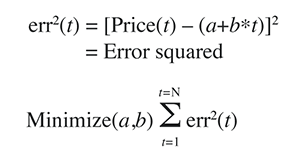
The least-squares polynomial is determined by minimizing the sum of the squares of the difference between N prices and the value of the polynomial line:
This mathematical technique has an exact solution that dates back to mathematician and scientist Carl Friedrich Gauss in the 1800s.
THE POINT OF BREAKDOWN
Recently, a lot of work has been done in what is called robust regression and outlier detection techniques. Robust regression techniques are now defined by a measure called the breakdown point. The breakdown point is loosely defined as the smallest amount of bad data points that can cause the regression coefficient solutions to take on values some distance from their true values. Unfortunately, the least-squares technique has a breakdown point of 1/N. In other words, just one bad data point can significantly change the computation of the velocity or slope of a straight line. The median of a set of numbers has a breakdown point of 50%. This is because when 50% of the numbers are bad, then there is no way of telling which are the bad numbers and which are the good numbers. The highest breakdown point is 50%.
| X | 1 | 2 | 3 | 4 | 5 | 6 | 7 | 8 | 9 | 10 | 11 | 12 | 13 | 14 | 15 |
| Y | 1 | 2 | 3 | 4 | 5 | 6 | 7 | 8 | 9 | 18 | 11 | 12 | 13 | 18 | 15 |
FIGURE 1: DATA POINTS. Here are the 15 data points used to demonstrate the breakdown point. Two bad Y points are added at X positions 10 and 14.