INTERMARKET ANALYSIS
The World Of Yields
Understanding The Yield Curve Part 2
by Giorgos Siligardos, PhD
Last month in part 1, we presented the basics of yield curve analysis. Here, we review its historical performance in various countries through the use of yield spread indicators.
What constitutes a positive or negative yield curve? The strict definition is that a yield curve (YC) is positive when all of its parts are rising; it’s negative when all of its parts are falling; and it’s flat when it’s a straight horizontal line. Oftentimes, however, the YC is close to being considered positive or negative even though parts of it — usually the far left and/or far right — do not conform to the strict definition (Figure 1). Further, it is almost impossible for the yields of all maturities to be exactly the same, which means that if you go by the strict definition of a flat curve, realistically you will probably never find a flat curve. From studying past performance of yield curves, I have found that these loosely positive and negative curves have similar implications for the economy as the outright positive and negative ones do. This is why it is necessary to be more flexible in defining the YC. The simplest way to do this is through yield spread indicators.
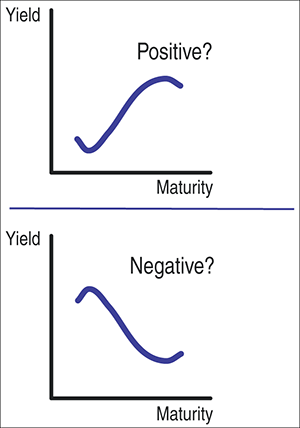
FIGURE 1: VARIATIONS OF POSITIVE AND NEGATIVE YIELD CURVES. By a strict definition, a yield curve is positive when all of its parts are rising and is negative when all of its parts are falling. Oftentimes, there are only some parts of the curve (usually the far left and far right) that don’t conform to those requirements. In the upper chart, it’s natural to assume that overall, the curve has a positive slope, whereas in the lower chart, you see a curve with a negative slope. The implications of these curves for the market are usually more or less the same as if these curves were outright positive or negative, respectively.
YIELD SPREAD INDICATORS
Academics usually study differences (known as “spreads”) between long- and short-term government debt securities (GDS) as surrogates of the YC shape in order to see how well they relate to business and economic cycles.
Excerpted from an article originally published in the December
2013 issue of Technical Analysis of Stocks & Commodities magazine. All rights reserved. © Copyright 2013, Technical Analysis, Inc.
Return to Contents