TRADERS’ TIPS
January 2014

For this month’s Traders’ Tips, the focus is mainly
John Ehlers’ article in this issue, “Predictive And Successful
Indicators.” Here we present the January 2014 Traders’ Tips
code with possible implementations in various software.
Code for TradeStation is already provided in Ehlers’ article.
Subscribers will find that code at the Subscriber Area of our website, www.Traders.com.
(Click on “Article Code” from the S&C menu.) Presented here
is an overview of possible implementations for other software.
Traders’ Tips code is provided to help the reader implement
a selected technique from an article in this issue. The entries are contributed
by various software developers or programmers for software that is capable
of customization.

TRADESTATION: JANUARY 2014 TRADERS’ TIPS
CODE
In “Predictive And Successful Indicators” in this issue, author
John Ehlers describes a new method for smoothing market data while reducing
the lag that most other smoothing techniques have. Ehlers has provided some
TradeStation code in his article for several indicators and describes an approach
for creating a strategy. For convenience, we will make the same code available
at our EasyLanguage support forum as well as an example strategy based on Ehlers’ description.
To download the EasyLanguage code, please visit our TradeStation and EasyLanguage
support forum. The code can be found here: www.tradestation.com/TASC-2014.
The ELD filename is “_TASC_PredictiveIndicators.ELD.” For more
information about EasyLanguage in general, please see www.tradestation.com/EL-FAQ.
The code is also shown below.
_Ehlers_SuperSmoother Filter (Indicator)

variables:
	a1( 0 ),
	b1( 0 ),
	c1( 0 ),
	c2( 0 ),
	c3( 0 ),
	Filt( 0 ) ;

a1 = ExpValue( -1.414 * 3.14159 / 10 ) ;
b1 = 2 * a1 * Cosine( 1.414 * 180 / 10 ) ;
c2 = b1 ;
c3 = -a1 * a1 ;
c1 = 1 - c2 - c3 ;
Filt = c1 * ( Close + Close[1] )
	/ 2 + c2 * Filt[1] + c3 * Filt[2] ;

Plot1( Filt, "SuperSmooth" ) ;


_Ehlers_Roofing Filter (Indicator)

variables:
	alpha1( 0 ),
	HP( 0 ),
	a1( 0 ),
	b1( 0 ),
	c1( 0 ),
	c2( 0 ),
	c3( 0 ),
	Filt( 0 ) ;

alpha1 = ( Cosine( .707 * 360 / 48 )
	+ Sine ( .707 * 360 / 48 ) - 1 )
	/ Cosine( .707 * 360 / 48 ) ;

HP = ( 1 - alpha1 / 2 ) * ( 1 - alpha1 / 2 )
	* ( Close - 2 * Close[1] + Close[2] )
	+ 2 * ( 1 - alpha1 ) * HP[1] - ( 1 - alpha1 )
	* ( 1 - alpha1 ) * HP[2] ;

a1 = ExpValue( -1.414 * 3.14159 / 10 ) ;
b1 = 2 * a1 * Cosine( 1.414 * 180 / 10 ) ;
c2 = b1 ;
c3 = -a1 * a1 ;
c1 = 1 - c2 - c3 ;
Filt = c1 *( HP + HP[1] ) / 2
	+ c2 * Filt[1] + c3 * Filt[2] ;

Plot1( Filt, "SS Filter" ) ;
Plot2( 0, "Zero Line" ) ;


_Ehlers_SuperSmoothStoch (Indicator)

inputs:
	Length( 20 ),
	OBLevel( .8 ),
	OSLevel( .2 ) ;

variables:
	alpha1( 0 ),
	HP( 0 ),
	a1( 0 ),
	b1( 0 ),
	c1( 0 ),
	c2( 0 ),
	c3( 0 ),
	Filt( 0 ),
	HighestC( 0 ),
	LowestC( 0 ),
	count( 0 ),
	Stoc( 0 ),
	MyStochastic( 0 ) ;

alpha1 = ( Cosine( .707 * 360 / 48 )
	+ Sine ( .707 * 360 / 48 ) - 1 )
	/ Cosine( .707 * 360 / 48 ) ;

HP = ( 1 - alpha1 / 2 ) * ( 1 - alpha1 / 2 )
	* ( Close - 2 * Close[1] + Close[2] )
	+ 2 * ( 1 - alpha1 ) * HP[1] - ( 1 - alpha1 )
	* ( 1 - alpha1 ) * HP[2] ;

a1 = ExpValue( -1.414 * 3.14159 / 10 ) ;
b1 = 2 * a1 * Cosine( 1.414 * 180 / 10 ) ;
c2 = b1 ;
c3 = -a1 * a1 ;
c1 = 1 - c2 - c3 ;
Filt = c1 *( HP + HP[1] ) / 2
	+ c2 * Filt[1] + c3 * Filt[2] ;

HighestC = Filt ;
LowestC = Filt ;

For count = 0 to Length - 1
	begin
	if Filt[count] > HighestC then
		HighestC = Filt[count] ;
	if Filt[count] < LowestC then
		LowestC = Filt[count] ;
	end;

Stoc = ( Filt - LowestC ) / ( HighestC - LowestC ) ;
MyStochastic = c1 * ( Stoc + Stoc[1] ) / 2 +
	c2 * MyStochastic[1] + c3 * MyStochastic[2] ;

Plot1( MyStochastic, "Stoch" ) ;
Plot2( OBLevel, "OverBought" ) ;
Plot6( OSLevel, "OverSold" ) ;


_Ehlers_SuperSmoothStoch (Strategy)

inputs:
	Length( 20 ),
	OBLevel( .8 ),
	OSLevel( .2 ) ;

variables:
	alpha1( 0 ),
	HP( 0 ),
	a1( 0 ),
	b1( 0 ),
	c1( 0 ),
	c2( 0 ),
	c3( 0 ),
	Filt( 0 ),
	HighestC( 0 ),
	LowestC( 0 ),
	count( 0 ),
	Stoc( 0 ),
	MyStochastic( 0 ) ;

alpha1 = ( Cosine( .707 * 360 / 48 )
	+ Sine ( .707 * 360 / 48 ) - 1 )
	/ Cosine( .707 * 360 / 48 ) ;

HP = ( 1 - alpha1 / 2 ) * ( 1 - alpha1 / 2 )
	* ( Close - 2 * Close[1] + Close[2] )
	+ 2 * ( 1 - alpha1 ) * HP[1] - ( 1 - alpha1 )
	* ( 1 - alpha1 ) * HP[2] ;

a1 = ExpValue( -1.414 * 3.14159 / 10 ) ;
b1 = 2 * a1 * Cosine( 1.414 * 180 / 10 ) ;
c2 = b1 ;
c3 = -a1 * a1 ;
c1 = 1 - c2 - c3 ;
Filt = c1 *( HP + HP[1] ) / 2
	+ c2 * Filt[1] + c3 * Filt[2] ;

HighestC = Filt ;
LowestC = Filt ;

For count = 0 to Length - 1
	begin
	if Filt[count] > HighestC then
		HighestC = Filt[count] ;
	if Filt[count] < LowestC then
		LowestC = Filt[count] ;
	end;

Stoc = ( Filt - LowestC ) / ( HighestC - LowestC ) ;
MyStochastic = c1 * ( Stoc + Stoc[1] ) / 2 +
	c2 * MyStochastic[1] + c3 * MyStochastic[2] ;

if MyStochastic crosses over ObLevel then
	SellShort next bar at Market
else if MyStochastic crosses under OsLevel then
	Buy next bar at Market ;
A sample chart is shown in Figure 1.
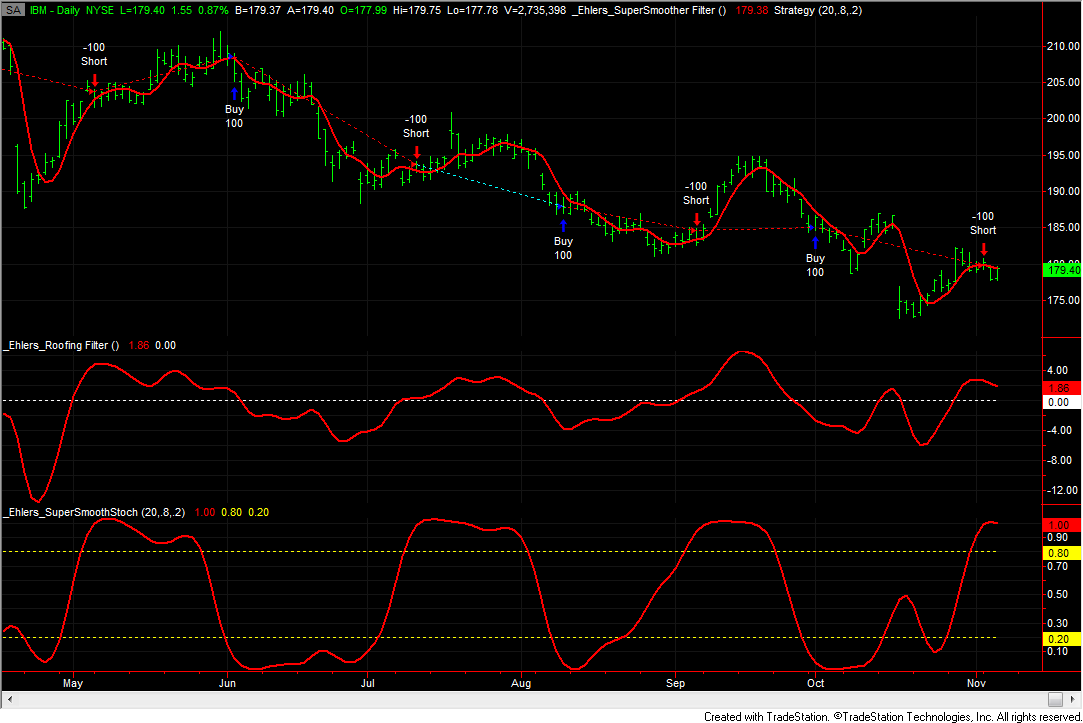
FIGURE 1: TRADESTATION. This daily chart of IBM shows
the indicators and strategy from John Ehlers’ article in this issue.
This article is for informational purposes. No type of trading or investment
recommendation, advice, or strategy is being made, given, or in any manner
provided by TradeStation Securities or its affiliates.
—Doug McCrary
TradeStation Securities, Inc.
www.TradeStation.com
BACK TO LIST

eSIGNAL: JANUARY 2014 TRADERS’ TIPS
CODE
For this month’s Traders’ Tip, we’ve provided the formulas
MESA_Stochastic_Indicator.efs, Roofing_Filter.efs, and SuperSmoother_Filter.efs,
based on the formulas described in John Ehlers’ article in this isuse, “Predictive
And Successful Indicators.”
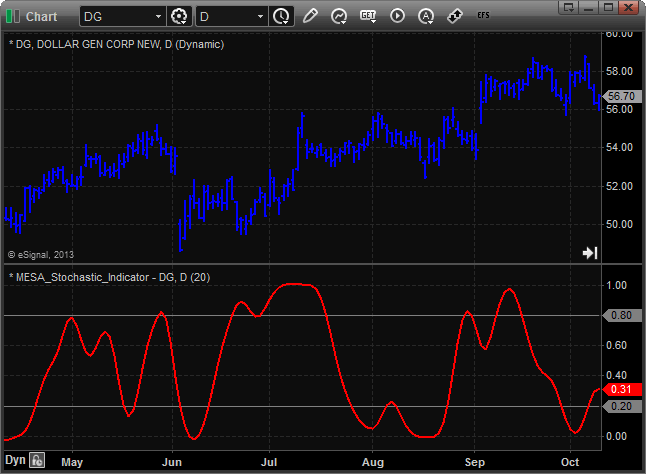
FIGURE 2: eSIGNAL, MESA STOCHASTIC
The MESA_Stochastic_Indicator study (Figure 2) contains one formula parameter, length,
which may be configured through the edit chart window (right-click
on chart and select edit chart). The roofing filter is shown
in Figure 3.
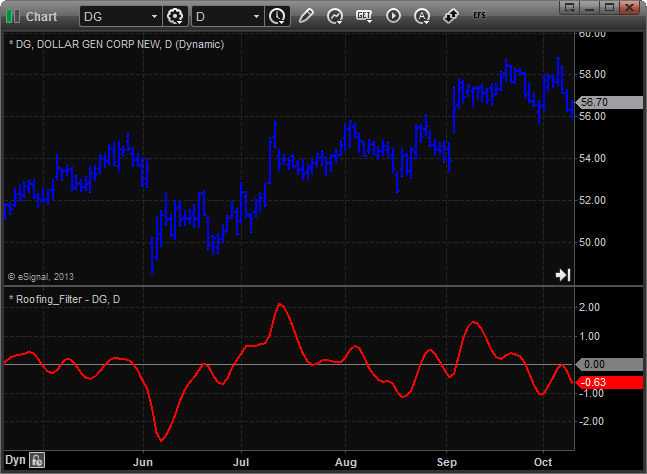
FIGURE 3: eSIGNAL, ROOFING FILTER
To discuss this study or download a complete copy of the formula code, please
visit the EFS Library Discussion Board forum under the Forums link from the
support menu at www.esignal.com or visit
our EFS KnowledgeBase at https://www.esignal.com/support/kb/efs/.
The eSignal formula scripts (EFS) are also available for copying & pasting
below.
MESA_Stochastic_Indicator.efs
/*********************************
Provided By:
    Interactive Data Corporation (Copyright © 2013)
    All rights reserved. This sample eSignal Formula Script (EFS)
    is for educational purposes only. Interactive Data Corporation
    reserves the right to modify and overwrite this EFS file with
    each new release.

Description:
    Stochastic Indicator by John F. Ehlers

Formula Parameters:                     Default:
Length                                  20

Version:            1.00  11/07/2013

Notes:
    The related article is copyrighted material. If you are not a subscriber
    of Stocks & Commodities, please visit www.traders.com.

**********************************/

var fpArray = new Array();

function preMain()
{
    setStudyTitle("MESA_Stochastic_Indicator");

    setCursorLabelName("BandLine1", 0);
    setCursorLabelName("BandLine2", 1);
    setCursorLabelName("MyStochastic", 2);

    setDefaultBarFgColor(Color.grey, 0);
    setDefaultBarFgColor(Color.grey, 1);
    setDefaultBarFgColor(Color.red, 2);

    setDefaultBarThickness(1, 0);
    setDefaultBarThickness(1, 1);
    setDefaultBarThickness(2, 2);

    setShowCursorLabel(false, 0);
    setShowCursorLabel(false, 1);
    setShowCursorLabel(true, 2);

    var x = 0;

    fpArray[x] = new FunctionParameter("fpLength", FunctionParameter.NUMBER);
    with(fpArray[x++])
    {
        setName("Length");
        setLowerLimit(2);
        setDefault(20);
    }
}

var bInit = false;
var bVersion = null;

var xHP = null;
var xFilt = null;
var xStoc = null;
var xMyStochastic = null;

var nBandLine1 = 0;
var nBandLine2 = 0;

function main(fpLength)
{
    if (bVersion == null) bVersion = verify();
    if (bVersion == false) return;

    if (!bInit)
    {
        xHP = efsInternal("Calc_HPSeries");
        xFilt = efsInternal("Calc_FiltSeries", xHP);
        xStoc = efsInternal("Calc_Stoc", xFilt, fpLength);
        xMyStochastic = efsInternal("Calc_MyStochastic", xStoc);

        nBandLine1 = 0.8;
        nBandLine2 = 0.2;

        bInit = true;
    }

    var nMyStochastic = xMyStochastic.getValue(0);

    return [nBandLine1, nBandLine2, nMyStochastic];
}

var xClose = null;

var alpha1 = 0;

function Calc_HPSeries()
{
    if (getBarState() == BARSTATE_ALLBARS)
    {
        xClose = close();

        alpha1 = (Math.cos((.707*360 / 48) * Math.PI / 180) +
                  Math.sin((.707*360 / 48) * Math.PI / 180) - 1) /
                  Math.cos((.707*360 / 48) * Math.PI / 180);
    }

    var nClose_0 = xClose.getValue(0);
    var nClose_1 = xClose.getValue(-1);
    var nClose_2 = xClose.getValue(-2);

    if (nClose_1 == null || nClose_2 == null)
        return;

    var nHP_1 = ref(-1);
    var nHP_2 = ref(-2);

    var nReturnValue = (1 - alpha1 / 2) * (1 - alpha1 / 2) * (nClose_0 - 2 * nClose_1 + nClose_2)
                       + 2 * (1 - alpha1) * nHP_1 - (1 - alpha1) * (1 - alpha1) * nHP_2;

    return nReturnValue;
}

var a1 = 0;
var b1 = 0;
var c1 = 0;
var c2 = 0;
var c3 = 0;

function Calc_FiltSeries(xHP)
{
    if (getBarState() == BARSTATE_ALLBARS)
    {
        a1 = Math.exp(-1.414 * 3.14159 / 10);
        b1 = 2 * a1 * Math.cos((1.414 * 180 / 10)* Math.PI / 180);
        c2 = b1;
        c3 = -a1 * a1;
        c1 = 1 - c2 - c3;
    }

    var nHP_0 = xHP.getValue(0);
    var nHP_1 = xHP.getValue(-1);

    if (nHP_0 == null || nHP_1 == null)
        return;

    var nFilt_1 = ref(-1);
    var nFilt_2 = ref(-2);

    var nReturnValue = c1 * (nHP_0 + nHP_1) / 2 + c2 * nFilt_1 + c3 * nFilt_2;

    return nReturnValue;
}

function Calc_Stoc(xFilt, nLength)
{
    var nFilt = xFilt.getValue(0);
    var nHighestC = xFilt.getValue(0);
    var nLowestC = xFilt.getValue(0);

    if (nHighestC == null || nLowestC == null || nFilt == null)
        return;

    for (var i = 0; i < nLength; i++)
    {
       nFilt_i = xFilt.getValue(-i);

       if (nFilt_i == null)
           return;

       if (nFilt_i > nHighestC)
           nHighestC =  nFilt_i;
       if (nFilt_i < nLowestC)
           nLowestC =  nFilt_i;
    }

    var nReturnValue = (nFilt - nLowestC) / (nHighestC - nLowestC);

    return nReturnValue;
}

function Calc_MyStochastic(xStoc)
{
    if (getBarState() == BARSTATE_ALLBARS)
    {
        a1 = Math.exp(-1.414 * 3.14159 / 10);
        b1 = 2 * a1 * Math.cos((1.414 * 180 / 10)* Math.PI / 180);
        c2 = b1;
        c3 = -a1 * a1;
        c1 = 1 - c2 - c3;
    }

    var nStoc_0 = xStoc.getValue(0);
    var nStoc_1 = xStoc.getValue(-1);

    if (nStoc_0 == null || nStoc_1 == null)
        return;

    var nMyStochastic_1 = ref(-1);
    var nMyStochastic_2 = ref(-2);

    var nReturnValue = c1 * (nStoc_0 + nStoc_1) / 2 + c2 * nMyStochastic_1 + c3 * nMyStochastic_2;

    return nReturnValue;
}

function verify()
{
    var b = false;
    if (getBuildNumber() < 779)
    {
        drawTextAbsolute(5, 35, "This study requires version 8.0 or later.",
            Color.white, Color.blue, Text.RELATIVETOBOTTOM|Text.RELATIVETOLEFT|Text.BOLD|Text.LEFT,
            null, 13, "error");
        drawTextAbsolute(5, 20, "Click HERE to upgrade.@URL=https://www.esignal.com/download/default.asp",
            Color.white, Color.blue, Text.RELATIVETOBOTTOM|Text.RELATIVETOLEFT|Text.BOLD|Text.LEFT,
            null, 13, "upgrade");
        return b;
    }
    else
    {
        b = true;
    }

    return b;
}
Roofing_Filter.efs
/*********************************
Provided By:
    Interactive Data Corporation (Copyright © 2013)
    All rights reserved. This sample eSignal Formula Script (EFS)
    is for educational purposes only. Interactive Data Corporation
    reserves the right to modify and overwrite this EFS file with
    each new release.

Description:
    Roofing Filter by John F. Ehlers

Version:            1.00  11/07/2013

Notes:
    The related article is copyrighted material. If you are not a subscriber
    of Stocks & Commodities, please visit www.traders.com.

**********************************/

function preMain()
{
    setStudyTitle("Roofing_Filter");

    setCursorLabelName("ZeroLine", 0);
    setCursorLabelName("Roofing_Filter", 1);

    setDefaultBarFgColor(Color.grey, 0);
    setDefaultBarFgColor(Color.red, 1);

    setDefaultBarThickness(1, 0);
    setDefaultBarThickness(2, 1);

    setShowCursorLabel(false, 0);
    setShowCursorLabel(true, 1);
}

var bInit = false;
var bVersion = null;

var xHP = null;
var xFilt = null;

function main()
{
    if (bVersion == null) bVersion = verify();
    if (bVersion == false) return;

    if (!bInit)
    {
        xHP = efsInternal("Calc_HPSeries");
        xFilt = efsInternal("Calc_FiltSeries", xHP);

        bInit = true;
    }

    var nZeroLine = 0;

    var nFilt = xFilt.getValue(0);

    return [nZeroLine, nFilt];
}

var xClose = null;

var alpha1 = 0;

function Calc_HPSeries()
{
    if (getBarState() == BARSTATE_ALLBARS)
    {
        xClose = close();

        alpha1 = (Math.cos((.707*360 / 48) * Math.PI / 180) +
                  Math.sin((.707*360 / 48) * Math.PI / 180) - 1) /
                  Math.cos((.707*360 / 48) * Math.PI / 180);
    }

    var nClose_0 = xClose.getValue(0);
    var nClose_1 = xClose.getValue(-1);
    var nClose_2 = xClose.getValue(-2);

    if (nClose_1 == null || nClose_2 == null)
        return;

    var nHP_1 = ref(-1);
    var nHP_2 = ref(-2);

    var nReturnValue = (1 - alpha1 / 2) * (1 - alpha1 / 2) * (nClose_0 - 2 * nClose_1 + nClose_2)
                       + 2 * (1 - alpha1) * nHP_1 - (1 - alpha1) * (1 - alpha1) * nHP_2;

    return nReturnValue;
}

var a1 = 0;
var b1 = 0;
var c1 = 0;
var c2 = 0;
var c3 = 0;

function Calc_FiltSeries(xHP)
{
    if (getBarState() == BARSTATE_ALLBARS)
    {
        a1 = Math.exp(-1.414 * 3.14159 / 10);
        b1 = 2 * a1 * Math.cos((1.414 * 180 / 10)* Math.PI / 180);
        c2 = b1;
        c3 = -a1 * a1;
        c1 = 1 - c2 - c3;
    }

    var nHP_0 = xHP.getValue(0);
    var nHP_1 = xHP.getValue(-1);

    if (nHP_0 == null || nHP_1 == null)
        return;

    var nFilt_1 = ref(-1);
    var nFilt_2 = ref(-2);

    var nReturnValue = c1 * (nHP_0 + nHP_1) / 2 + c2 * nFilt_1 + c3 * nFilt_2;

    return nReturnValue;
}

function verify()
{
    var b = false;
    if (getBuildNumber() < 779)
    {
        drawTextAbsolute(5, 35, "This study requires version 8.0 or later.",
            Color.white, Color.blue, Text.RELATIVETOBOTTOM|Text.RELATIVETOLEFT|Text.BOLD|Text.LEFT,
            null, 13, "error");
        drawTextAbsolute(5, 20, "Click HERE to upgrade.@URL=https://www.esignal.com/download/default.asp",
            Color.white, Color.blue, Text.RELATIVETOBOTTOM|Text.RELATIVETOLEFT|Text.BOLD|Text.LEFT,
            null, 13, "upgrade");
        return b;
    }
    else
    {
        b = true;
    }

    return b;
}
SuperSmoother_Filter.efs
/*********************************
Provided By:
    Interactive Data Corporation (Copyright © 2013)
    All rights reserved. This sample eSignal Formula Script (EFS)
    is for educational purposes only. Interactive Data Corporation
    reserves the right to modify and overwrite this EFS file with
    each new release.

Description:
    The Super Smoother Filter by John F. Ehlers

Version:            1.00  11/07/2013

Notes:
    The related article is copyrighted material. If you are not a subscriber
    of Stocks & Commodities, please visit www.traders.com.

**********************************/

function preMain()
{
    setStudyTitle("SuperSmoother_Filter");
}

var bInit = false;
var bVersion = null;

var xFilt = null;

function main()
{
    if (bVersion == null) bVersion = verify();
    if (bVersion == false) return;

    if (!bInit)
    {
        xFilt = efsInternal("Calc_FiltSeries");

        bInit = true;
    }

    var nFilt = xFilt.getValue(0);

    return nFilt;
}

var xClose = null;

var a1 = 0;
var b1 = 0;
var c1 = 0;
var c2 = 0;
var c3 = 0;

function Calc_FiltSeries()
{
    if (getBarState() == BARSTATE_ALLBARS)
    {
        xClose = close();

        a1 = Math.exp(-1.414 * 3.14159 / 10);
        b1 = 2 * a1 * Math.cos((1.414 * 180 / 10) * Math.PI / 180);
        c2 = b1;
        c3 = -a1 * a1;
        c1 = 1 - c2 - c3;
    }

    var nClose_0 = xClose.getValue(0);
    var nClose_1 = xClose.getValue(-1);

    if (nClose_1 == null)
        return;

    var nFilt_1 = ref(-1);
    var nFilt_2 = ref(-2);

    var nReturnValue = c1 * (nClose_0 + nClose_1) / 2 + c2 * nFilt_1 + c3 * nFilt_2;

    return nReturnValue;
}

function verify()
{
    var b = false;
    if (getBuildNumber() < 779)
    {
        drawTextAbsolute(5, 35, "This study requires version 8.0 or later.",
            Color.white, Color.blue, Text.RELATIVETOBOTTOM|Text.RELATIVETOLEFT|Text.BOLD|Text.LEFT,
            null, 13, "error");
        drawTextAbsolute(5, 20, "Click HERE to upgrade.@URL=https://www.esignal.com/download/default.asp",
            Color.white, Color.blue, Text.RELATIVETOBOTTOM|Text.RELATIVETOLEFT|Text.BOLD|Text.LEFT,
            null, 13, "upgrade");
        return b;
    }
    else
    {
        b = true;
    }

    return b;
}
—Jason Keck
eSignal, an Interactive Data company
800 779-6555, www.eSignal.com
BACK TO LIST

THINKORSWIM: JANUARY 2014 TRADERS’ TIPS
CODE
In “Predictive And Successful Indicators” in this issue, author
John Ehlers presents another innovative way to eliminate noise from classic
indicators and introduces some new smoothing indicators. For thinkorswim users,
we have created three new studies and a strategy in our proprietary scripting
language, thinkScript. You can adjust the parameters within the edit studies window
to fine-tune your variables.
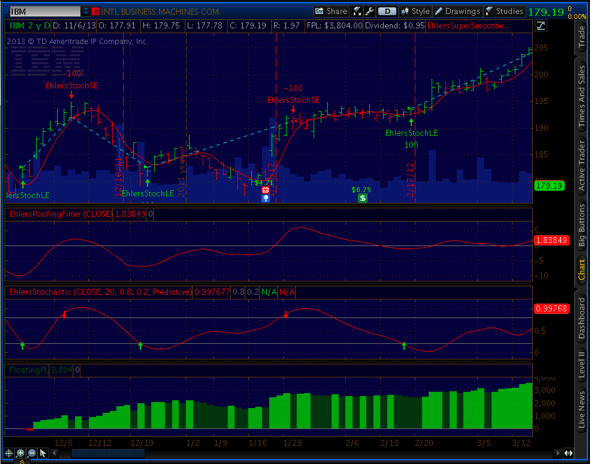
FIGURE 4: THINKORSWIM. A sample chart of IBM displays
the roofing indicator and John Ehlers’ MESA Stochastic indicator described
in his article in this issue.
Thinkorswim users can find the formulas for each indicator below:
- Strategy: https://tos.mx/Jiea7j
- From our TOS Charts, Select “Studies” → “Edit Studies”.
- Select the “Strategy” tab in the upper
left hand corner.
- Select “New” in the lower left hand corner.
- Name the strategy (i.e. EhlersStoch)
- Click in the script editor window, remove “addOrder(OrderType.BUY_AUTO,
no);” and paste the following:
script EhlersSuperSmootherFilter {
    input price = close;

    def a1 = Exp(-Double.Pi * Sqrt(2) / 10);
    def coeff2 = 2 * a1 * Cos(Sqrt(2) * Double.Pi / 10);
    def coeff3 = - Sqr(a1);
    def coeff1 = 1 - coeff2 - coeff3;
    def filt = coeff1 * (price + price[1]) / 2 + coeff2 * filt[1] + coeff3 * filt[2];

    plot SuperSmootherFilter = filt;
}

script EhlersRoofingFilter {
    input price = close;

    def alpha1 = (Cos(Sqrt(2) * Double.Pi / 48) + Sin (Sqrt(2) * Double.Pi / 48) - 1) / Cos(Sqrt(2) * Double.Pi / 48);
    def highpass = Sqr(1 - alpha1 / 2) * (price - 2 * price[1] + price[2]) + 2 * (1 - alpha1) * highpass[1] - Sqr(1 - alpha1) * highpass[2];

    plot RoofingFilter = reference EhlersSuperSmootherFilter(highpass);
}

script EhlersStochastic {
    input price = close;
    input length = 20;
    input over_bought = .8;
    input over_sold = .2;
    input mode = {default Predictive, Conventional};

    def filt = reference EhlersRoofingFilter(price);
    def highestP = Highest(filt, length);
    def lowestP = Lowest(filt, length);
    def stoch = if (highestP - lowestP) != 0 then (filt - lowestP) / (highestP - lowestP) else 0;

    plot Stochastic = reference EhlersSuperSmootherFilter(stoch);
    plot OverBought = over_bought;
    plot OverSold = over_sold;
    plot Buy;
    plot Sell;
    switch (mode) {
    case Predictive:
        Buy = if Stochastic crosses below OverSold then OverSold + .05 else Double.NaN;
        Sell = if Stochastic crosses above OverBought then OverBought - .05 else Double.NaN;
    case Conventional:
        Buy = if Stochastic crosses above OverSold then OverSold + .05 else Double.NaN;
        Sell = if Stochastic crosses below OverBought then OverBought - .05 else Double.NaN;
    }
}

input price = close;
input length = 20;
input over_bought = .8;
input over_sold = .2;
input mode = {default Predictive, Conventional};

def buy = reference EhlersStochastic(price, length, over_bought, over_sold, mode).Buy;
def sell = reference EhlersStochastic(price, length, over_bought, over_sold, mode).Sell;

AddOrder(OrderType.BUY_AUTO, !IsNaN(buy), tickColor = Color.UPTICK, arrowColor = Color.UPTICK, name = "EhlersStochLE");
AddOrder(OrderType.SELL_AUTO, !IsNaN(sell), tickColor = Color.DOWNTICK, arrowColor = Color.DOWNTICK, name = "EhlersStochSE");
- EhlersSuperSmootherFilter: https://tos.mx/uRNvch
- From our TOS Charts, Select “Studies” → “Edit
Studies”.
- Select the “Strategies” tab in the upper
left hand corner.
- Select “New” in the lower left hand corner.
- Name the study (i.e. EhlersSuperSmootherFilter)
- Click in the script editor window, remove “plot data
= close;” and paste the following:
input price = close;

def a1 = Exp(-Double.Pi * Sqrt(2) / 10);
def coeff2 = 2 * a1 * Cos(Sqrt(2) * Double.Pi / 10);
def coeff3 = - Sqr(a1);
def coeff1 = 1 - coeff2 - coeff3;
def filt = coeff1 * (price + price[1]) / 2 + coeff2 * filt[1] + coeff3 * filt[2];

plot SuperSmootherFilter = filt;
SuperSmootherFilter.SetDefaultColor(GetColor(5));
- EhlersRoofingFilter study: https://tos.mx/dcQPdE
- From our TOS Charts, Select “Studies” → “Edit
Studies”.
- Select the “Strategies” tab in the upper
left hand corner.
- Select “New” in the lower left hand corner.
- Name the study (i.e. EhlersRoofingFilter)
- Click in the script editor window, remove “plot data
= close;” and paste the following:
script EhlersSuperSmootherFilter {
    input price = close;

    def a1 = Exp(-Double.Pi * Sqrt(2) / 10);
    def coeff2 = 2 * a1 * Cos(Sqrt(2) * Double.Pi / 10);
    def coeff3 = - Sqr(a1);
    def coeff1 = 1 - coeff2 - coeff3;
    def filt = coeff1 * (price + price[1]) / 2 + coeff2 * filt[1] + coeff3 * filt[2];

    plot SuperSmootherFilter = filt;
}

declare lower;

input price = close;

def alpha1 = (Cos(Sqrt(2) * Double.Pi / 48) + Sin (Sqrt(2) * Double.Pi / 48) - 1) / Cos(Sqrt(2) * Double.Pi / 48);
def highpass = Sqr(1 - alpha1 / 2) * (price - 2 * price[1] + price[2]) + 2 * (1 - alpha1) * highpass[1] - Sqr(1 - alpha1) * highpass[2];

plot RoofingFilter = reference EhlersSuperSmootherFilter(highpass);
plot ZeroLine = 0;

RoofingFilter.SetDefaultColor(GetColor(5));
ZeroLine.SetDefaultColor(GetColor(7));
- EhlersStochastic study: https://tos.mx/yVruCn
- From our TOS Charts, Select “Studies” → “Edit
Studies”.
- Select the “Strategies” tab in the upper
left hand corner.
- Select “New” in the lower left hand corner.
- Name the study (i.e. EhlersStochastic)
- Click in the script editor window, remove “plot data
= close;” and paste the following:
script EhlersSuperSmootherFilter {
    input price = close;

    def a1 = Exp(-Double.Pi * Sqrt(2) / 10);
    def coeff2 = 2 * a1 * Cos(Sqrt(2) * Double.Pi / 10);
    def coeff3 = - Sqr(a1);
    def coeff1 = 1 - coeff2 - coeff3;
    def filt = coeff1 * (price + price[1]) / 2 + coeff2 * filt[1] + coeff3 * filt[2];

    plot SuperSmootherFilter = filt;
}

script EhlersRoofingFilter {
    input price = close;

    def alpha1 = (Cos(Sqrt(2) * Double.Pi / 48) + Sin (Sqrt(2) * Double.Pi / 48) - 1) / Cos(Sqrt(2) * Double.Pi / 48);
    def highpass = Sqr(1 - alpha1 / 2) * (price - 2 * price[1] + price[2]) + 2 * (1 - alpha1) * highpass[1] - Sqr(1 - alpha1) * highpass[2];

    plot RoofingFilter = reference EhlersSuperSmootherFilter(highpass);
}

declare lower;

input price = close;
input length = 20;
input over_bought = .8;
input over_sold = .2;
input mode = {default Predictive, Conventional};

def filt = reference EhlersRoofingFilter(price);
def highestP = Highest(filt, length);
def lowestP = Lowest(filt, length);
def stoch = if (highestP - lowestP) != 0 then (filt - lowestP) / (highestP - lowestP) else 0;

plot Stochastic = reference EhlersSuperSmootherFilter(stoch);
plot OverBought = over_bought;
plot OverSold = over_sold;
plot Buy;
plot Sell;
switch (mode) {
case Predictive:
    Buy = if Stochastic crosses below OverSold then OverSold + .05 else Double.NaN;
    Sell = if Stochastic crosses above OverBought then OverBought - .05 else Double.NaN;
case Conventional:
    Buy = if Stochastic crosses above OverSold then OverSold + .05 else Double.NaN;
    Sell = if Stochastic crosses below OverBought then OverBought - .05 else Double.NaN;
}

Stochastic.SetDefaultColor(GetColor(5));
OverBought.SetDefaultColor(GetColor(7));
OverSold.SetDefaultColor(GetColor(7));
Buy.SetDefaultColor(Color.UPTICK);
Buy.SetPaintingStrategy(PaintingStrategy.ARROW_UP);
Buy.HideBubble();
Sell.SetDefaultColor(Color.DOWNTICK);
Sell.SetPaintingStrategy(PaintingStrategy.ARROW_DOWN);
Sell.HideBubble();
—thinkorswim
A division of TD Ameritrade, Inc.
www.thinkorswim.com
BACK TO LIST

METASTOCK: JANUARY 2014 TRADERS’ TIPS
CODE
John Ehlers’ article in this issue, “Predictive And Successful
Indicators,” presents the reader with three new indicators. The MetaStock
formulas for these indicators are given here:
SuperSmoother filter:
a1:= Exp(-1.414 * 3.14159 / 10);
b1:= 2*a1 * Cos(1.414*180 /10);
c2:= b1;
c3:= -a1 * a1;
c1:= 1 - c2 - c3;
c1 * (C + Ref(C, -1))/2 + c2*PREV + c3*Ref(PREV,-1)

Roofing filter:
alpha1:= (Cos(.707*360/48) + Sin(.707*360/48) -1)/Cos(.707*360/48);
HP:= (1-alpha1/2)*(1-alpha1/2)*(C - Ref(2*C,-1) + Ref(C,-2)) +
2*(1-alpha1)*PREV - (1-alpha1)*(1-alpha1)*Ref(PREV,-1);
a1:= Exp(-1.414 * 3.14159 / 10);
b1:= 2*a1 * Cos(1.414*180 /10);
c2:= b1;
c3:= -a1 * a1;
c1:= 1 - c2 - c3;
c1 * (HP + Ref(HP, -1))/2 + c2*PREV + c3*Ref(PREV,-1)

MESA Stochastic:
alpha1:= (Cos(.707*360/48) + Sin(.707*360/48) -1)/Cos(.707*360/48);
HP:= (1-alpha1/2)*(1-alpha1/2)*(C - Ref(2*C,-1) + Ref(C,-2)) +
2*(1-alpha1)*PREV - (1-alpha1)*(1-alpha1)*Ref(PREV,-1);
a1:= Exp(-1.414 * 3.14159 / 10);
b1:= 2*a1 * Cos(1.414*180 /10);
c2:= b1;
c3:= -a1 * a1;
c1:= 1 - c2 - c3;
filt:= c1 * (HP + Ref(HP, -1))/2 + c2*PREV + c3*Ref(PREV,-1);
stoc:= (filt-LLV(filt,20))/(HHV(filt,20)-LLV(filt,20));
c1 * (stoc + Ref(stoc, -1))/2 + c2*PREV + c3*Ref(PREV,-1);
—William Golson
MetaStock Technical Support
www.metastock.com
BACK TO LIST

WEALTH-LAB: JANUARY 2014 TRADERS’ TIPS
CODE
In his article in this issue, “Predictive And Successful Indicators,” author
John Ehlers presents two new indicators: the SuperSmoother filter,
which is superior to moving averages for removing aliasing noise, and the MESA
Stochastic oscillator, a stochastic successor that removes the effect
of spectral dilation through the use of a roofing filter.
To demonstrate the effects of using the new indicators, Ehlers introduces
a simple countertrend system that goes long when MESA Stochastic crosses below
the oversold value and reverses the trade by taking a short position when the
oscillator exceeds the overbought threshold.
To execute the trading system that Ehlers includes in his article, Wealth-Lab
users need to install (or update) the latest version of our TASCIndicators
library from the Extensions section of our website if they haven’t already
done so, and restart Wealth-Lab.
A sample chart is shown in Figure 5.
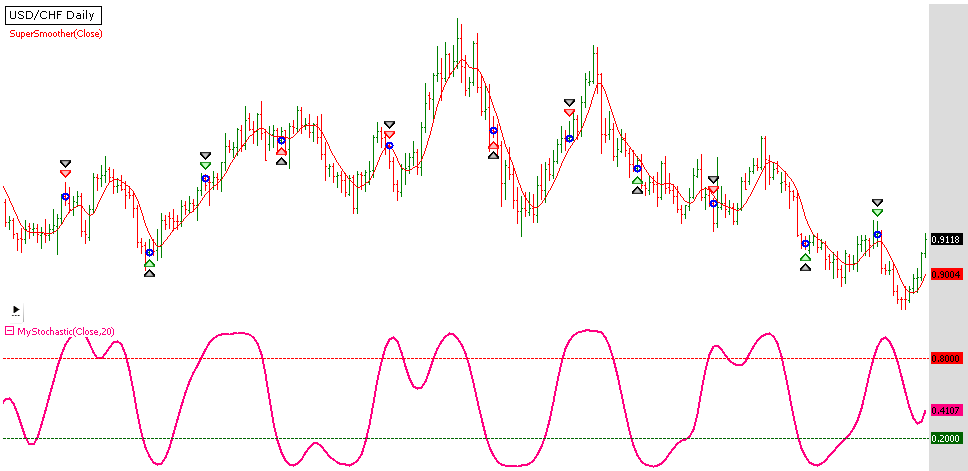
FIGURE 5: WEALTH-LAB. Here is a sample Wealth-Lab 6 chart
illustrating application of the system’s rules on a daily chart of
USD/CHF (US dollar to Swiss franc exchange rate).
Wealth-Lab 6 strategy code (C#):


using System;
using System.Collections.Generic;
using System.Text;
using System.Drawing;
using WealthLab;
using WealthLab.Indicators;
using TASCIndicators;

namespace WealthLab.Strategies
{
	public class Ehlers201401 : WealthScript
	{
		private StrategyParameter paramPeriod;

		public Ehlers201401()
		{
			paramPeriod = CreateParameter("MESAStoch.Period",20,5,100,5);
		}

		protected override void Execute()
		{
			int period = paramPeriod.ValueInt;
			RoofingFilter rf = RoofingFilter.Series(Close);
			MESAStochastic ms = MESAStochastic.Series(Close,period);

			for(int bar = period; bar < Bars.Count; bar++)
			{
				// Detect crossover/crossunder and store state in a variable
				bool maXo = CrossOver(bar, ms, 0.8);
				bool maXu = CrossUnder(bar, ms, 0.2);

				// The first trade
				if (Positions.Count == 0){
					if ( maXu )
						BuyAtMarket( bar + 1 );
					else if( maXo )
						ShortAtMarket( bar + 1 );
				}
					// Subsequent trades
				else
				{
					Position p = LastPosition;
					if ( p.PositionType == PositionType.Long )
					{
						if ( maXo )
						{
							SellAtMarket( bar + 1, p );
							ShortAtMarket( bar + 1 );
						}
					}
					else if ( maXu )
					{
						CoverAtMarket( bar + 1, p );
						BuyAtMarket( bar + 1 );
					}
				}
			}

			HideVolume();
			ChartPane pMS = CreatePane(40,false,true);
			ChartPane pRF = CreatePane(20,true,true);
			PlotSeries(PricePane,SuperSmoother.Series(Close),Color.Red,LineStyle.Solid,1);
			PlotSeries(pRF,rf,Color.FromArgb(255,0,0,139),LineStyle.Solid,1);
			PlotSeries(pMS,ms,Color.FromArgb(255,255,0,128),LineStyle.Solid,2);
			DrawHorzLine(pMS,0.8,Color.Red,LineStyle.Dashed,1);
			DrawHorzLine(pMS,0.2,Color.DarkGreen,LineStyle.Dashed,1);
		}
	}
}
—Wealth-Lab team
MS123, LLC
www.wealth-lab.com
BACK TO LIST

AMIBROKER: JANUARY 2014 TRADERS’ TIPS
CODE
In “Predictive And Successful Indicators” in this issue, author
John Ehlers presents his SuperSmooth filter and uses it to create a better
stochastic indicator.
Ready-to-use AmiBroker code for the indicator is shown below. Note that SuperSmooth
filter and high-pass filter have been written as reusable, general-purpose
functions so users can easily include them in their own systems and/or indicators.
To display the indicators on a chart, simply input or paste the code into the
formula editor and press apply indicator. To backtest a trading system,
choose backtest from Tools menu in the formula editor.
A sample chart is shown in Figure 6.
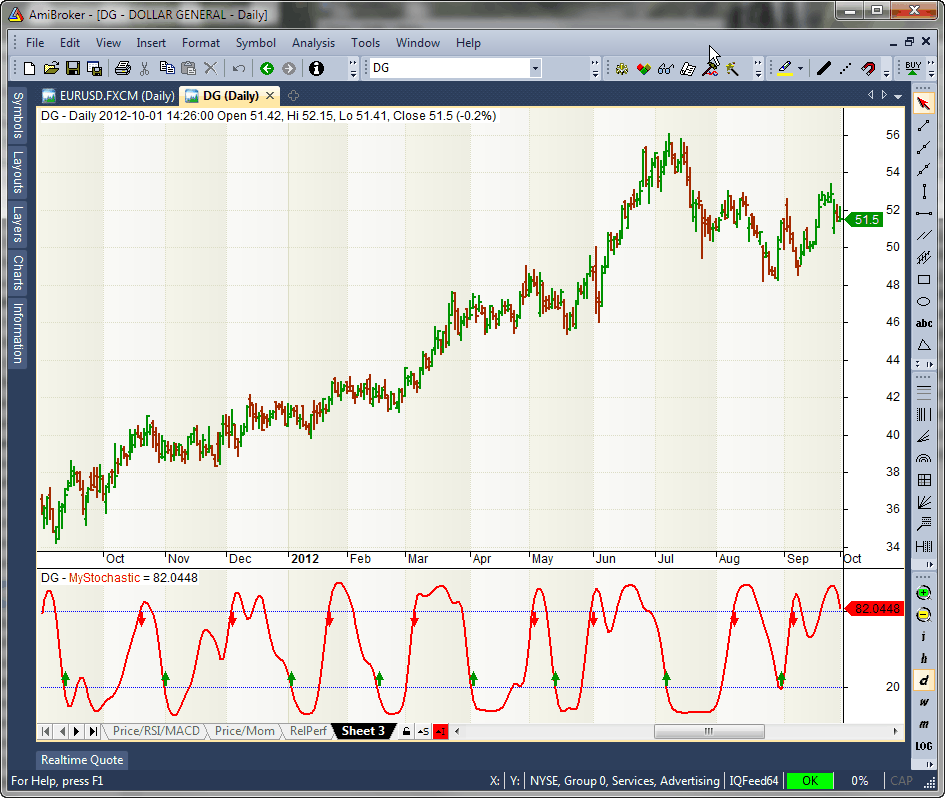
FIGURE 6: AMIBROKER. Here is a sample price chart of
DG with a SuperSmoothed stochastic indicator.
PI = 3.1415926;
SQ2 = sqrt( 2 );

function SuperSmoother( array, periods )
{
    a1 = exp( -SQ2 * PI / periods );
    b1 = 2 * a1 * cos( SQ2 * PI / periods );
    c2 = b1;
    c3 = -a1 * a1;
    c1 = 1 - c2 - c3;

    Filt = Nz( array );

    for ( i = 2; i < BarCount; i++ )
    {
         Filt[ i ] = c1 * ( array[ i ] + array[ i - 1 ] ) / 2 +
                     c2 * Filt[ i - 1 ] +
                     c3 * Filt[ i - 2];
    }

    return Filt;
}

function HighpassFilter( array, periods )
{
    alpha1 = ( cos( SQ2 * PI / periods ) + sin ( SQ2 * PI / periods ) - 1 ) /  cos( SQ2 * PI / periods );

    HP = Nz( array );

    C1 = ( 1 - alpha1 / 2 ) ^ 2;
    C2 = 2 * ( 1 - alpha1 );
    C3 = - ( ( 1 - alpha1 ) ^ 2 );

    for ( i = 2; i < BarCount; i++ )
    {
        HP[ i ] =  C1 * ( array[ i ] - 2 * array[i-1] + array[i-2] ) +
                   C2 * HP[ i - 1] +
                   C3 * HP[ i - 2];
    }

    return HP;
}

ss = SuperSmoother( HighpassFilter( Close, 48 ), 10 );

Length = 20;


HighestC = HHV( ss, Length );
LowestC = LLV( ss, Length );

Stoc = ( ss - LowestC ) / ( HighestC - LowestC );

MyStochastic = 100 * SuperSmoother( Stoc, 10 );

Plot( MyStochastic, "MyStochastic", colorRed, styleThick );
PlotGrid( 20, colorBlue );
PlotGrid( 80, colorBlue );

Buy = Cross( 20, MyStochastic );
Sell = Cross( MyStochastic, 80 );

Buy = ExRem( Buy, Sell );
Sell = ExRem( Sell, Buy );
PlotShapes( Buy * shapeUpArrow, colorGreen, 0, 20, 8 );
PlotShapes( Sell * shapeDownArrow, colorRed, 0, 80, 8 );
—Tomasz Janeczko, AmiBroker.com
www.amibroker.com
BACK TO LIST

NEUROSHELL TRADER: JANUARY 2014 TRADERS’ TIPS
CODE
John Ehlers’ SuperSmoother filter, roofing filter, and MESA Stochastic
indicator presented in his article in this issue, “Predictive And Successful
Indicators,” can be easily implemented in NeuroShell Trader using NeuroShell
Trader’s ability to call external dynamic linked libraries. Dynamic linked
libraries can be written in C, C++, Power Basic, or Delphi.
After moving the EasyLanguage code provided in Ehlers’ article to your
preferred compiler and creating a DLL, you can insert the resulting indicators
as follows:
- Select “New Indicator...” from the Insert menu.
- Choose the External Program & Library Calls category.
- Select the appropriate External DLL Call indicator.
- Setup the parameters to match your DLL.
- Select the Finished button.
Dynamic trading systems can be easily created in NeuroShell Trader by combining
the MESA Stochastic indicator with NeuroShell Trader’s genetic optimizer
to find optimal lengths. Similar filter and cycle-based strategies can also
be created using indicators found in John Ehlers’ Cybernetic and MESA91
NeuroShell Trader add-ons. Users of NeuroShell Trader can go to the STOCKS & COMMODITIES
section of the NeuroShell Trader free technical support website to download
a copy of this or any previous Traders’ Tips.
A sample chart is shown in Figure 7.
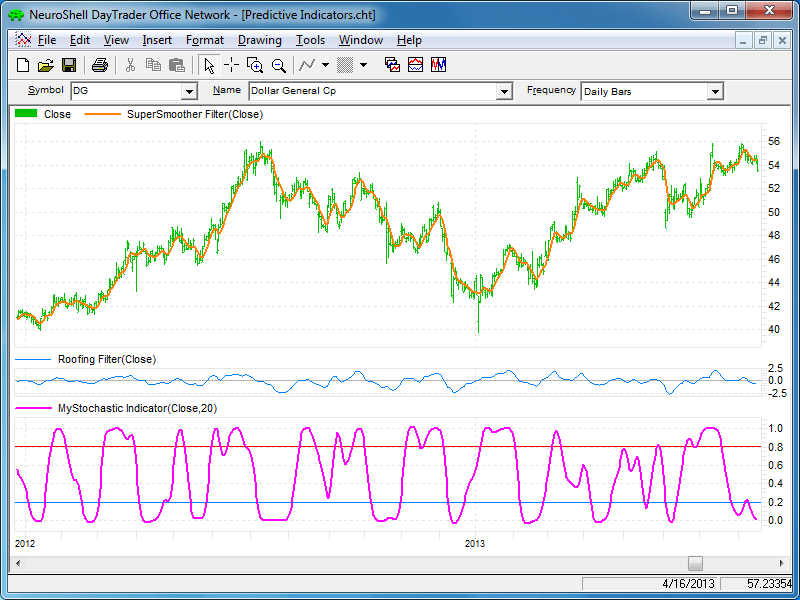
FIGURE 7: NEUROSHELL TRADER. This NeuroShell Trader chart
displays John Ehlers’ SuperSmoother filter, roofing filter, and MESA
Stochastic indicator.
—Marge Sherald, Ward Systems Group, Inc.
301 662-7950, sales@wardsystems.com
www.neuroshell.com
BACK TO LIST

AIQ: JANUARY 2014 TRADERS’ TIPS CODE
This Traders’ Tip is based on Ajay Pankhania’s September 2013
article in STOCKS & COMMODITIES, “Muscle
Up Those Averages.”
The AIQ code for the moving averages and the MACD indicator discussed in the
article is provided at www.TradersEdgeSystems.com/traderstips.htm.
This code may be useful to beginning AIQ Expert Design Studio users since
it illustrates how to code multiple versions of the simple and the exponential
moving averages as well as the MACD indicator. In addition, I have coded the
simple moving average crossover system and the MACD crossover system.
The code and EDS file can be downloaded from www.TradersEdgeSystems.com/traderstips.htm.
—Richard Denning
info@TradersEdgeSystems.com
for AIQ Systems
BACK TO LIST

TRADERSSTUDIO: JANUARY 2014 TRADERS’ TIPS
CODE
The TradersStudio code based on John Ehlers’ article in this issue, “Predictive
And Successful Indicators,” is provided at the following websites:
The following code files are provided in the download:
- Function: SUPSMO—The SuperSmoother filter returns a smoothed value
for the input price
- Function: ROOF—The roofing filter returns a two-pole high-pass filtered
value, which is then smoothed by the first function, the “SUPSMO” for
the input price
- Function: MESASTOC—Calculates a stochastic of the price input
that uses both the roofing filter and the SuperSmoother filters and returns
a super-smoothed value for the stochastic
- Indicator: EHLERS_SUPSMO_IND is used to plot the SuperSmoother on a chart
- Indicator: EHLERS_ROOF_IND is used to plot the roofing filter on a chart
- Indicator: EHLERS_MESASTOC_IND is used to plot the MESA Stochastic on a
chart
- System: EHLERS_MESASTOC_SYS is a system that I created (not found in Ehlers’ article)
to show an example of how to use the MESA Stochastic indicator in a system.
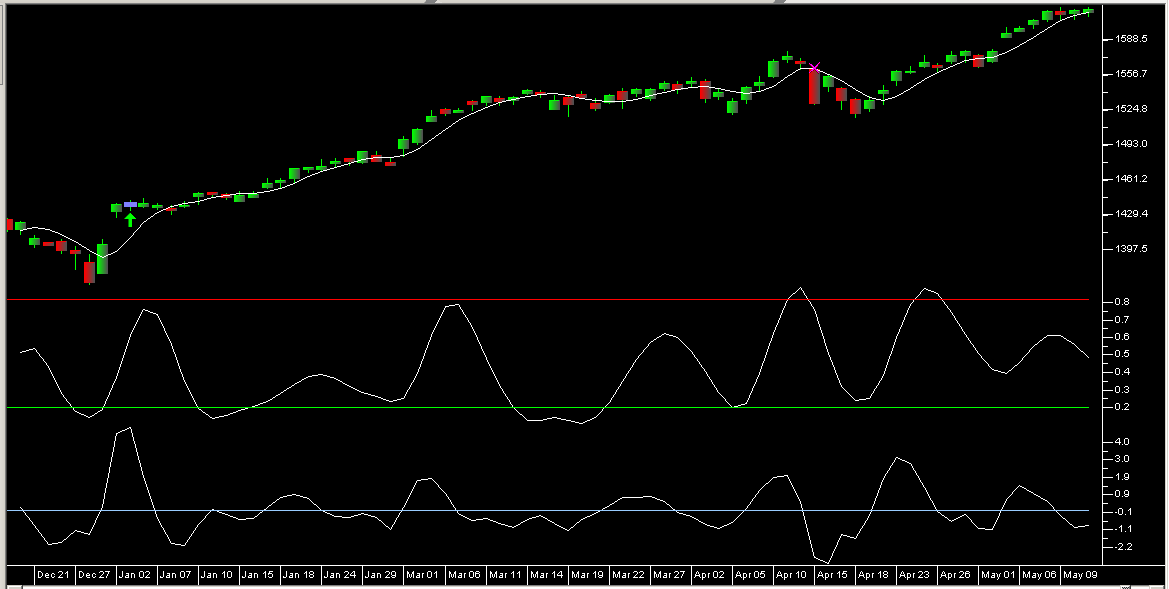
FIGURE 8: TRADERSSTUDIO, FUTURES CONTRACT. Here is a
sample chart of the S&P 500 futures contract with the three indicators
described by John Ehlers in his article in this issue, SuperSmoothing, roofing,
and MESA Stochastic.
In Figure 8, I show a chart of the S&P 500 futures contract using Pinnacle
Data, symbol “SP,” with the three indicators discussed by Ehlers
in his article. In the main panel, we see the SuperSmoother filter using the
close as the price input. In the second panel, we see the MESA Stochastic indicator,
and in the bottom panel, we see the roofing filter. In Figure 9, I show the
equity curve and underwater equity curve for the example system I wrote trading
one contract, long only.
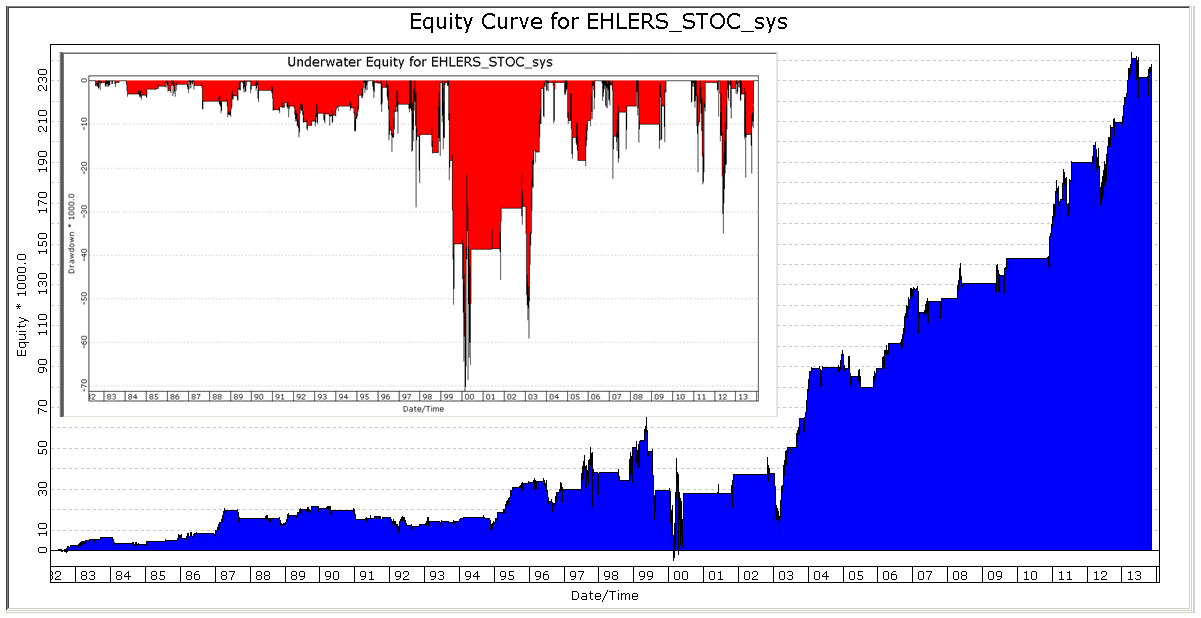
FIGURE 9: TRADERSSTUDIO, EQUITY CURVE. Here are equity
and underwater curves for the example system I wrote trading one contract
of the SP long-only.
'PREDICTIVE INDICATORS FOR EFFECTIVE TRADING STRATEGIES
'Author: John Ehlers, TASC January 2014
'Coded by: Richard Denning 11/02/2013
'www.TradersEdgeSystems.com

'SuperSmoother filter
' 2013 John F. Ehlers
Function SUPSMO(Price As BarArray)
Dim a1, b1, c1, c2, c3, Filt As BarArray
a1 = Exp(-1.414*3.14159 / 10)
b1 = 2*a1*Cos(DegToRad(1.414*180 / 10))
c2 = b1
c3 = -a1*a1
c1 = 1 - c2 - c3
Filt = c1*(Price + Price[1]) / 2 + c2*Filt[1] + c3*Filt[2]
SUPSMO = Filt
End Function
'----------------------------------------------------------
'Roofing filter
' 2013 John F. Ehlers
Function ROOF(Price As BarArray)
Dim alpha1
Dim HP As BarArray
'Highpass filter cyclic components whose periods are shorter than 48 bars
  alpha1 = (Cos(DegToRad(.707*360 / 48) + Sin(DegToRad(.707*360 / 48) - 1))) /Cos(DegToRad(.707*360 / 48))
  HP = (1 - alpha1 / 2)*(1 - alpha1 /2)*(Price - 2*Price[1] + Price[2]) + 2*(1 - alpha1)*HP[1] - (1 - alpha1)*(1 - alpha1)*HP[2]
'Smooth with a Super Smoother Filter
  'assert(false)
  ROOF = SUPSMO(HP)
  End Function
'----------------------------------------------------------
'MesaStochastic Indicator
' 2013 John F. Ehlers
Function MESASTOC(Price as bararray,stoLen)
  Dim count
  Dim HighestC As BarArray
  Dim LowestC As BarArray
  Dim stoc As BarArray
  Dim filtSmoPrice As BarArray
  Dim myStochastic As BarArray

'Highpass filter cyclic components whose periods are shorter than 48 bars
' then smooted with a super smother filter
  filtSmoPrice = ROOF(Price)
  HighestC = filtSmoPrice
  LowestC = filtSmoPrice
  For count = 0 To stoLen - 1
    If filtSmoPrice[count] > HighestC Then HighestC = filtSmoPrice[count]
    If filtSmoPrice[count] < LowestC Then LowestC = filtSmoPrice[count]
  Next
  stoc = (filtSmoPrice - LowestC) / (HighestC - LowestC)
'Smooth with a Super Smoother Filter
  myStochastic = SUPSMO(stoc)
MESASTOC = myStochastic
End Function
'----------------------------------------------------------
'Indicator plot for SuperSmoother Filter
Sub EHLERS_SUPSMO_IND()
Plot1(SUPSMO(Close))
End Sub
'-----------------------------------------------------------
'Indicator plot for Roofing Filter
Sub EHLERS_ROOF_IND()
plot1(ROOF(Close))
plot2(0)
End Sub
'------------------------------------------------------------
'MesaStochastic Indicator Plot
' 2013 John F. Ehlers
Sub EHLERS_MESASTOC_IND(stoLen)
  Plot1(MesaStoc(Close,stoLen))
  Plot2(.8)
  Plot3(.2)
End Sub
'-----------------------------------------------------------
'Example of how one micht use Ehler's MesaStochastic Indicator in a system (long only)
Sub EHLERS_MESASTOC_SYS(stoLen,upperVal,lowerVal,trndLen)
  'default parameter values: stoLen=20,upperVal=0.8,lowerVal=0.2,trndLen=25
  Dim smoFiltSto
  Dim smoFiltClose As BarArray
  smoFiltSto = MESASTOC(Close,stoLen)
  smoFiltClose = SUPSMO(Close)
  'buy and exit rules (long only system)
    If CrossesOver(smoFiltSto , lowerVal) And smoFiltClose > smoFiltClose[trndLen] Then Buy("LE",1,0,Market,Day)
    If CrossesOver(smoFiltSto, upperVal) Then ExitLong("LXob","",1,0,Market,Day)
End Sub

'------------------------------------------------------------
—Richard Denning
info@TradersEdgeSystems.com
for TradersStudio
BACK TO LIST

NINJATRADER: JANUARY 2014 TRADERS’ TIPS
CODE
The MESA Stochastic, as discussed in “Predictive And Successful Indicators” in
this issue by John Ehlers, has been implemented as an indicator available for
download at www.ninjatrader.com/SC/January2014SC.zip.
Once it has been downloaded, from within the NinjaTrader Control Center window,
select the menu File → Utilities → Import NinjaScript and select
the downloaded file. This file is for NinjaTrader version 7 or greater.
You can review the strategy source code by selecting the menu Tools → Edit
NinjaScript → Indicator from within the NinjaTrader Control Center window
and selecting the “MESA Stochastic” file.
NinjaScript uses compiled DLLs that run native, not interpreted, which provides
you with the highest performance possible.
A sample chart implementing the strategy is shown in Figure 10.
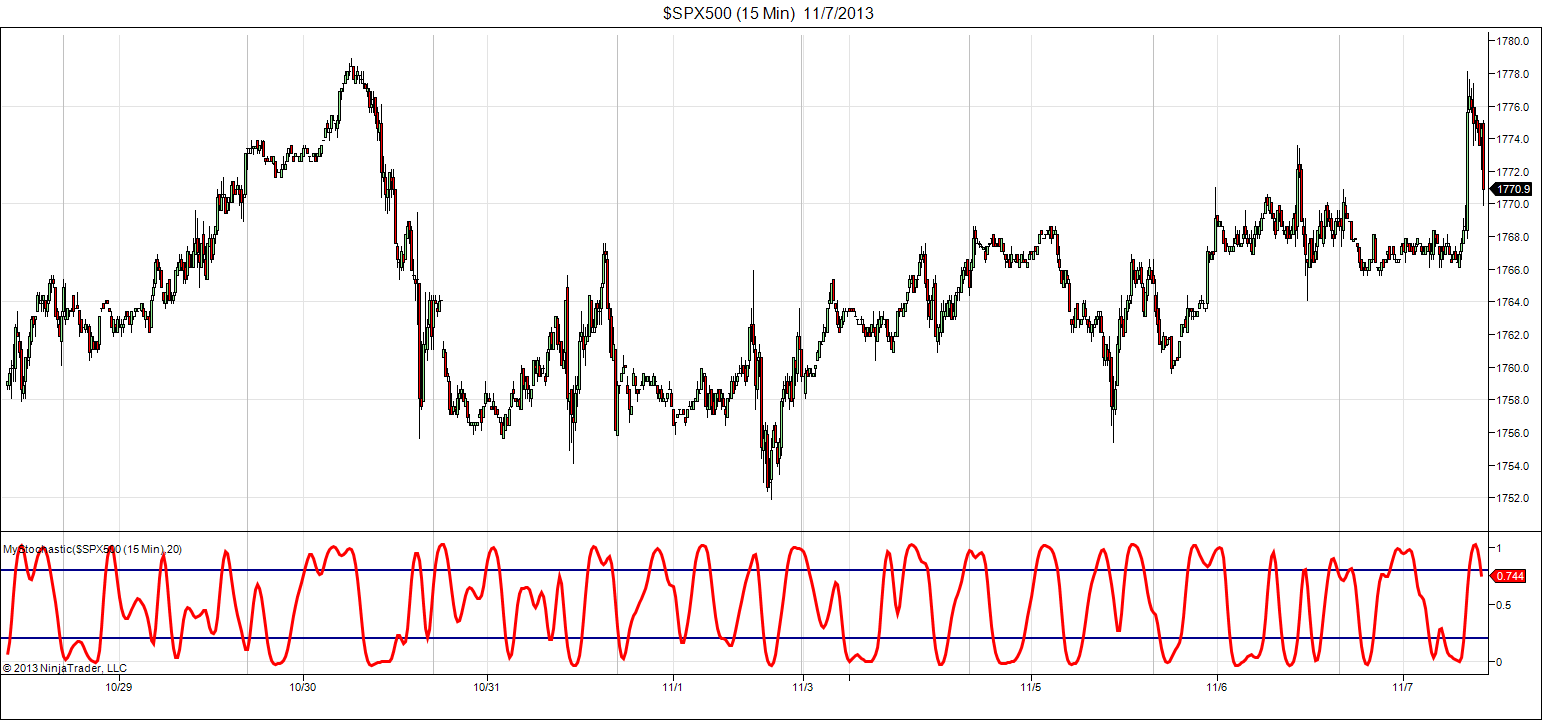
FIGURE 10: NINJATRADER. This screenshot shows the MESA
Stochastic applied to a 15-minute chart of the S&P 500 index CFD.
—Raymond Deux & Cal Hueber
NinjaTrader, LLC
www.ninjatrader.com
BACK TO LIST

UPDATA: JANUARY 2014 TRADERS’ TIPS CODE
This tip is based on “Predictive And Successful Indicators” by
John Ehlers in this issue. In the article, Ehlers seeks to develop a filter
with the optimum smoothing and minimal lag effect, and which mitigates the
fractal distortion of the underlying data. A stochastic measure is applied
to the resultant series to create an oscillator such that values 0.2 and 0.8
become extremes from which entry signals may be generated. (See Figure 11.)
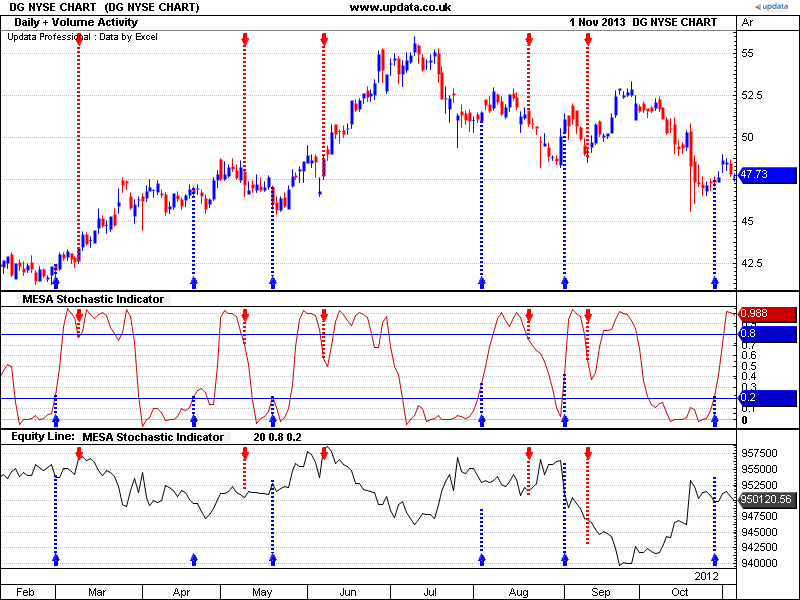
FIGURE 11: UPDATA. This chart shows the stochastic indicator-based
system with 0.8/0.2 crossing entries, as applied to Dollar General, in daily
resolution data.
The Updata code based on this article is in the Updata Library and may be
downloaded by clicking the custom menu and system library.
The code is also shown below and can be pasted into the Updata custom editor
and saved.
'John F. Ehlers,PhD
'Stocks & Commodities Magazine,January 2014

DISPLAYSTYLE 3LINES
INDICATORTYPE CHART
COLOUR RGB(200,0,0)
COLOUR2 RGB(0,0,200)
COLOUR3 RGB(0,0,200)
PARAMETER "Length" #LENGTH=20
PARAMETER "Upper" @UPPER=0.8
PARAMETER "Lower" @LOWER=0.2
NAME "MESA Stochastic Indicator" ""
@ALPHA1=0
@HP=0
@A1=0
@B1=0
@C1=0
@C2=0
@C3=0
@FILTER=0
@STOCHASTIC=0
@MESASTOCH=0
FOR #CURDATE=0 TO #LASTDATE
    @ALPHA1=1+(SIN(0.707*2*CONST_PI/48)-1)/COS(0.707*2*CONST_PI/48)
    @HP=(1-@ALPHA1/2)*(1-@ALPHA1/2)*(CLOSE-2*CLOSE(1)+CLOSE(2))+2*(1-@ALPHA1)*HIST(@HP,1)-(1-@ALPHA1)*(1-@ALPHA1)*HIST(@HP,2)
    @A1=EXP(-1.414*CONST_PI/10)
    @B1=2*@A1*COS(1.414*CONST_PI/10)
    @C2=@B1
    @C3=-@A1*@A1
    @C1=1-@C2-@C3
    @FILTER=@C1*0.5*(@HP+HIST(@HP,1))+@C2*HIST(@FILTER,1)+@C3*HIST(@FILTER,2)
    @STOCHASTIC=(@FILTER-PLOW(@FILTER,#LENGTH))/(PHIGH(@FILTER,#LENGTH)-PLOW(@FILTER,#LENGTH))
    @MESASTOCH=@C1*0.5*(@STOCHASTIC+HIST(@STOCHASTIC,1))+@C2*HIST(@STOCHASTIC,1)+@C3*HIST(@STOCHASTIC,2)
    'OPTIONAL ENTRY RULES
    IF HASX(@MESASTOCH,@UPPER,DOWN)
       SELL CLOSE
       SHORT CLOSE
    ELSEIF HASX(@MESASTOCH,@LOWER,UP)
       COVER CLOSE
       BUY CLOSE
    ENDIF
    @PLOT=@MESASTOCH
    @PLOT2=@UPPER
    @PLOT3=@LOWER
NEXT
—Updata support team
support@updata.co.uk
www.updata.co.uk
BACK TO LIST

TRADECISION: JANUARY 2014 TRADERS’ TIPS
CODE
In “Predictive And Successful Indicators” in this issue, author
John Ehlers investigates predictive indicators for more effective trading strategies.
We are providing code for the three indicators discussed in the article: the
SuperSmoother filter, the roofing filter, and the MESA Stochastic indicator.
SuperSmoother filter code:
var
a1:=0;
b1:=0;
c1:=0;
c2:=0;
c3:=0;
Filt:=0;
end_var
if HISTORYSIZE < 2 then return 0;

a1:=Exp(-1.414 * 3.14159 / 10);
b1:=2 * a1 * Cos(1.414 * 180 / 10);
c2:=b1;
c3:=-a1 * a1;
c1:=1 - c2 - c3;
Filt:=c1 * (Close + Close\1\) / 2 + c2 * Filt\1\ + c3 * Filt\2\;

return Filt;

Roofing filter code:
var
a1:=0;
b1:=0;
c1:=0;
c2:=0;
c3:=0;
alpha1:=0;
HP:=0;
Filt:=0;
end_var

if HISTORYSIZE < 2 then return 0;

alpha1:=(Cos(0.707 * 360 / 48) + Sin(0.707 * 360 / 48) - 1) / Cos(0.707 * 360 / 48);
HP:=(1 - alpha1 / 2) * (1 - alpha1 / 2) * (Close - 2 * Close\1\ + Close\2\) + 2 * (1 - alpha1) * HP\1\ - (1 - alpha1) * (1 - alpha1) * HP\2\;

a1:=Exp(-1.414 * 3.14159 / 10);
b1:=2 * a1 * Cos(1.414 * 180 / 10);
c2:=b1;
c3:=-a1 * a1;
c1:=1 - c2 - c3;
Filt:=c1 * (HP + HP\1\) / 2 + c2 * Filt\1\ + c3 * Filt\2\;

return Filt;


MESA Stochastic indicator code:
input
Length:"Enter the length:", 20;
end_in
var
a1:=0;
b1:=0;
c1:=0;
c2:=0;
c3:=0;
alpha1:=0;
HP:=0;
Filt:=0;
HighestC:=0;
LowestC:=0;
count:=0;
Stoc:=0;
MESAStochastic:=0;
end_var

if HISTORYSIZE < 2 then return 0;

alpha1:=(Cos(0.707 * 360 / 48) + Sin(0.707 * 360 / 48) - 1) / Cos(0.707 * 360 / 48);
HP:=(1 - alpha1 / 2) * (1 - alpha1 / 2) * (Close - 2 * Close\1\ + Close\2\) + 2 * (1 - alpha1) * HP\1\ - (1 - alpha1) * (1 - alpha1) * HP\2\;

a1:=Exp(-1.414 * 3.14159 / 10);
b1:=2 * a1 * Cos(1.414 * 180 / 10);
c2:=b1;
c3:=-a1 * a1;
c1:=1 - c2 - c3;
Filt:=c1 * (HP + HP\1\) / 2 + c2 * Filt\1\ + c3 * Filt\2\;

HighestC:=Filt;
LowestC:=Filt;
for count:=0 to Length - 1 do begin
	if Filt\count\ >HighestC then
		HighestC:=Filt\count\;
	if Filt\count\ < LowestC then
		LowestC:=Filt\count\;
end;

Stoc:=(Filt - LowestC) / (HighestC - LowestC);
MESAStochastic:=c1 * (Stoc + Stoc\1\) / 2 + c2 * MESAStochastic\1\ + c3 * MESAStochastic\2\;
return MESAStochastic;
A sample chart plotting the indicators is shown in Figure 12.
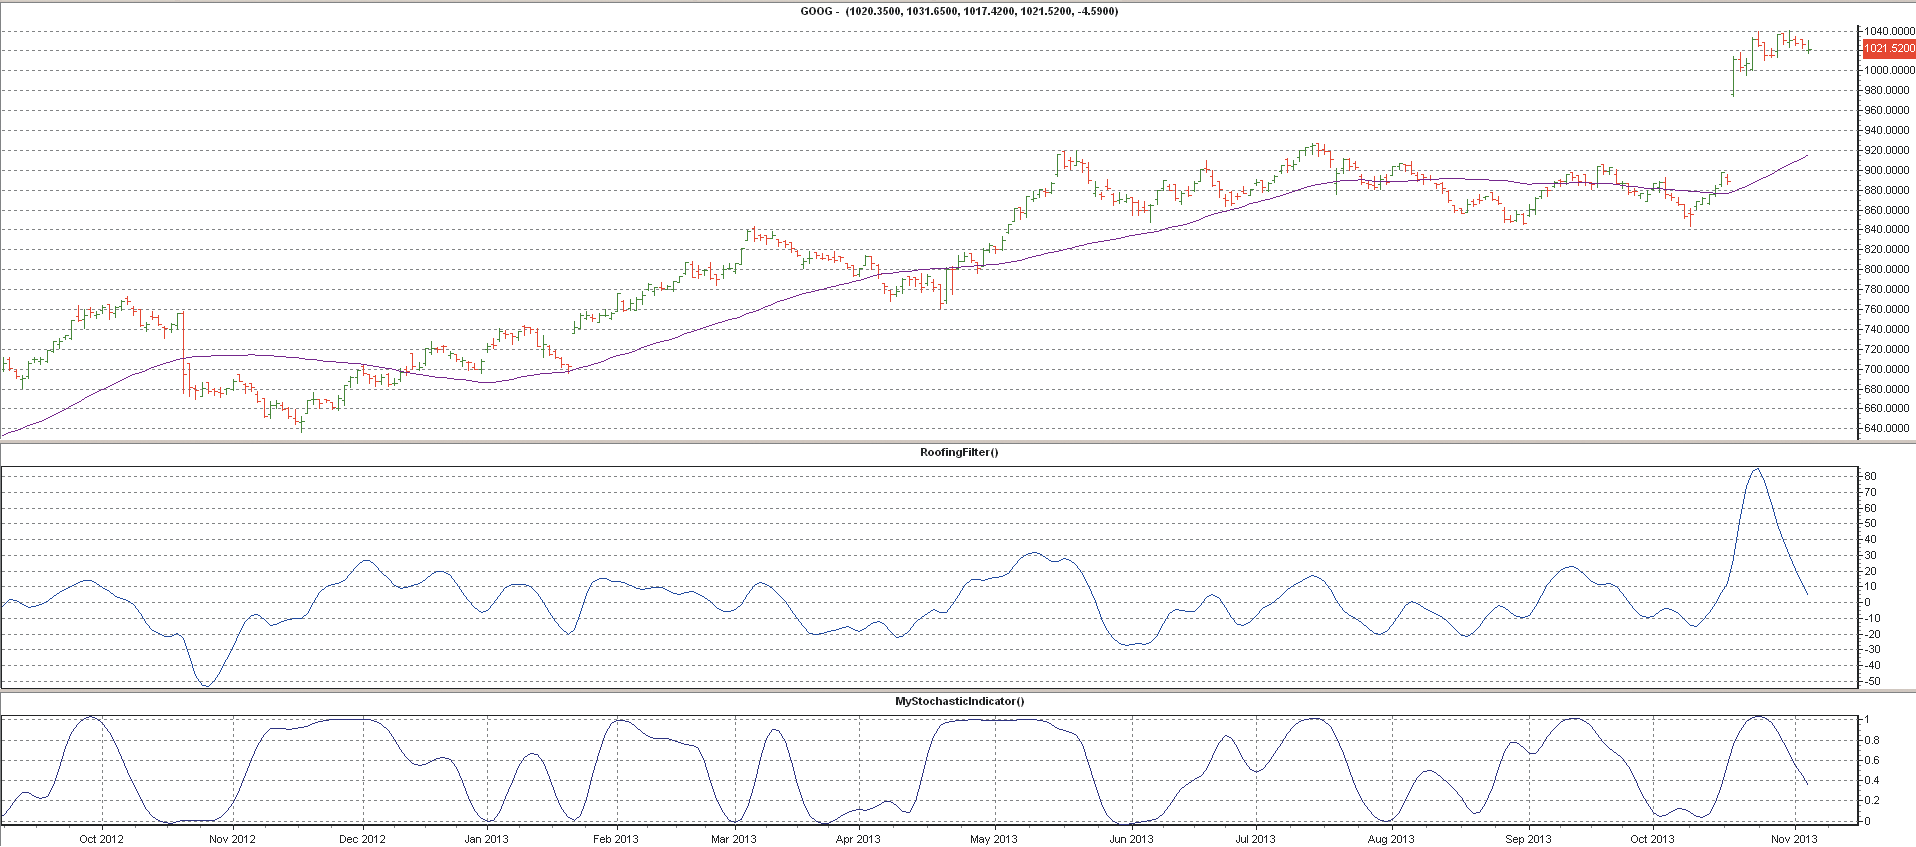
FIGURE 12: TRADECISION. Here is a sample chart of Google
with the roofing filter and John Ehlers’ MESA Stochastic indicator
plotted.
—Tradecision support
Tradecision.com
BACK TO LIST
MICROSOFT EXCEL: JANUARY 2014 TRADERS’ TIPS
CODE
John Ehlers’ formulations given in his article in this issue, “Predictive
And Successful Indicators,” are straightforward to set up in Excel. The
chart shown in Figure 13 approximates Ehlers’ Figure 8 in his article.
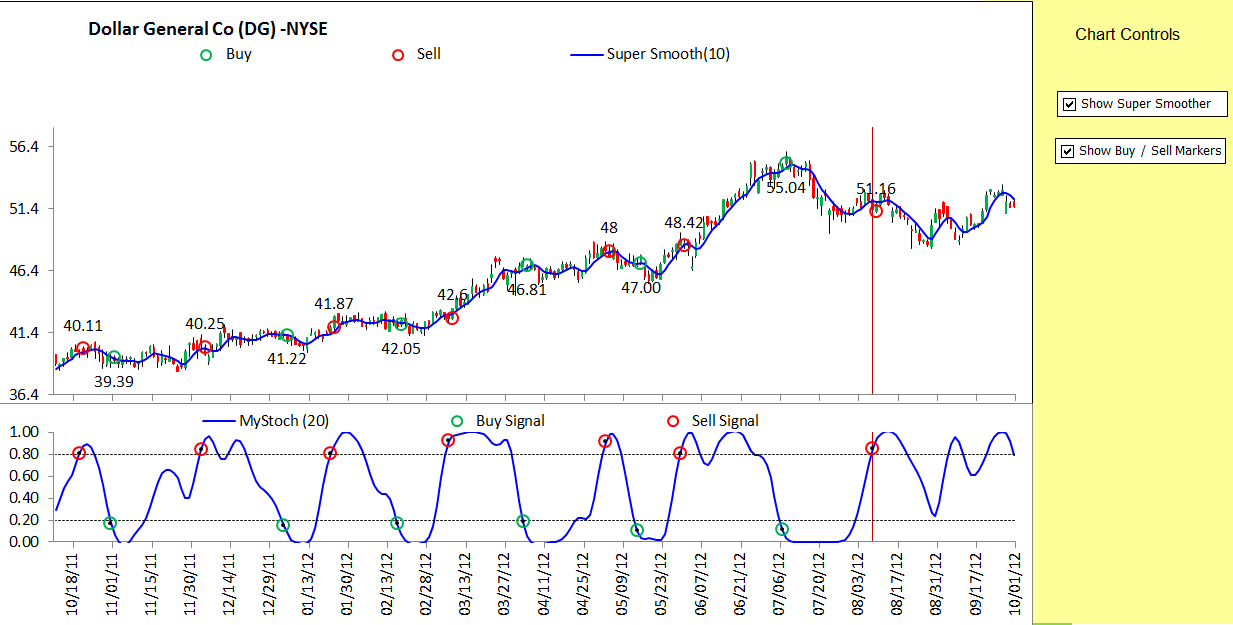
FIGURE 13: EXCEL, SAMPLE SIGNALS. Here is a sample chart
of Dollar General with predictive trade signals and one-bar delayed trades.
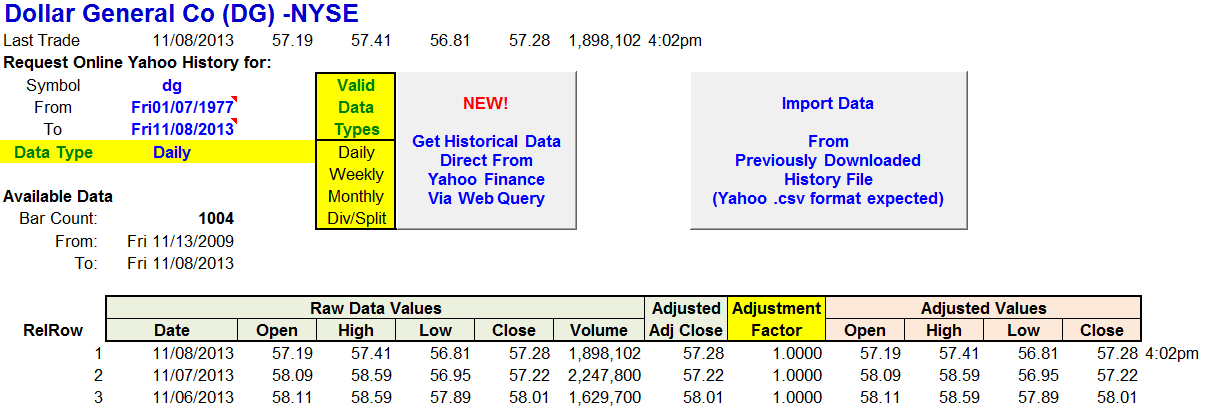
FIGURE 14: EXCEL, InputPriceData tab. The InputPriceData
tab shows details of the last trade price bar in the second row. This data
is inserted into the price history.
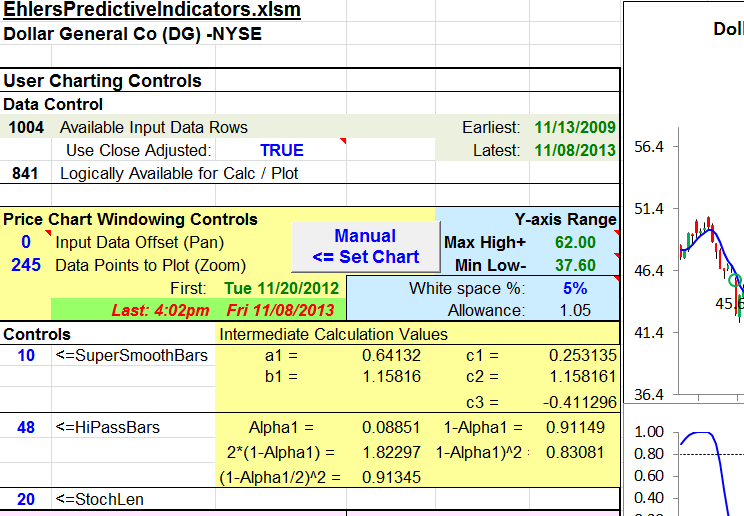
FIGURE 15: EXCEL, INTRADAY PRICE BAR TIME STAMP. When
the last intraday bar (input data offset = zero) is on the chart, it will
be displayed as “Last:” with a time stamp.
Since this indicator is built on bar closes, transactions cannot logically
take place any sooner than the next bar. For trade simulation in this spreadsheet,
I enter or exit trades using the open of the next bar after a signal.
This Traders’ Tip also introduces a new feature of my Excel templates:
an intraday price bar for use with daily price history downloads from Yahoo!
Finance.
If bar 1 is an intraday bar, it will have a time stamp to the right.
The intraday bar warning only appears when the bar is on the chart (data window
offset = zero).
The spreadsheet file for this Traders’ Tip can be downloaded here.
To successfully download it, follow these steps:
- Right-click on the Excel
file link, then
- Select “save as” to place a copy of the spreadsheet file on
your hard drive.
—Ron McAllister
Excel and VBA programmer
rpmac_xltt@sprynet.com
BACK TO LIST
Originally published in the January 2014 issue of
Technical Analysis of Stocks & Commodities magazine.
All rights reserved. © Copyright 2013, Technical Analysis, Inc.


