TRADERS’ TIPS
March 2014

For this month’s Traders’ Tips, the focus is Perry Kaufman’s article in this issue, “Timing The Market With Pairs Logic.” Here we present the March 2014 Traders’ Tips code with possible implementations in various software.
Code for TradeStation is already provided in Kaufman’s article. Subscribers will find that code at the Subscriber Area of our website. Presented here is an overview of possible implementations for other software.
Traders’ Tips code is provided to help the reader implement a selected technique from an article in this issue. The entries are contributed by various software developers or programmers for software that is capable of customization.

TRADESTATION: MARCH 2014
In “Timing The Market With Pairs Logic” in this issue, author Perry Kaufman discusses a trading system that buys and sells stocks when they are oversold and overbought relative to an index. The author has supplied the TradeStation EasyLanguage strategy code as well as the required custom function mentioned in the article. We have additionally created an indicator named PJK_TSMStress based on the author’s function, to display the stress level as shown in Figure 1 of Kaufman’s article. In addition to backtesting the strategy in a TradeStation chart, remember that you can use TradeStation’s Portfolio Maestro product to quickly backtest on a portfolio of symbols of your choice.
Following is the EasyLanguage code for the PJK_TSMStress indicator:
{ Based on PJK_Stress function
Copyright 2013, P.J.Kaufman. All rights reserved. }
inputs:
	Period( 60 ),
	OBLevel( 90 ),
	OSLevel( 10 ),
	NormalLevel( 50 ) ;
variables:
	Stoch1( 0 ),
	Stoch2( 0 ),
	Diff( 0 ),
	Range1( 0 ),
	Range2( 0 ),
	StressValue( 0 ) ;

StressValue = 50 ;
Stoch1 = 50 ;
Stoch2 = 50 ;

{ raw stochastics for price1 and price2 }
Range1 = Highest( High, Period )
	- Lowest( Low, Period ) ;
Range2 = Highest( High of Data2, Period)
	- Lowest( Low of Data2, Period ) ;

if Range1 <> 0 and Range2 <> 0 then
	begin
	Stoch1 = ( Close
		- Lowest( Low, Period ) ) / Range1 ;
	Stoch2 = ( Close of Data2
		- Lowest( Low of Data2, Period ) ) / Range2 ;

	{ difference in stochastics }
	Diff = Stoch1 - Stoch2;
	{ stress indicator }
	Range1 = Highest( Diff, Period )
		- Lowest( Diff, Period ) ;
	if Range1 <> 0 then
		StressValue = 100 * ( Diff
			- Lowest( Diff, Period ) ) / Range1 ;
	end ;

Plot1( StressValue, "Stress" ) ;
Plot2( Stoch1 * 100, "D1 Stoch" ) ;
Plot3( Stoch2 * 100, "D2 Stoch" ) ;
Plot4( OBLevel, "OverBought" ) ;
Plot5( OSLevel, "OverSold" ) ;
Plot6( NormalLevel, "Normal" ) ;
To download the EasyLanguage code, please visit our TradeStation & EasyLanguage support forum. The code can be found at https://www.tradestation.com/TASC-2014. The ELD filename is “_TASC_PJK_PAIRS.ELD.”
For more information about EasyLanguage in general please see https://www.tradestation.com/EL-FAQ.
A sample chart showing the PJK_TSMStress indicator is shown in Figure 1.
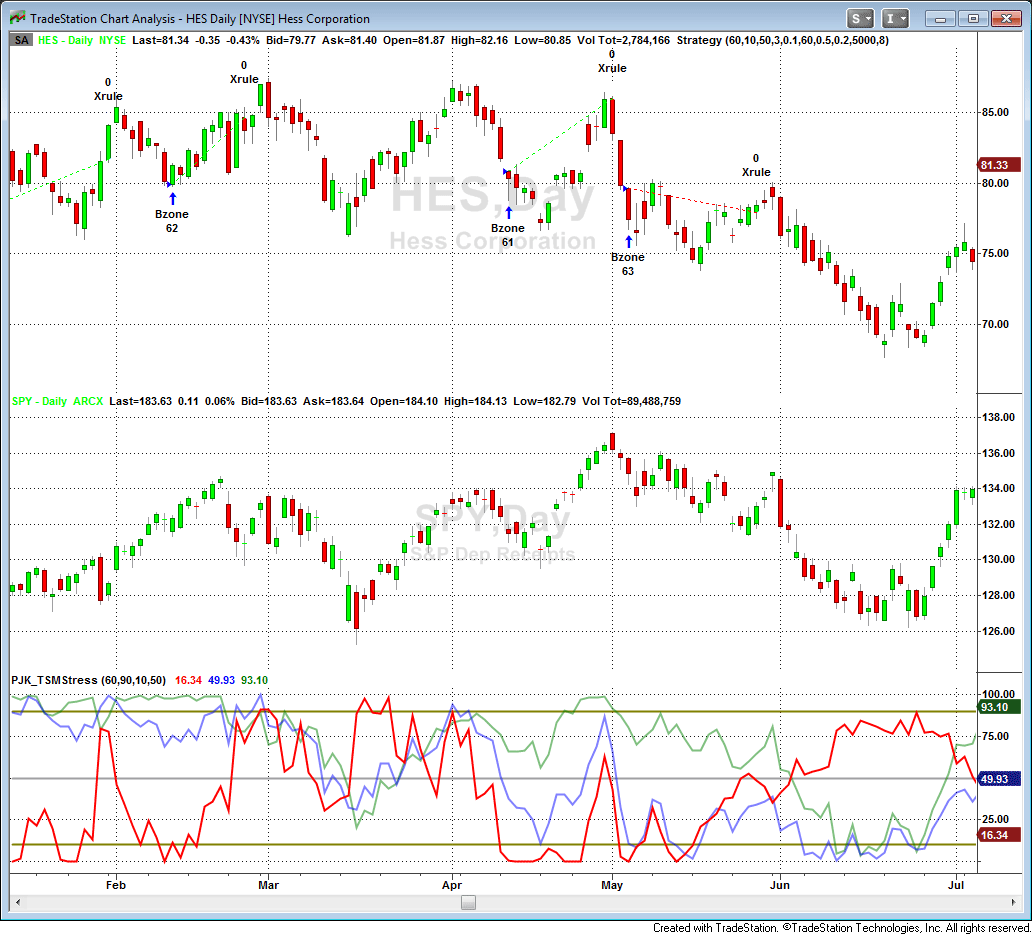
FIGURE 1: TRADESTATION. Here is a daily chart of Hess (HES) with the indicator and strategy applied.
This article is for informational purposes. No type of trading or investment recommendation, advice, or strategy is being made, given, or in any manner provided by TradeStation Securities or its affiliates.
—Doug McCrary
TradeStation Securities, Inc.
www.TradeStation.com
BACK TO LIST

CQG: MARCH 2014
For this month’s Traders’ Tip, we’re providing CQG code for the stress function based on Perry Kaufman’s article in this issue, “Timing The Market With Pairs Logic.”
CQG code for the study:
/*Stress Function, P.J. Kaufman*/
/*Raw Stochastics for Price1 and Price2*/
Data2:= S.US.SPY;
Range1:= HiLevel(@,period,0) - LoLevel(@,period,0);
Range2:= HiLevel(Data2,period,0) - LoLevel(Data2,period,0);
Stoch1:= (Close(@) - LoLevel(@,period,0))/Range1;
Stoch2:= (Data2 - LoLevel(Data2,period,0))/Range2;

/*Difference in Stochastics*/
Diff:= Stoch1-Stoch2;

/*Stress Indicator*/
Range1S:= HiLevel(Diff,period,0) - LoLevel(Diff,period,0);
StressValue:= 100*(Diff - LoLevel(Diff,period,0))/Range1S;
The study has one parameter, period, which may be configured in the “modify study parameters” window after the study has been applied to a chart in CQG. An example of the study applied to Hess (HES) is depicted in the chart shown in Figure 2.
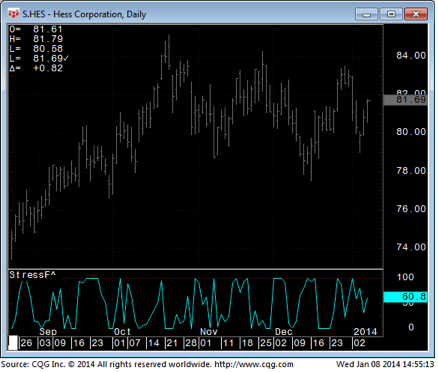
FIGURE 2: CQG. Here is an example of the study using Hess Corp. (HES).
To discuss this study or download a component PAC that includes complete formula code, please visit CQG Forums and CQG Workspaces. Our team of expert product specialists can advise you on the usage, application, and code for the study.
Trading and investment carry a high level of risk, and CQG, Inc. does not make any recommendations for buying or selling any financial instruments. We offer educational information on ways to use CQG trading tools, but it is up to our customers and other readers to make their own trading and investment decisions or to consult with a registered investment advisor.
—CQG, Inc.
www.CQG.com
BACK TO LIST

METASTOCK: MARCH 2014
Perry Kaufman’s article in this issue, “Timing The Market With Pairs Logic,” describes his stress indicator and how to use it in pair trading. The MetaStock code for this indicator based on his article is shown here:
Stress:

s1c:= Security("SPY",C);
s1l:= Security("SPY",L);
s1h:= Security("SPY",H);
Prd:= Input("Stoch Periods", 1, 100, 10);
R1:=(HHV(H,prd)-LLV(L,prd));
r2:= (HHV(s1h,prd)-LLV(s1l,prd));
ST1:= (C-LLV(L,prd))/r1;
ST2:= (s1c-LLV(s1l,prd))/r2;
diff:= ST1-ST2;
Sr1 := HHV(diff,prd)-LLV(diff,prd);
Stress := If(SR1<>0,100*((diff-LLV(diff,prd))/SR1), PREV);
stress;
100 * ST1;
100 * ST2
—William Golson
MetaStock Technical Support
www.metastock.com
BACK TO LIST

THINKORSWIM: MARCH 2014
In “Timing The Market With Pairs Logic” in this issue, author Perry Kaufman explains how to backtest the idea of hedging with an index-based ETF. Based on his article, we have created two new strategies and a new study for thinkorswim users in our proprietary scripting language, thinkScript. One strategy is for the equity and the other strategy is for the ETF.
A sample chart is shown in Figure 3.
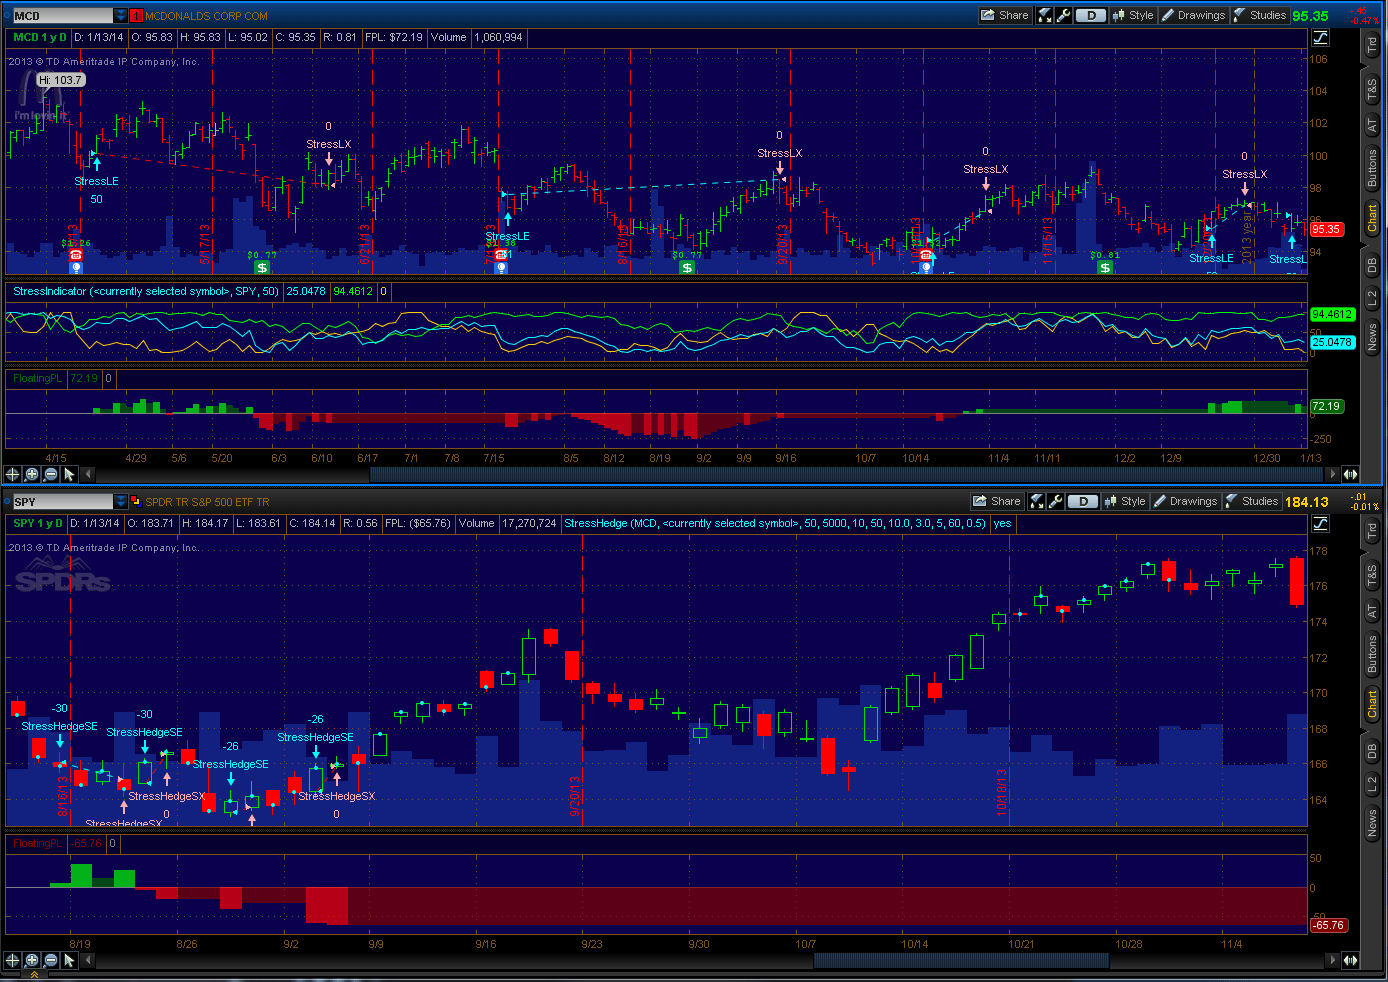
FIGURE 3: THINKORSWIM
For the Equity Strategy click here or:
- From our TOS Charts, Select Studies → Edit Studies.
- Select the Strategy tab in the upper left hand corner.
- Select New in the lower left hand corner.
- Name the strategy (i.e. Stress)
- Click in the script editor window, remove “addOrder(OrderType.BUY_AUTO, no);” and paste the following:
script StressIndicator {
    input stock = "<currently selected symbol>";
    input index = "SPY";
    input length = 50;

    def rangeStock = Highest(high(stock), length) - Lowest(low(stock), length);
    plot StochStock = 100 * if rangeStock != 0 then (close(stock) - Lowest(low(stock), length)) / rangeStock else 0;

    def rangeIndex = Highest(high(index), length) - Lowest(low(index), length);
    plot StochIndex = 100 * if rangeIndex != 0 then (close(index) - Lowest(low(index), length)) / rangeIndex else 0;

    def diff = StochStock - StochIndex;
    def rangeDiff = Highest(diff, length) - Lowest(diff, length);
    plot Stress = 100 * if rangeDiff != 0 then (diff - Lowest(diff, length)) / rangeDiff else 0;
}

input index = "SPY";
input length = 50;
input investment = 5000;
input entryLevel = 10;
input exitLevel = 50;
input stopLoss = 10.0;
input minPrice = 3.0;
input minPriceLength = 5;

def minPirceOk = Lowest(close, minPriceLength) > minPrice;
def stress = reference StressIndicator(index = index, length = length).Stress;
def entryPrice = EntryPrice();
def crisisStop = close / entryPrice - 1 < -stopLoss / 100;
def isReady = if !isReady[1] and stress > 50 then yes else if IsNaN(crisisStop) then isReady[1] else if !IsNaN(entryPrice) and crisisStop then no else isReady[1];

AddOrder(OrderType.BUY_TO_OPEN, isReady and stress <= entryLevel and minPirceOk, tradeSize = investment / close, tickColor = GetColor(1), arrowColor = GetColor(1), name = "StressLE");

AddOrder(OrderType.SELL_TO_CLOSE, !minPirceOk, tickColor = GetColor(2), arrowColor = GetColor(2), name = "StressMinPriceLX");
AddOrder(OrderType.SELL_TO_CLOSE, stress >= exitLevel, tickColor = GetColor(2), arrowColor = GetColor(2),  name = "StressLX");
AddOrder(OrderType.SELL_TO_CLOSE, crisisStop, tickColor = GetColor(2), arrowColor = GetColor(2), name = "StressCrisisStopLX");
For the ETF Strategy click here or:
- From our TOS Charts, Select Studies → Edit Studies.
- Select the Strategy tab in the upper left hand corner.
- Select New in the lower left hand corner.
- Name the strategy (i.e. StressHedge)
- Click in the script editor window, remove “addOrder(OrderType.BUY_AUTO, no);” and paste the following:
script StressIndicator {
    input stock = "<currently selected symbol>";
    input index = "SPY";
    input length = 50;

    def rangeStock = Highest(high(stock), length) - Lowest(low(stock), length);
    plot StochStock = 100 * if rangeStock != 0 then (close(stock) - Lowest(low(stock), length)) / rangeStock else 0;

    def rangeIndex = Highest(high(index), length) - Lowest(low(index), length);
    plot StochIndex = 100 * if rangeIndex != 0 then (close(index) - Lowest(low(index), length)) / rangeIndex else 0;

    def diff = StochStock - StochIndex;
    def rangeDiff = Highest(diff, length) - Lowest(diff, length);
    plot Stress = 100 * if rangeDiff != 0 then (diff - Lowest(diff, length)) / rangeDiff else 0;
}

input stock = "AAPL";
input index = "<currently selected symbol>";
input length = 50;
input investment = 5000;
input entryLevel = 10;
input exitLevel = 50;
input stopLoss = 10.0;
input minPrice = 3.0;
input minPriceLength = 5;
input hedgeLength = 60;
input hedgeRatio = 0.5;

def minPirceOk = Lowest(close(stock), minPriceLength) > minPrice;
def stress = reference StressIndicator(stock = stock, index = index, length = length).Stress;

def stockPosition = {default none, long};
def entryPrice;
def stockSize;
def crisisStop = close(stock) / entryPrice[1] - 1 < -stopLoss / 100;
def isReady = if !isReady[1] and stress > 50 then yes else if IsNaN(crisisStop) then isReady[1] else if !IsNaN(entryPrice[1]) and crisisStop then no else isReady[1];

def buy = isReady and stress <= entryLevel and minPirceOk;
def sell = !minPirceOk or stress >= exitLevel or crisisStop;

if buy {
    stockPosition = stockPosition.long;
    entryPrice = open(stock)[-1];
    stockSize = investment / close(stock)[-1];
} else if sell {
    stockPosition = stockPosition.none;
    entryPrice = Double.NaN;
    stockSize = 0;
} else {
    stockPosition = stockPosition[1];
    entryPrice = CompoundValue(1, entryPrice[1], Double.NaN);
    stockSize = stockSize[1];
}
def stockChange = close(stock) / close(stock)[1] - 1;
def indexChange = close(index) / close(index)[1] - 1;
def indexTrend = Average(close(index), hedgeLength);
def stockVol = StDev(stockChange, hedgeLength);
def indexVol = StDev(indexChange, hedgeLength);
def indexSize = stockSize * hedgeRatio * stockVol / indexVol;

plot Position = stockPosition;
Position.SetPaintingStrategy(PaintingStrategy.BOOLEAN_POINTS);

AddOrder(OrderType.SELL_TO_OPEN, stockPosition == stockPosition.long and indexTrend < indexTrend[1], tradeSize = indexSize, tickColor = GetColor(1), arrowColor = GetColor(1), name = "StressHedgeSE");
AddOrder(OrderType.BUY_TO_CLOSE, stockPosition == stockPosition.none or indexTrend > indexTrend[1], tickColor = GetColor(2), arrowColor = GetColor(2), name = "StressHedgeSX");
For the Study click here or:
- From our TOS Charts, Select Studies → Edit Studies.
- Select the Studies tab in the upper left hand corner.
- Select New in the lower left hand corner.
- Name the strategy (i.e. StressIndicator)
- Click in the script editor window, remove “plot Data = close;” and paste the following:
declare lower;

input stock = "<currently selected symbol>";
input index = "SPY";
input length = 50;

def rangeStock = Highest(high(stock), length) - Lowest(low(stock), length);
plot StochStock = 100 * if rangeStock != 0 then (close(stock) - Lowest(low(stock), length)) / rangeStock else 0;

def rangeIndex = Highest(high(index), length) - Lowest(low(index), length);
plot StochIndex = 100 * if rangeIndex != 0 then (close(index) - Lowest(low(index), length)) / rangeIndex else 0;

def diff = StochStock - StochIndex;
def rangeDiff = Highest(diff, length) - Lowest(diff, length);
plot Stress = 100 * if rangeDiff != 0 then (diff - Lowest(diff, length)) / rangeDiff else 0;

StochStock.SetDefaultColor(GetColor(1));
StochIndex.SetDefaultColor(GetColor(6));
Stress.SetDefaultColor(GetColor(4));
—thinkorswim
A division of TD Ameritrade, Inc.
www.thinkorswim.com
BACK TO LIST

WEALTH-LAB: MARCH 2014
In this issue, Perry Kaufman’s article “Timing The Market With Pairs Logic” promises an interesting new take on pair trading. As discussed in the article, combining Kaufman’s stochastic-derived intermarket stress indicator with a few clear position-sizing and risk-management rules lays the foundation for a long-only market timing system.
To execute the trading system that we are presenting here in Wealth-Lab strategy code, Wealth-Lab users need to install (or update to) the latest version of our TASCIndicators library from the extensions section of our website if they haven’t already done so, and restart Wealth-Lab.
A sample chart showing the stress indicator on Hess is in Figure 4.
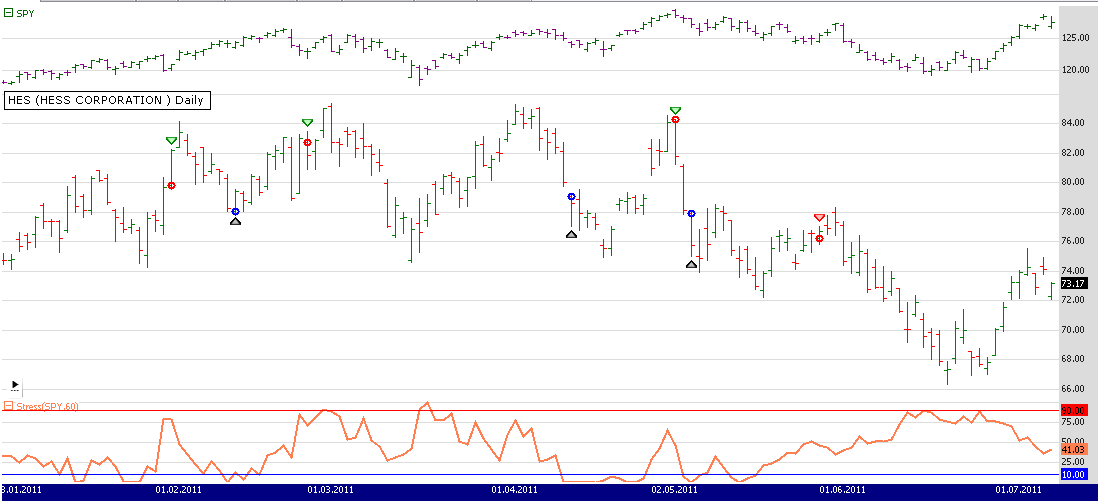
FIGURE 4: WEALTH-LAB. Here is a sample Wealth-Lab 6 chart illustrating application of the system’s rules on a daily chart of HES (middle pane). An SPY chart is shown in the upper pane, and the stress indicator is plotted in the bottom pane.
C# Code

using System;
using System.Collections.Generic;
using System.Text;
using System.Drawing;
using WealthLab;
using WealthLab.Indicators;
using TASCIndicators;

namespace WealthLab.Strategies
{
	public class PJKPairs1 : WealthScript
	{
		private StrategyParameter paramPeriod;
		private StrategyParameter paramBuy;
		private StrategyParameter paramSell;

		public PJKPairs1()
		{
			paramPeriod = CreateParameter("Period", 60, 10, 100, 10);
			paramBuy = CreateParameter("Buy", 10, 10, 30, 10);
			paramSell = CreateParameter("Sell", 50, 50, 90, 10);
		}

		protected override void Execute()
		{
			int period = paramPeriod.ValueInt;
			int buy = paramBuy.ValueInt;
			int sell = paramSell.ValueInt;

			string stock = Bars.Symbol;
			string idx = "SPY";
			Bars index = GetExternalSymbol( idx, true );
			DataSeries indexTrend = SMA.Series( index.Close, period );
			DataSeries stress = Stress.Series( Bars, index, period );

			ChartPane sPane = CreatePane( 30, false, true );
			PlotSeries( sPane, stress, Color.Coral, LineStyle.Solid, 2 );
			DrawHorzLine( sPane, 10, Color.Blue, LineStyle.Solid, 1 );
			DrawHorzLine( sPane, 90, Color.Red, LineStyle.Solid, 1 );

			ChartPane idxPane = CreatePane( 30, true, true );
			PlotSymbol( idxPane, index, Color.DarkGreen, Color.DarkMagenta );

			HideVolume();

			for(int bar = Bars.FirstActualBar + period; bar < Bars.Count; bar++)
			{
				List<Position> lst = new List<Position>();
				lst.AddRange(Positions);

				if( SymbolIsActive(stock) )
				{
					if( stress[bar] >= sell )
					{
						int lastActivePositionInStock = LastActivePositionInSym(lst,stock);

						if( (stress[bar] >= sell) && lastActivePositionInStock > -1 )
							SellAtMarket( bar+1, Positions[lastActivePositionInStock], "Xrule" );
					}

					if( SymbolIsActive(idx))
					{
						if( indexTrend[bar] < indexTrend[bar-1] )
						{
							int lastActivePositionInIndex = LastActivePositionInSym(lst,idx);

							if( lastActivePositionInIndex > -1 )
							{
								SetContext( idx, true );
								SellAtMarket( bar+1, Positions[lastActivePositionInIndex], "Sell " + idx );
								RestoreContext();
							}
						}
					}
					else
					{
						if( indexTrend[bar] < indexTrend[bar-1] )
						{
							SetContext( idx, true );
							BuyAtMarket( bar+1, "Buy " + idx );
							RestoreContext();
						}
					}
				}
				else
				{
					if( stress[bar] <= buy )
					{
						BuyAtMarket( bar+1, "Buy " + stock );
					}
				}
			}
		}

		private bool SymbolIsActive(string sym)
		{
			foreach (Position p in ActivePositions)
				if( sym == p.Bars.Symbol )
					return true;
			return false;
		}

		private int LastActivePositionInSym( List<Position> lst, string symbol )
		{
			return lst.FindLastIndex( delegate(Position pos) { return pos.Symbol.Equals(symbol, StringComparison.Ordinal); });
		}
	}
}
—Eugene, Wealth-Lab team
MS123, LLC
www.wealth-lab.com
BACK TO LIST

AMIBROKER: MARCH 2014
In “Timing The Market With Pairs Logic” in this issue, author Perry Kaufman presents a pair-trading technique based on his new stress indicator. A ready-to-use AmiBroker formula for implementing the stress indicator is presented here. To display the indicator, input the formula into the formula editor and press “apply indicator.”
A sample chart is shown in Figure 5.
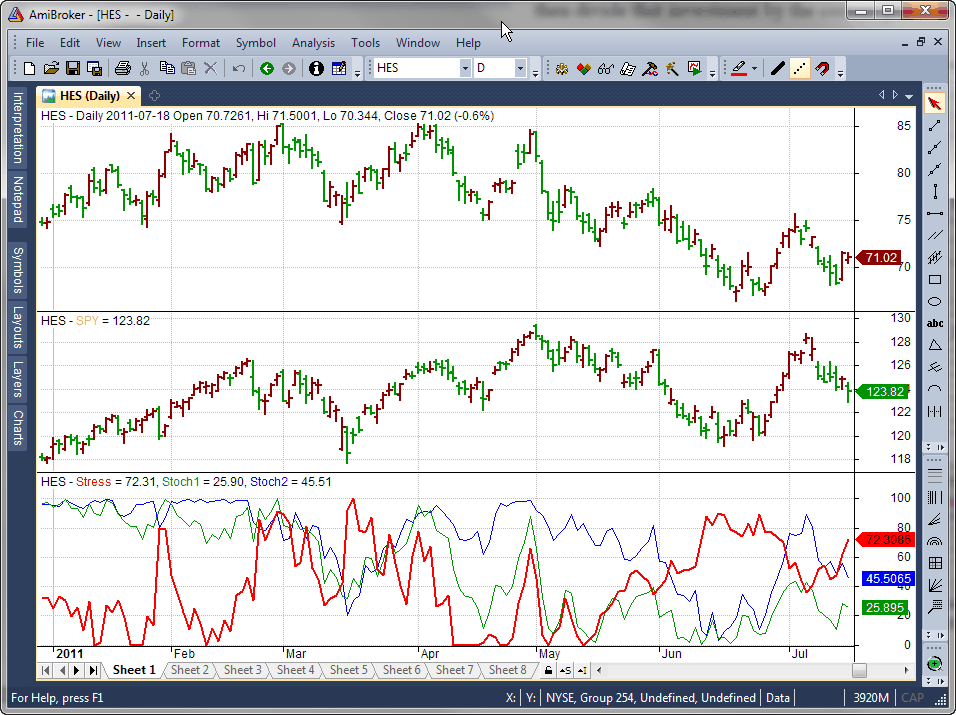
FIGURE 5: AMIBROKER. Here is a daily chart of HES with a daily chart of SPY in the middle pane and Perry Kaufman’s stress indicator (red) in the bottom pane.
LISTING 1.
function PJKStress( High2, Low2, Close2, period )
{
  range1 = HHV( High, period ) - LLV( Low, period );
  range2 = HHV( High2, period ) - LLV( Low2, period );
  stoch1 = ( Close - LLV( Low, period ) )/range1;
  stoch2 = ( Close2 - LLV( Low2, period ) )/range2;

  VarSet("sstoch1", 100 * stoch1 );
  VarSet("sstoch2", 100 * stoch2 );

  diff = stoch1 - stoch2;

  range1 = HHV( diff, period ) - LLV( diff, period );

  return 100 * ( diff - LLV( diff, period ) )/range1;
}

momper = 60;
Hedgeper = 60;

SetForeign("SPY");
// store index data in High2/Low2/Close2 variables
High2 = High;
Low2 = Low;
Close2 = Close;
RestorePriceArrays();

stress = PJKStress( High2, Low2, Close2, momper );

Plot( stress, "Stress", colorRed, styleThick );
Plot( sstoch1, "Stoch1", colorGreen );
Plot( sstoch2, "Stoch2", colorBlue );
—Tomasz Janeczko, AmiBroker.com
www.amibroker.com
BACK TO LIST

NEUROSHELL TRADER: MARCH 2014
The stress indicator described by Perry Kaufman in his article in this issue (“Timing The Market With Pairs Logic”) can be easily implemented with a few of NeuroShell Trader’s 800+ indicators. Simply select new indicator from the Insert menu and use the indicator wizard to set up the following indicator:
Stress indicator:
SimpleStoch%K( Sub( Stoch%K(High,Low,Close,60),Stoch%K(SPDRS High,SPDRS Low,SPDRS Close,60) ),60 )
To implement the stock-trading side of the pair, simply select new trading strategy from the Insert menu and enter the following in the appropriate locations of the trading strategy wizard:
BUY LONG CONDITIONS: [All of which must be true]
     A<B(Stress Indicator,10)

LONG TRAILING STOP PRICES:
     TrailPrice%(Trading Strategy,20)

SELL LONG CONDITIONS: [All of which must be true]
     A>B(Stress Indicator,50)

POSITION SIZING METHOD: Fixed Dollar: 5,000.00 Dollars
To implement the hedge signal and calculate the size of the hedge, simply select new indicator from the Insert menu and use the indicator wizard to create the following indicators:
Hedge Signal:	And2( A<B( Avg(SPDRS Close,60), Lag( Avg(SPDRS Close,60), 1)), Or2( A>B( Long Entry Signal: Trading Strategy, 0), A>B( Position(Trading Strategy,0), 0)))

Hedge Size: 	Mul3( Divide(5000,Close), 0.5, Divide( StndDev( Sub( ROC(Close,1), 1), 60), StndDev( Sub( ROC(SPDRS Close,1), 1), 60)))
Users of NeuroShell Trader can go to the Stocks & Commodities section of the NeuroShell Trader free technical support website to download a copy of this or any previous Traders’ Tips.
A sample chart is shown in Figure 6.
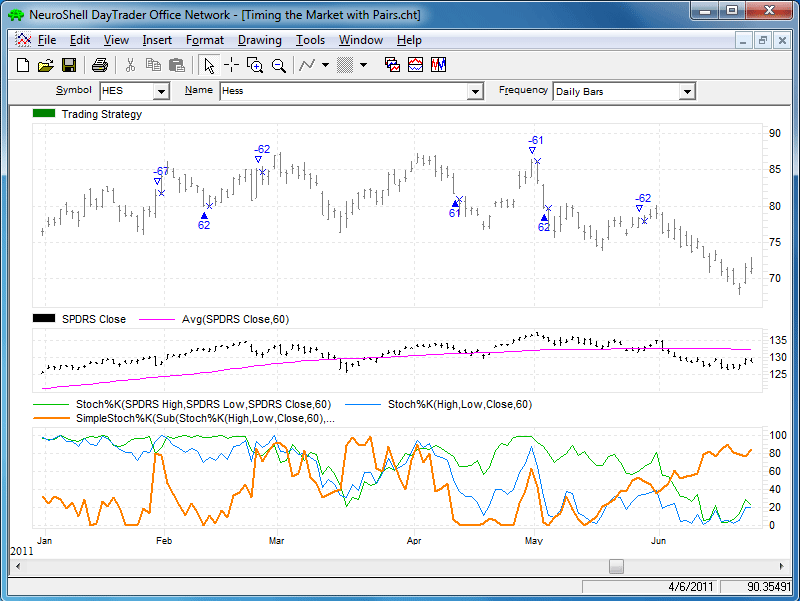
FIGURE 6: NEUROSHELL TRADER. This NeuroShell Trader chart displays the stress Indicator and corresponding stock trades.
—Marge Sherald, Ward Systems Group, Inc.
301 662-7950, sales@wardsystems.com
www.neuroshell.com
BACK TO LIST

AIQ: MARCH 2014
The AIQ code based on Perry Kaufman’s article in this issue, “Timing The Market With Pairs Logic,” is provided at www.TradersEdgeSystems.com/traderstips.htm.
The code I am providing will backtest only the long trading and will not test the hedging portion of the system. For live trading, I provided a manual input for the total value of the open positions, which would have to be computed separately and then entered daily as an input before the daily report is run once the hedge rule becomes true.
!TIMING THE MARKET WITH PAIRS
!Author: Perry Kaufman, TASC March 2014
!Coded by: Richard Denning 1/7/2014
!www.TradersEdgeSystems.com

!INPUTS:
stoLen is 60.
idx is "NDX".
hedgeETF is "PSQ".
eLvl is 10.
xLvl is 50.
sLoss is 0.10.
hedgeLen is 60.
hedgeRatio is 0.50.
minP is 3.
invest is 5000.
totValOpenPos is 100000. !open position value must be set manually

H is [high].
L is [low].
C is [close].
O is [open].
idxH is tickerUDF(idx,H).
idxL is tickerUDF(idx,L).
idxC is tickerUDF(idx,C).
idxO is tickerUDF(idx,O).
hedgeC is tickerUDF(hedgeETF,C).
PEP is {position entry price}.

!STRESS CODE:
rngStk is highresult(H,stoLen) - lowresult(L,stoLen).
rngIdx is highresult(idxH,stoLen) - lowresult(idxL,stoLen).
stoStk is (C - lowresult(L,stoLen)) / rngStk.
stoIdx is (idxC - lowresult(idxL,stoLen)) / rngIdx.
stoDiff is stoStk - StoIdx.
rngDiff is highresult(stoDiff,stoLen) - lowresult(stoDiff,stoLen).
stressVal is ((stoDiff - lowresult(stoDiff,stoLen)) / rngDiff) * 100.

!PAIRS SYSTEM CODE:
Buy if C > minP and countof(C > minP,4,1)=4 and stressVal <= eLvl and symbol()<>hedgeETF.
StressExit if stressVal >= xLvl.
ExitBuy if countof(C > minP,5)<>5 or C/PEP-1 < -sLoss or StressExit.

!TREND CODE:
idxTrnd is simpleavg(idxC,hedgeLen).
Hedge if idxTrnd < valresult(idxTrnd,1) and symbol()=hedgeETF .

!SIZING CODE:
chgStk is C/valresult(C,1) - 1.
chgIdx is idxC/valresult(idxC,1) - 1.
idxSMA is simpleavg(idxC,hedgeLen).
size is floor(invest / C).
hedgeSize is floor(totValOpenPos / hedgeC*hedgeRatio) .

ShowAllValues if countof(C > minP,5)=5.
To get a correlated list of stocks that show good correlation to the index of choice (I used the NDX), AIQ has a matchmaker module that will quickly generate a list of stocks that show significant correlation to an index. In Figure 7, I show the matchmaker setup I used to quickly get a list of stocks in the NASDAQ 100 that were highly correlated to the NDX. In Figure 8, I show the results (part of which are hidden). After highlighting the ones desired for a list, simply click on the “data manager” button and a list is created, which is then used to run the tests.

FIGURE 7: AIQ, MATCHMAKER SETUP. Here is the setup used to get a list of stocks in the NASDAQ 100 that are highly correlated to the NDX.
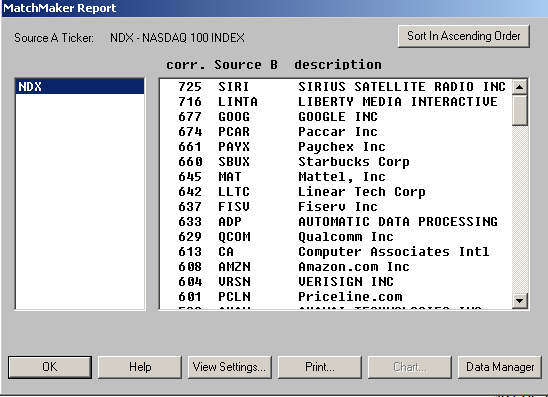
FIGURE 8: AIQ, RESULTING LIST. Here are sample results of running the setup shown in Figure 7.
—Richard Denning
info@TradersEdgeSystems.com
for AIQ Systems
BACK TO LIST

TRADERSSTUDIO: MARCH 2014
The TradersStudio code based on Perry Kaufman’s article in this issue, “Timing The Market With Pairs Logic,” is provided at the following websites:
The following code file are provided in the download:
- Function PK_STRESS — returns the Kaufman stress value
- Function COUNTOF — returns the number of times a rule is true in a set lookback period
- System PK_PAIRS — system to go long stocks based on the stress indicator
- System PK_STRES_HEDGE — system that is to be used with the PK_PAIRS system for hedging
- TradePlan EqualDollar_HedgeTASC — tradeplan that runs the two systems with equal dollars invested per trade.
I set up the code on the NASDAQ 100 list of stocks and used the NDX index for pairing. I also set up the hedge using the QQQ ETF going short on the hedge signals. If trading an IRA account, the hedging system can be switched to use an inverse ETF. I used the QQQ for testing because it has more data than the inverse ETFs. In Figure 9, I show the log equity curve and the underwater percent drawdown curve over the test period 1/1/2000 to 1/8/2014. Until 2011, the max drawdowns were in the 14% area but in 2011 the max drawdown incurred was 22.7%. The compound annual return over the test period was 14.9%.
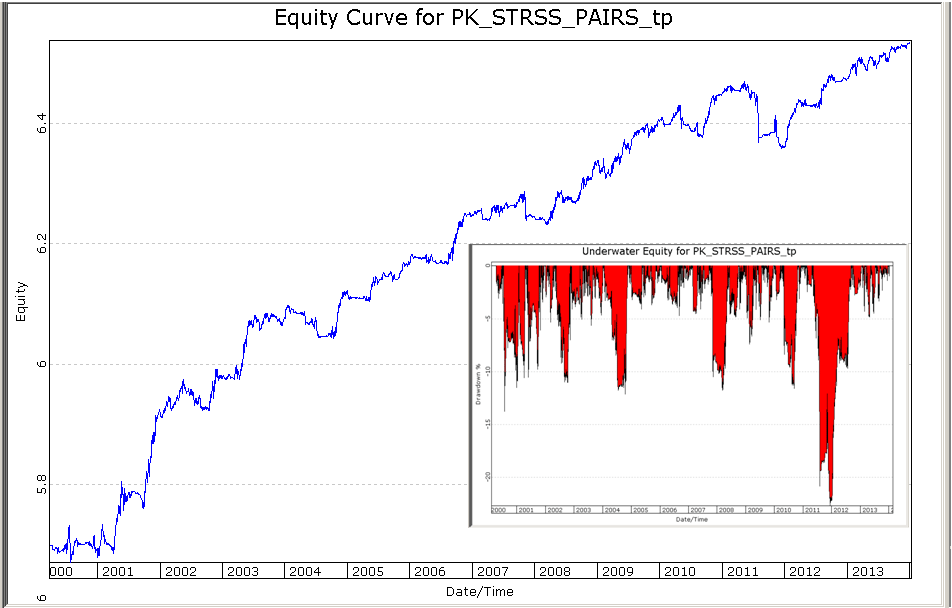
FIGURE 9: TRADERSSTUDIO. This shows the log equity curve and the underwater percent drawdown curve over the test period of 1/1/2000 to 1/8/2014 using the NASDAQ 100 list of stocks, the NDX index for pairing, and the QQQ ETF going short for hedging.
Please note that the code I have provided differs from the author’s code in that the tradeplan compounds the results, so that the size is adjusted upward as the equity grows, and the hedge does not use the volatility adjustment.
The code is also shown here:
'TIMING THE MARKET WITH PAIRS
'Author: Perry Kaufman, TASC March 2014
'Coded by: Richard Denning 1/7/2014
'www.TradersEdgeSystems.com

Function PK_STRESS(stoLen)
Dim idxH As BarArray
Dim idxL As BarArray
Dim idxC As BarArray
Dim rngStk As BarArray
Dim rngIdx As BarArray
Dim stoStk As BarArray
Dim stoIdx As BarArray
Dim stoDiff As BarArray
Dim rngDiff As BarArray
Dim stressVal As BarArray
idxH = H Of independent1
idxL = L Of independent1
idxC = C Of independent1
rngStk = Highest(H,stoLen) - Lowest(L,stoLen)
rngIdx = Highest(idxH,stoLen) - Lowest(idxL,stoLen)
If rngStk <> 0 Then
  stoStk = (C - Lowest(L,stoLen)) / rngStk
End If
If rngIdx <> 0 Then
  stoIdx = (idxC - Lowest(idxL,stoLen)) / rngIdx
End If
stoDiff = stoStk - stoIdx
rngDiff = Highest(stoDiff,stoLen) - Lowest(stoDiff,stoLen)
If rngDiff <> 0 Then
  stressVal = ((stoDiff - Lowest(stoDiff,stoLen)) / rngDiff) * 100
End If
PK_STRESS = stressVal
End Function
'------------------------------------------------------------------
'COUNTOF Function
'returns how many times a rule is true in the lookback length
'coded by Richard Denning 01/04/08

Function COUNTOF(rule As BarArray, countLen As Integer, offset As Integer)
Dim count As Integer
Dim counter As Integer
    For counter = 0 + offset To countLen + offset - 1
        If rule[counter] Then
            count = count + 1
        End If
    Next
COUNTOF = count
End Function
'--------------------------------------------------------------------
'System to go long stocks:

Sub PK_PAIRS(stoLen,eLvl,xLvl,sLoss,hedgeLen,hedgeRatio,minP)
Dim stressVal
stressVal = PK_STRESS(stoLen)
If countof(TSCLose > minP,5,0)=5 And stressVal <= eLvl Then Buy("LE",1,0,Market,Day)
If countof(TSCLose > minP,5,0)<>5 Then ExitLong("LX_minP","",1,0,Market,Day)
If EntryPrice <> 0 Then
    If C/EntryPrice-1 < -sLoss Then ExitLong("LX_sLoss","",1,0,Market,Day)
End If
If stressVal >= xLvl Then ExitLong("LX_stress","",1,0,Market,Day)
End Sub
'--------------------------------------------------------------------
'System to hedge the long stock trading system:

Sub PK_STRESS_HEDGE(hedgeLen,offset,useInverseETF)
Dim idxTnd As BarArray
idxTnd = Average(C,hedgeLen)
If useInverseETF = 1 Then
  If idxTnd > idxTnd[offset] Then Buy("LE_hedge",1,0,Market,Day)
  If idxTnd < idxTnd[offset] Then ExitLong("LX_hedge","LE_hedge",1,0,Market,Day)
Else
  If idxTnd < idxTnd[offset] Then Sell("SE_hedge",1,0,Market,Day)
  If idxTnd > idxTnd[offset] Then ExitShort("SX_hedge","SE_hedge",1,0,Market,Day)
End If
End Sub
'--------------------------------------------------------------------
'TradePlan that runs the two sessions for the ong stock system and the hedge system:

'This will invest the same amount of money into each stock
'It will work for traderstudio stocks only
'The hedging strategy differs from thatin the article

Sub EqualDollar_HedgeTASC(leverageMult,hedgeLen,hedgeRatio)
    Dim iS As Integer
    Dim iM As Integer
    Dim iO As Integer
    Dim iT As Integer
    Dim openPos As BarArray(1000)
    Dim objS As TSProcessor.ISession
    Dim objSH As TSProcessor.ISession
    Dim objM As TSProcessor.IMarket
    Dim AO As TSProcessor.IActiveOrder
    Dim DollarPerTrade
    Dim StartAccount
    Dim DollarsPerTrade
    Dim stkChg As BarArray
    Dim idxChg As BarArray
    Dim info As Array
    Dim stkVola,idxVola,idxSize,openVolaPort,openVolaPortAvg,maxHedge
    tradeplan.StockMarginMultiplier = Min(leverageMult,2)
    objS = TradePlan.Session(0)
    objSH = TradePlan.Session(1)
    DollarsPerTrade=Round(tradeplan.SummEquity/objS.MarketCount,2)*leverageMult
For iS = 0 To tradeplan.sessioncount - 1
  If tradeplan.Session(iS) = objS Then
    For iM = 0 To objS.marketcount - 1
        objM = objS.Market(iM)
        objM.EntryNumUnits=Floor((DollarsPerTrade)/Round(objM.Data(0,"TSClose",0),4))
    Next
  End If
  If tradeplan.Session(iS) = objSH Then
    For iM = 0 To objSH.marketcount - 1
        objM = objSH.Market(iM)
        maxHedge = tradeplan.SummEquity - tradeplan.AvailableEquity
        objM.EntryNumUnits=Min(hedgeRatio*maxHedge,hedgeRatio*tradeplan.SummEquity)/objM.Data(0,"Close",0)
    Next
  Else
    objM.EntryNumUnits = 0
  End If
Next
SizeForTotalExits
End Sub
—Richard Denning
info@TradersEdgeSystems.com
for TradersStudio
BACK TO LIST

NINJATRADER: MARCH 2014
We have implemented a strategy for NinjaTrader users based on “Timing The Market With Pairs Logic” by Perry Kaufman in this issue. The strategy is available for download from www.ninjatrader.com/SC/March2014SC.zip.
Once it has been downloaded, from within the NinjaTrader Control Center window, select the menu File → Utilities → Import NinjaScript and select the downloaded file. This file is for NinjaTrader version 7 or greater.
You can review the strategy source code by selecting the menu Tools → Edit NinjaScript → Strategy from within the NinjaTrader Control Center window and selecting the “Timing With Pairs” file.
NinjaScript uses compiled DLLs that run native, not interpreted, which provides the user with the highest performance possible.
A sample chart implementing the strategy is shown in Figure 10.
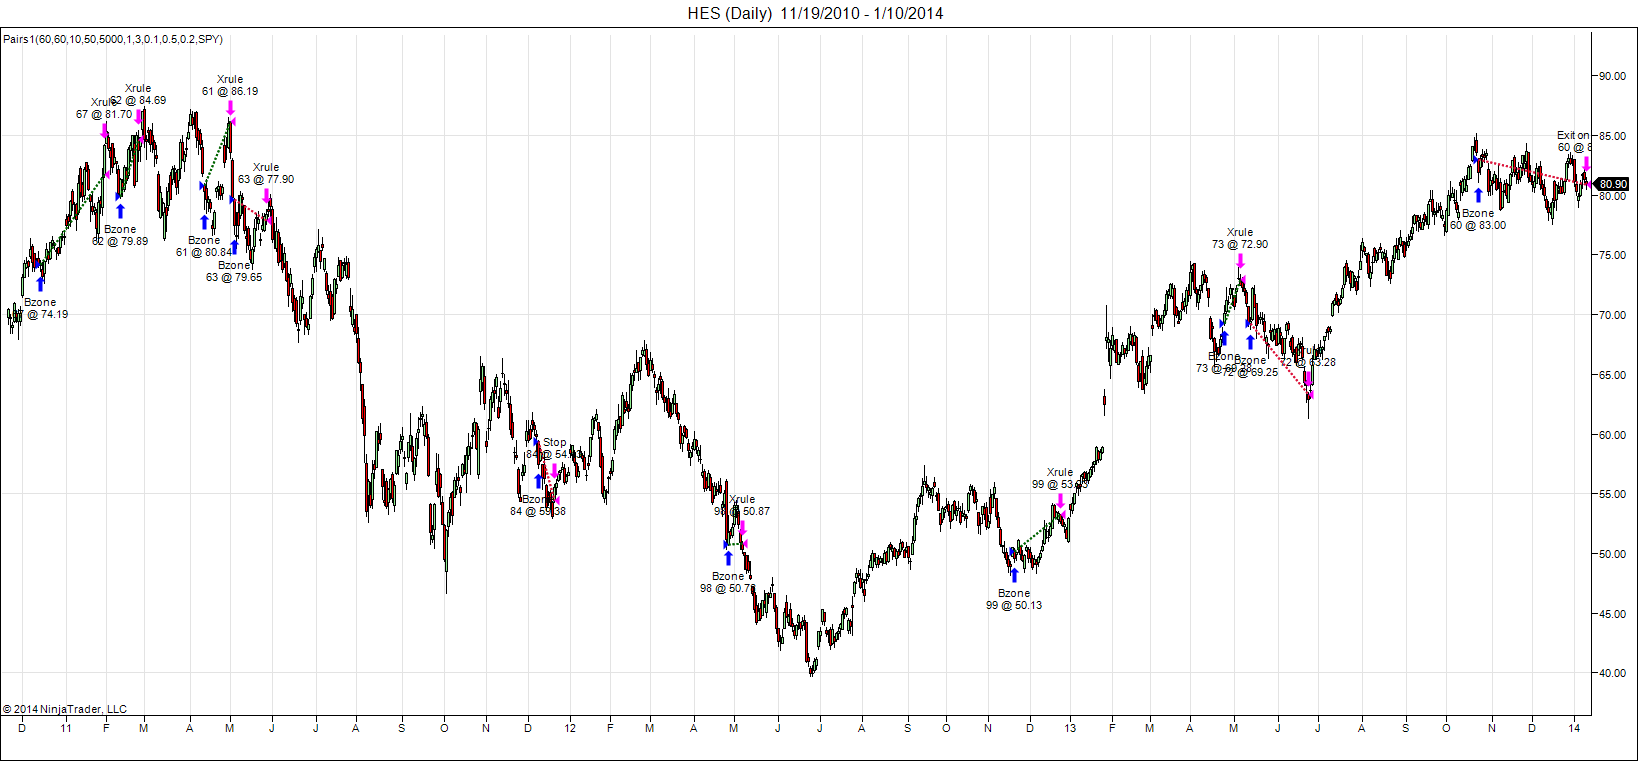
FIGURE 10: NINJATRADER. This screenshot shows the TimingWithParis strategy applied to a daily chart of the stock HES (while SPY is the second symbol internal to create the pair).
—Raymond Deux & Patrick Hodges
NinjaTrader, LLC
www.ninjatrader.com
BACK TO LIST

UPDATA: MARCH 2014
This month’s Traders’ Tip is based on “Timing The Market With Pairs Logic” by Perry Kaufman. In his article, Kaufman develops a correlated pair-trading system for use across fundamentally different markets to better mitigate risk across a portfolio. The key indicator in this system seeks to identify when both spread legs are at maximum divergence, and enters reversion trades at these points.
The Updata code for this article is in the Updata library and may be downloaded by clicking the custom menu and system library. Those who cannot access the library due to a firewall may paste the code shown here into the Updata custom editor and save it.
PLOTSTYLE LINE
INDICATORTYPE CHART
PARAMETER "Period" #PERIOD=20
PARAMETER "Stochastic 1" #STOCHPERIOD1=50
PARAMETER "Stochastic 2" #STOCHPERIOD2=50
PARAMETER "Ticker" ~TICKER=SELECT
PARAMETER "Momentum Period" #MOMPERIOD=60
PARAMETER "Entry Level" #ENTRYLEVEL=10
PARAMETER "Exit Level" #EXITLEVEL=50
PARAMETER "Min. Price" @MINPRICE=3
PARAMETER "Hedge Period" #HEDGEPERIOD=60
PARAMETER "Hedge Ratio" @HEDGERATIO=0.5
PARAMETER "Corr. Filter" @CORRFILTER=0.2
PARAMETER "Min. Price Days" #MINPRICEDAYS=5
PARAMETER "Investment" #INVESTMENT=5000
PARAMETER "Stock Cost" @COST=0
NAME "Stress" ""
@RANGE1=0
@RANGE2=0
@STOCH1=0
@STOCH2=0
@DIFF=0
@PJK_STRESS=0

@STOCKCHANGE=0
@INDEXCHANGE=0
@INDEXTREND=0
@NEWBUY=0
@STOCKSIZE=0
@INDEXSIZE=0
@INDEXPOS=0
@WAITFORRESET=0
@MINPRICEOK=0
@STOPLOSS=0
@ENTRYPRICE=0

@STOCKVOL=0
@INDEXVOL=0

@TODAYSTOCKPL=0
@TODAYINDEXPL=0
@TODAYCOMBOPL=0
@STOCKPL=0
@INDEXPL=0
@COMBOPL=0

FOR #CURDATE=0 TO #LASTDATE
   'RAW STOCHASTICS FOR BOTH LEGS OF SPREAD
   @RANGE1=PHIGH(HIGH,#PERIOD)-PLOW(LOW,#PERIOD)
   @RANGE2=PHIGH(HIGH(~TICKER,0),#PERIOD)-PLOW(LOW(~TICKER,0),#PERIOD)
   @STOCKCHANGE=-1+CLOSE/CLOSE(1)
   @INDEXCHANGE=-1+CLOSE(~TICKER,0)/CLOSE(~TICKER,1)
   @INDEXTREND=SGNL(CLOSE(~TICKER,0),#HEDGEPERIOD,M)
   @NEWBUY=FALSE
   IF @RANGE1!=0 AND @RANGE2!=0
      @STOCH1=(CLOSE-PLOW(LOW,#PERIOD))/@RANGE1
      @STOCH2=(CLOSE(~TICKER,0)-PLOW(LOW(~TICKER,0),#PERIOD))/@RANGE2
      'DIFFERENCE IN STOCHASTICS
      @DIFF=@STOCH1-@STOCH2
      'STRESS INDICATOR
      @RANGE1=PHIGH(@DIFF,#PERIOD)-PLOW(@DIFF,#PERIOD)
      IF @RANGE1!=0
         @PJK_STRESS=100*(@DIFF-PLOW(@DIFF,#PERIOD))/@RANGE1
      ENDIF
      @PLOT=@PJK_STRESS
   ENDIF
   IF ORDERISOPEN=0
      @STOCKSIZE=0
      @INDEXSIZE=0
      @INDEXPOS=0
   ENDIF
   IF @WAITFORRESET AND @PJK_STRESS>50
      @WAITFORRESET=FALSE
   ENDIF
   'SET MINIMUM PRICE CONDITION
   @MINPRICEOK=FALSE
   IF PLOW(CLOSE,#MINPRICEDAYS)>@MINPRICE
      @MINPRICEOK=TRUE
   ENDIF
   'MIN PRICE MUST OCCUR N TIMES IN A ROW TO START TO END
   IF ORDERISOPEN=0 AND @WAITFORRESET=FALSE AND @PJK_STRESS<=#ENTRYLEVEL AND @MINPRICEOK=TRUE
      @STOCKSIZE=INT(#INVESTMENT/CLOSE)
      BUY CLOSE,@STOCKSIZE
      @NEWBUY=TRUE
      @INDEXPOS=0
      @ENTRYPRICE=CLOSE
   ELSEIF ORDERISOPEN !=0
      IF @MINPRICEOK=FALSE
         SELL CLOSE
         @INDEXPOS=0
      ELSEIF @PJK_STRESS>=#EXITLEVEL
         SELL CLOSE
         @INDEXPOS=0
      ELSEIF @STOPLOSS !=0 AND (CLOSE/@ENTRYPRICE)-1<@STOPLOSS
         SELL CLOSE
         @INDEXPOS=0
         @WAITFORRESET=TRUE
      ENDIF
   ENDIF
   'ENTER AN INDEX HEDGE IF TREND IS DOWN
   IF #HEDGEPERIOD!=0 AND @INDEXPOS=0 AND (ORDERISOPEN!=0 OR @NEWBUY!=TRUE)
      IF @INDEXTREND<HIST(@INDEXTREND,1)
         'CALC. HEDGE AMOUNT
         @STOCKVOL=STDDEV(@STOCKCHANGE,#HEDGEPERIOD)
         @INDEXVOL=STDDEV(@INDEXCHANGE,#HEDGEPERIOD)
         'IF INDEX VOL IS GREATER,RATIO LESS THAN 1
         @INDEXSIZE=@STOCKSIZE*@HEDGERATIO*(@STOCKVOL/@INDEXVOL)
         @INDEXPOS=-1
      ENDIF
   ENDIF
   'INDEX TREND TURNS UP THEN REMOVE HEDGE
   IF @INDEXPOS AND @INDEXTREND>HIST(@INDEXTREND,1)
      @INDEXPOS=0
      @INDEXSIZE=0
   ENDIF
   'THESE ITEMS ARE ALREADY HANDLES IN UPDATA
   'THE MINIMUM PRICE FILTER PREVENTS USING STOCKS THAT HAVE GONE NEGATIVE
   'DUE TO BACK TO BACK ADJUSTING SPLITS
   @TODAYSTOCKPL=ORDERISOPEN*HIST(@STOCKSIZE,1)*(CLOSE-CLOSE(1))
   IF HIST(@STOCKSIZE,1)<HIST(@STOCKSIZE,2)
      @TODAYSTOCKPL=@TODAYSTOCKPL-@COST
   ENDIF
   @TODAYINDEXPL=HIST(@INDEXSIZE,1)*HIST(@INDEXPOS,1)*(CLOSE(~TICKER,0)-CLOSE(~TICKER,1))
   IF HIST(@INDEXSIZE,1)<HIST(@INDEXSIZE,2)
      @TODAYINDEXPL=@TODAYINDEXPL-@COST
   ENDIF
   @TODAYCOMBOPL=@TODAYSTOCKPL+@TODAYINDEXPL
   @STOCKPL=@STOCKPL+@TODAYSTOCKPL
   @INDEXPL=@INDEXPL+@TODAYINDEXPL
   @COMBOPL=@COMBOPL+@TODAYCOMBOPL
NEXT
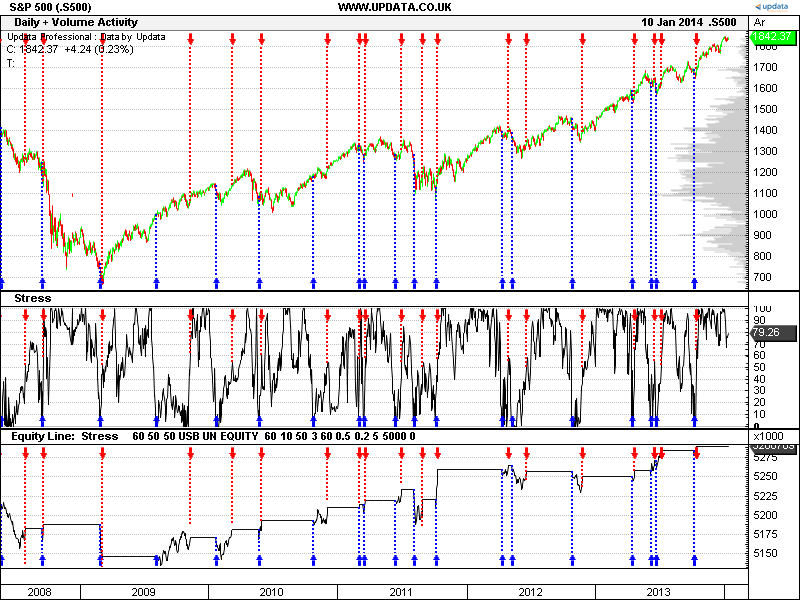
FIGURE 11: UPDATA. Here is a sample pair-trading strategy for the SPY index/USB UN equity. The stress indicator is shown in the middle pane.
—Updata support team
support@updata.co.uk
www.updata.co.uk
BACK TO LIST

TRADING BLOX: MARCH 2014
In “Timing The Market With Pairs Logic” in this issue, author Perry Kaufman presents his stress indicator and a pair-trading strategy. For the Trading Blox code that replicates these strategies, visit the Trading Blox forum at https://www.tradingblox.com/forum/viewtopic.php?t=10172.
The code is also shown here:
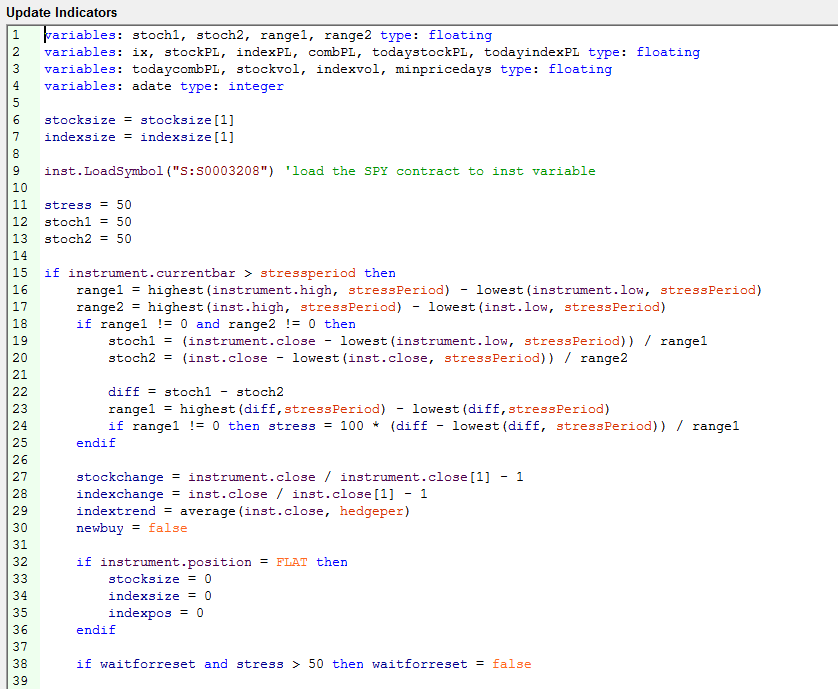
Update Indicators code part 1.
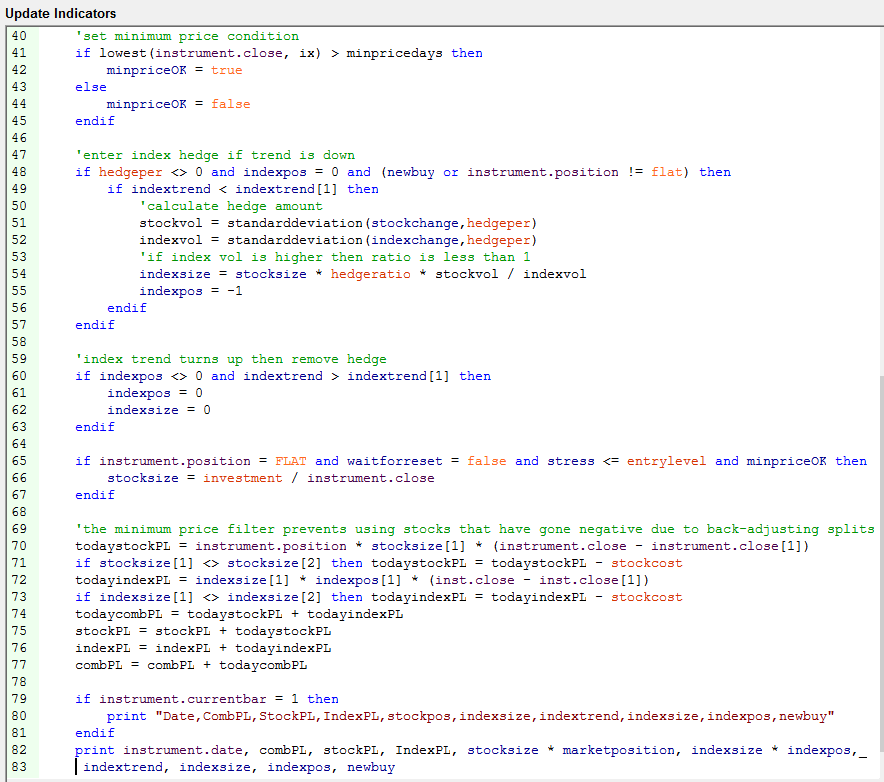
Update Indicators code part 2.

Entry Orders code.
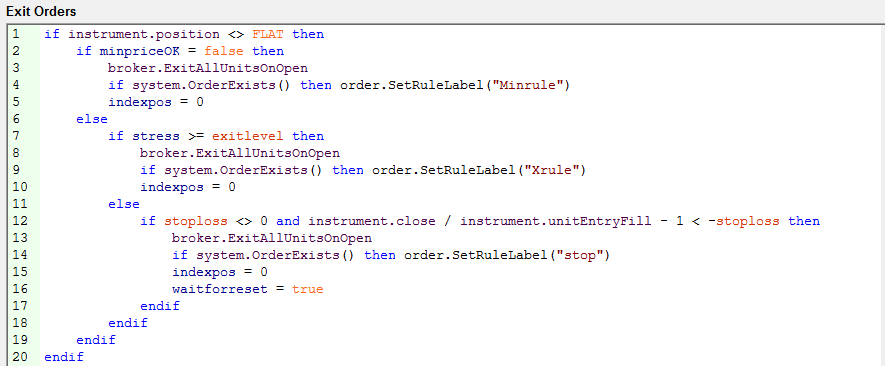
Exit Orders code.
—Trading Blox
tradingblox.com
BACK TO LIST

TRADE NAVIGATOR: MARCH 2014
Based on “Timing The Market With Pairs Logic” by Perry Kaufman in this issue, we have created the special file “SC201403” that Trade Navigator users can download to make it easy to implement Kaufman’s technique.
To download the file, click on Trade Navigator’s blue telephone button, select download special file, then erase the word “upgrade” and type in SC201403, and click the start button. When prompted to upgrade, click the yes button. If prompted to close all software, click the continue button. Your library will now download.
This library contains all the indicators discussed in Kaufman’s article as well as a template called “timing the market with pairs.” This prebuilt template can be overlaid onto a chart by opening the charting dropdown menu, then selecting the templates command, then selecting the template. This template, when applied to a stock chart, will contain the stock’s price in the upper pane, the SPY price in the central pane for comparison, and the three stress indicators in the lower pane.
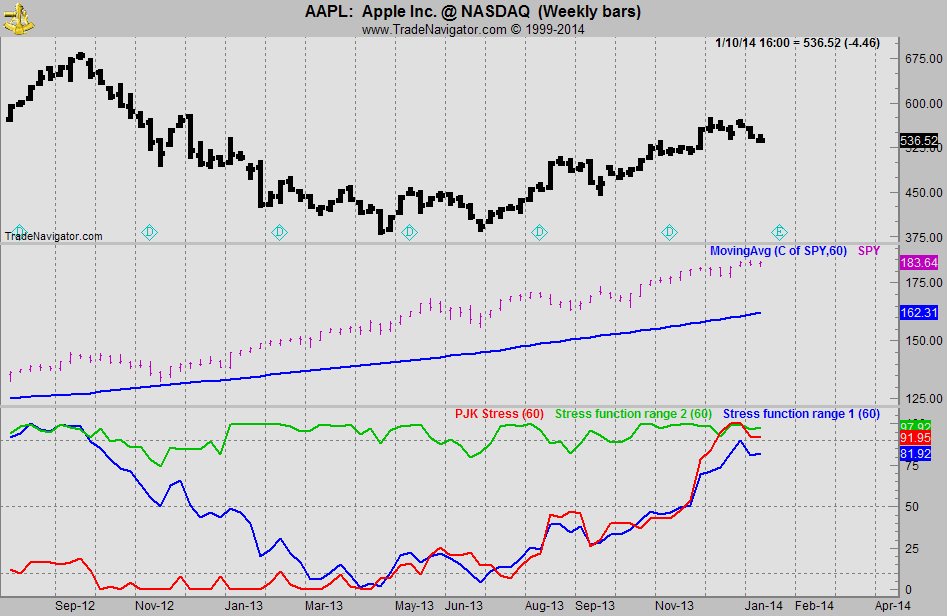
FIGURE 12: TRADE NAVIGATOR, STRESS INDICATORS. Here is a sample chart of AAPL showing the three stress functions (the PJK stress indicator, the stress function range 1, and stress function range 2).
The TradeSense code for the indicators follows:
PJK STRESS
&range1 := Highest (High , period) - Lowest (Low , period)
&range2 := (Highest (High , period) - Lowest (Low , period)) Of "spy"
&stoch1 := (Close - Lowest (Low , period)) / &range1
&stoch2 := (Close - Lowest (Low , period)) Of "spy" / &range2
&diff := &stoch1 - &stoch2
&range11 := Highest (&diff , period) - Lowest (&diff , period)
IFF (&range11 <> 0 , 100 * (&diff - Lowest (&diff , period)) / &range11 , 0)

STRESS FUNCTION RANGE 1
&range1 := Highest (High , period) - Lowest (Low , period)
&range2 := (Highest (High , period) - Lowest (Low , period)) Of "spy"
&stoch1 := (Close - Lowest (Low , period)) / &range1
&stoch1 * 100

STRESS FUNCTION RANGE 2
&range1 := Highest (High , period) - Lowest (Low , period)
&range2 := (Highest (High , period) - Lowest (Low , period)) Of "spy"
&stoch2 := (Close - Lowest (Low , period)) Of "spy" / &range2
&stoch2 * 100
CREATING A FUNCTION
To set up these indicators manually, click on the edit dropdown menu and open the trader’s toolbox (or use CTRL+T) and click on the functions tab. Next, click new and a “new function” dialog window will open. In its text box, input the code for one of the above indicators. Ensure there are no extra spaces at the end of each line. When this is completed, click on the verify button. You may be presented with an add inputs pop-up message if there are variables in the code. If so, click the yes button, then enter a value in the default value column. If all is well, when you click on the function tab, the code you entered will convert to italics. Finally, click the save button and type a name for the indicator.
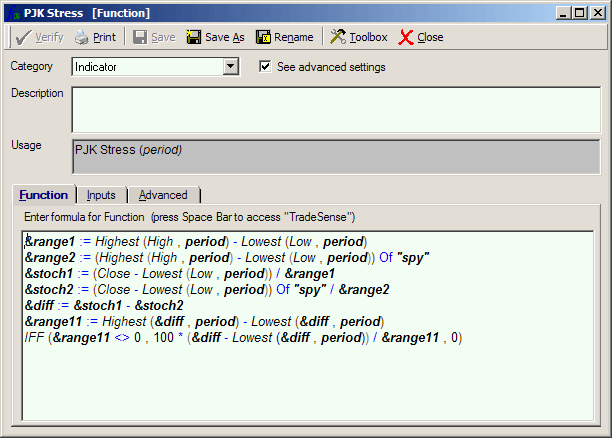
FIGURE 13: TRADE NAVIGATOR, INDICATOR RULES. This shows the rules for the PJK stress function.
EDITING A CHART
Once you have created the indicators, you can insert the indicators onto your chart by opening the charting dropdown menu, select the “add to chart” command, then on the indicators tab, find your named indicator, select it, and click on the “add” button. Repeat this procedure for the other indicators as well if you wish.
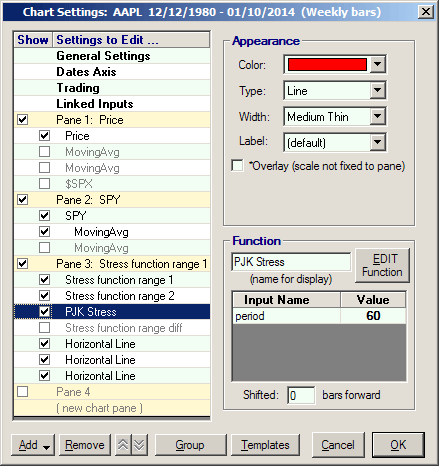
FIGURE 14: TRADE NAVIGATOR, CHART SETTINGS. Here is the chart settings window showing how to edit inputs.
If you need assistance with recreating the chart template settings discussed here, contact our technical support by clicking on the live chat tool located under Trade Navigator’s help menu and also near the top of our homepage, www.TradeNavigator.com, or call our technical support at (719) 884-0245 during our business hours. Happy trading!
—Robert Giacolono
Genesis Financial Technologies
719 884-0245, www.TradeNavigator.com
BACK TO LIST
MICROSOFT EXCEL: MARCH 2014
In “Timing The Market With Pairs Logic” in this issue, author Perry Kaufman shows an accessible approach to relative value arbitrage.
His stress indicator shows us when a given equity is oversold relative to the overall market as represented by the SPY (SPDR S&P 500). This is treated as a buy opportunity.
The stress indicator also shows when the equity no longer holds an advantage relative to the market. This is one of three possible exit triggers for the equity holdings.
Finally, Kaufman shows us a method that may be used to control overall risk by scaling into trades against the index as a hedge to the equity transaction (Figure 15).
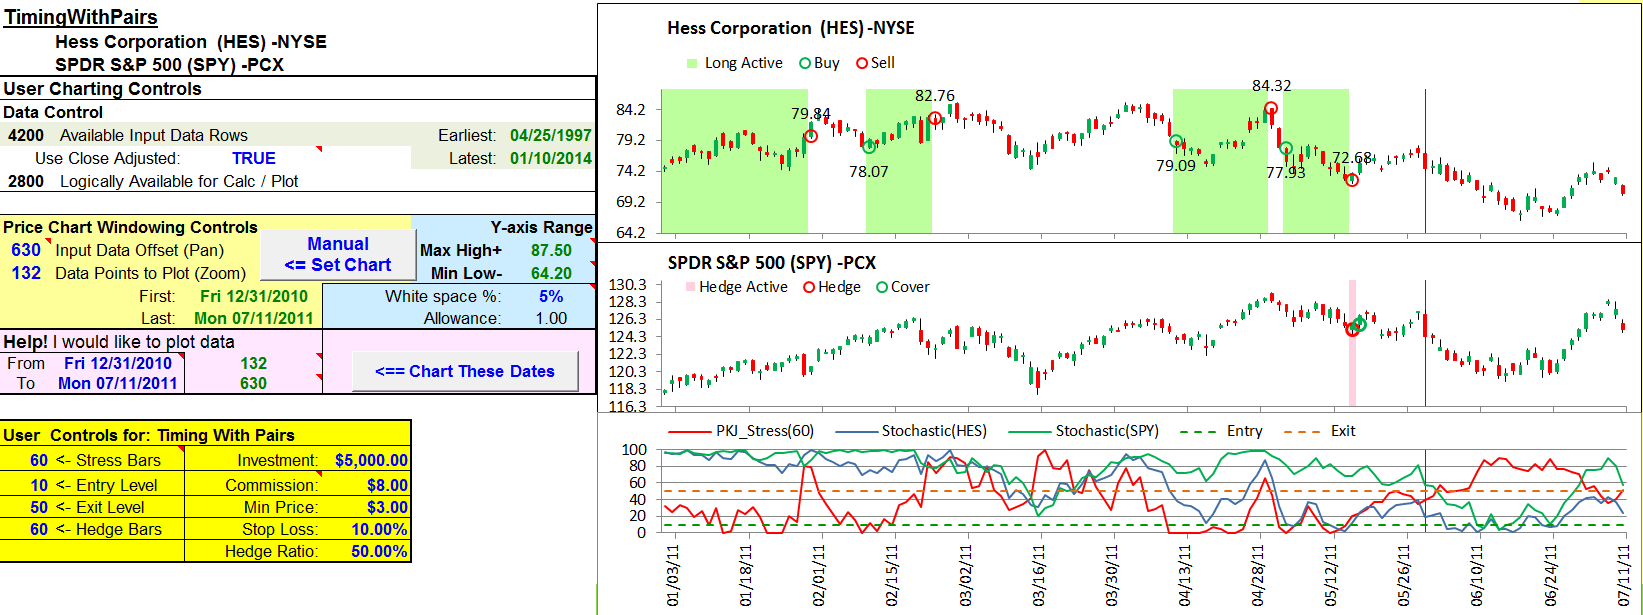
FIGURE 15: EXCEL, Profit & Loss. This view shows the stock, index, and hedged combination.
Figure 16 shows a sample chart illustrating the stress indicator plotted alongside the SPY and a sample stock (HES).
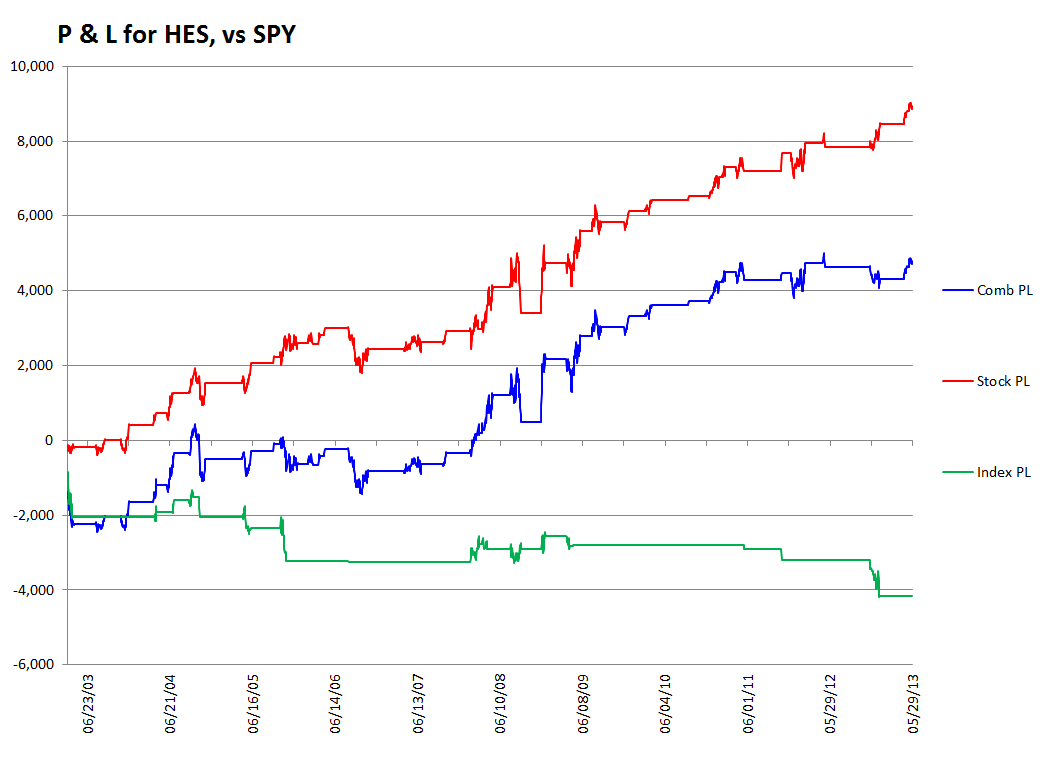
FIGURE 16: EXCEL, STRESS INDICATOR AND HES vs. spy. This chart shows the stress indicator for the pair HES vs. SPY.
The spreadsheet file for this Traders’ Tip can be downloaded here. To successfully download it, follow these steps:
- Right-click on the Excel file link, then
- Select “save as” to place a copy of the spreadsheet file on your hard drive.
—Ron McAllister
Excel and VBA programmer
rpmac_xltt@sprynet.com
BACK TO LIST
Originally published in the March 2014 issue of
Technical Analysis of Stocks & Commodities magazine.
All rights reserved. © Copyright 2014, Technical Analysis, Inc.


