TRADERS’ TIPS
April 2014

For this month’s Traders’ Tips, the focus is Melvin Dickover’s article in this issue, “Evidence-Based Support & Resistance.” Here we present the April 2014 Traders’ Tips code with possible implementations in various software.
Code for OmniTrader is already provided in Melvin Dickover’s article. Subscribers will find that code at the Subscriber Area of our website. (Click on “Article Code” from the S&C menu.) Presented here is an overview of possible implementations for other software.
Traders’ Tips code is provided to help the reader implement a selected technique from an article in this issue. The entries are contributed by various software developers or programmers for software that is capable of customization.

TRADESTATION: APRIL 2014
In “Evidence-Based Support & Resistance” in this issue, author Melvin Dickover introduces two new indicators to help traders note support and resistance areas by identifying supply and demand pools. Here, we present EasyLanguage code for the RelativeVolume and Freedom of Movement (FoM) indicators for TradeStation.
RelativeVolume (Indicator)

{
Reference: Technical Analysis of
Stocks & Commodities, Apr 2014.
Article: Evidence-Based Support & Resistance
Indicator Name : RelativeVolume
}

inputs:
	int Period( 60 ),
	double NumStdDevs( 2 ),
	int NormalVolumeColor( LightGray ),
	int VolumeSpikeColor( Black ),
	bool AllowNegativePlots( false ) ;
variables:
	double MyVolume( 0 ),
	double AvgVolume( 0 ),
	double StdDevVol( 0 ),
	double RelVolume( 0 ) ;

if BarType >= 2 and BarType < 5 then
	MyVolume = Volume
else
	MyVolume = 	Ticks ;

AvgVolume = Average( MyVolume, Period ) ;
StdDevVol = StdDev( MyVolume, Period ) ;

RelVolume = iff( StdDevVol <> 0 ,
( MyVolume - AvgVolume ) / StdDevVol, 0 ) ;

if AllowNegativePlots = false then
	RelVolume = MaxList( RelVolume, 0 ) ;

Plot1( RelVolume, "RelVolume" ) ;

if RelVolume > NumStdDevs then
	SetPlotColor( 1, VolumeSpikeColor )
else
	SetPlotColor( 1, NormalVolumeColor ) ;


FoM (Indicator)

{Reference: Technical Analysis
of Stocks & Commodities, Apr 2014.
Article: Evidence-Based Support & Resistance
Indicator Name : FoM
}
inputs:
	int Period( 60 ),
	double NumStdDevs( 2 ),
	int FoMBelowSdevColor( LightGray ),
	int FoMAboveSdevColor( Black ),
	bool AllowNegativePlots( false ) ;
variables:
	double MyVolume( 0 ),
	double AvgVolume( 0 ),
	double StdDevVol( 0 ),
	double RelVolume( 0 ),
	double AMove( 0 ),
	double TheMin( 0 ),
	double TheMax( 0 ),
	double TheMove( 0 ),
	double TheMinVol( 0 ),
	double TheMaxVol( 0 ),
	double TheVol( 0 ),
	double VByM( 0 ),
	double AvF( 0 ),
	double SdF( 0 ),
	double TheFoM( 0 )
	 ;

if BarType >= 2 and BarType < 5 then
	MyVolume = Volume
else
	MyVolume = 	Ticks ;


AMove = AbsValue( ( Close - Close[1] ) / Close[1] ) ;
TheMin = Lowest( AMove, Period ) ;
TheMax = Highest( AMove, Period ) ;

if ( TheMax - TheMin ) > 0 then
	TheMove = 1 + ( ( AMove - TheMin )
	* ( 10 - 1 ) ) / ( TheMax - TheMin ) ;

AvgVolume = Average( MyVolume, Period ) ;
StdDevVol = StdDev( MyVolume, Period ) ;
RelVolume = iff( StdDevVol <> 0 ,
( MyVolume - AvgVolume ) / StdDevVol, 0 ) ;

TheMinVol = Lowest( RelVolume, Period ) ;
TheMaxVol = Highest( RelVolume, Period ) ;

if ( TheMaxVol - TheMinVol ) > 0 then
	TheVol = 1 + ( ( RelVolume - TheMinVol )
	* ( 10 - 1 ) ) / ( TheMaxVol - TheMinVol ) ;

VByM = iff( TheMove <> 0, TheVol / TheMove , 0 ) ;
AvF = Average( VByM, Period ) ;
Sdf = StdDev( VByM, Period ) ;
TheFoM = iff( SdF <> 0, ( VByM - AvF ) / SdF, 0 ) ;

if AllowNegativePlots = false then
	TheFoM = MaxList( TheFom, 0 ) ;

Plot1( TheFoM, "FoM" ) ;

if TheFoM < NumStdDevs then
	SetPlotColor( 1, FoMBelowSdevColor )
else
	SetPlotColor( 1, FoMAboveSdevColor ) ;
To download the EasyLanguage code, please visit our TradeStation and EasyLanguage support forum. The code for this article can be found here: https://www.tradestation.com/TASC-2014. The ELD filename is “_TASC_EVIDENCEBASED_SR.ELD.”
For more information about EasyLanguage in general, please see https://www.tradestation.com/EL-FAQ.
A sample chart is shown in Figure 1.
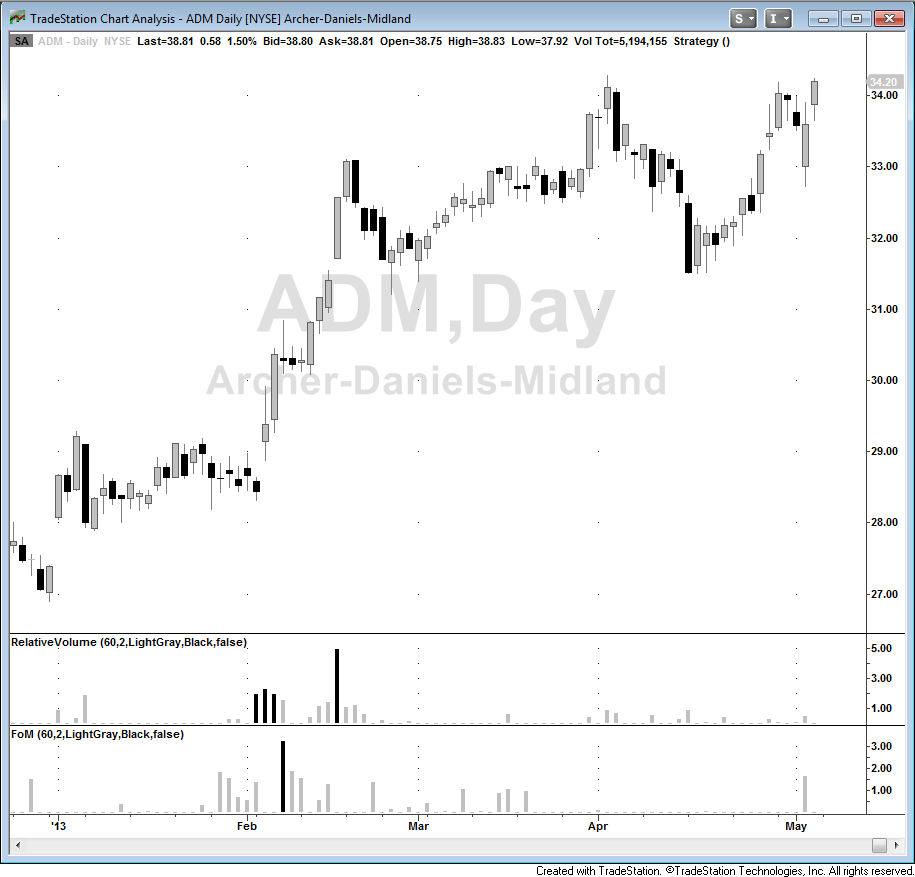
FIGURE 1: TRADESTATION. Here is a daily chart of ADM with the RelativeVolume and FoM indicators inserted.
This article is for informational purposes. No type of trading or investment recommendation, advice, or strategy is being made, given, or in any manner provided by TradeStation Securities or its affiliates.
—Doug McCrary
TradeStation Securities, Inc.
www.TradeStation.com
BACK TO LIST

METASTOCK: APRIL 2014
Melvin Dickover’s article in this issue, “Evidence-Based Support & Resistance,” introduces two new volume-based indicators. The MetaStock formulas for the indicators are as follows:
Relative volume indicator
x:= Input("Standard Deviation Periods", 5, 120, 60);
y:= Input("Number of Deviations", 0, 4, 2);
av:= Mov(V, x, S);
sd:= Std(V, x);
relVol:= (V-av)/sd;

If(relVol>y, relvol, 0);
If(relvol<=y, If(relvol>0,relvol, 0),0);

 Freedom of Movement (FoM) indicator
x:= Input("Standard Deviation Periods", 5, 120, 60);
y:= Input("Number of Deviations", 0, 4, 2);
av:= Mov(V, x, S);
sd:= Std(V, x);
relVol:= (V-av)/sd;
aMove:= Abs((C-Ref(C,-1))/Ref(C,-1));
theMin:= LLV(aMove,x);
theMax:= HHV(aMove,x);
denom:= If(theMax-theMin = 0, -1, theMax-theMin);
theMove:= 1 +((aMove-theMin)*(10-1))/Abs(denom);
MinV:= LLV(relVol,x);
MaxV:= HHV(relVol,x);
denomv:= If(MaxV-MinV = 0, -1, MaxV-MinV);
theVol:= 1 + ((relVol-MinV)*(10-1))/Abs(denomV);
vByM:= theVol/theMove;
avF:= Mov(vByM, x, S);
sdF:= Std(vByM, x);
theFoM:= (vByM-avF)/sdF;

If(theFoM>y, theFoM, 0);
If(theFoM<=y, If(theFoM>0, theFoM, 0),0);
The last two lines of both formulas allow them to be plotted on a chart in two colors. After plotting the indicator, you will see two lines. One at a time, select a line. Then use the color and style toolbars in the bottom-left corner of your MetaStock screen to change the line style to histogram. You can also change the color and weight (thickness) of the line.
—William Golson
MetaStock Technical Support
www.metastock.com
BACK TO LIST

THINKORSWIM: APRIL 2014
In “Evidence-Based Support & Resistance,” author Melvin Dickover describes how to find support and resistance areas by using more than just price levels. Dickover provides evidence for using volume-based price levels for identifying these classic technical analysis areas.
Based on the article, we have created two new studies for thinkorswim users in our proprietary scripting language, thinkScript. To load them, simply click on each of these links: https://tos.mx/yzefQi and https://tos.mx/sL8TVa. You can adjust their parameters within the edit studies window to fine-tune your variables.
In Figure 2, you see a three-month daily chart of Archer-Daniels Midland (ADM). We have drawn support and resistance levels on the price chart by using the logic described in Dickover’s article. In order to draw all necessary lines, click on the links, save each in thinkorswim, and rename them. The first link, https://tos.mx/yzefQi, should be renamed FreedomOfMovment or FoM and the second, https://tos.mx/sL8TVa, should be renamed RelativeVolumeStDev.
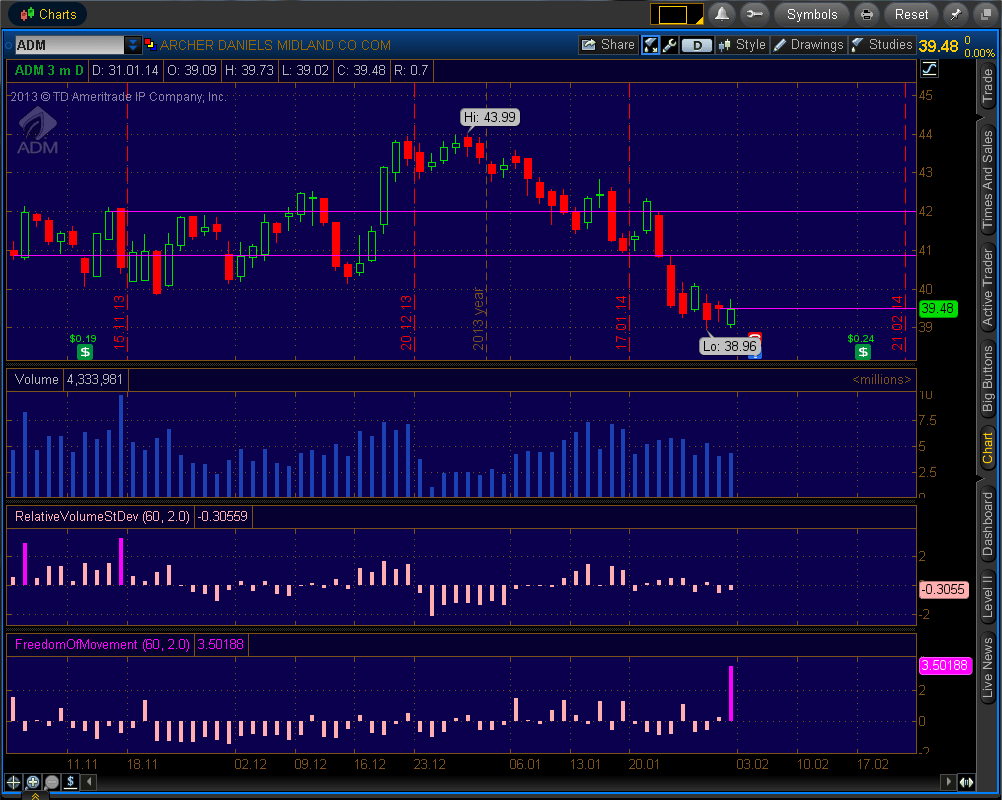
FIGURE 2: THINKORSWIM. Here is a sample three-month daily chart of Archer-Daniels Midland (ADM) with the relative volume and Freedom of Movement indicators in the lower panes.
Next, use the price level drawing tool, found in thinkorswim charts under the drawings menu at the top right, to draw your price levels based on the spikes on your studies. You can expand the chart area to show time to the right by clicking on style then settings and the time axis tab. Now your drawings are looking forward and displaying future support and resistance lines.
If you have questions or comments, please email us at support@thinkorswim.com and mention Technical Analysis of STOCKS & COMMODITIES magazine.
—thinkorswim
A division of TD Ameritrade, Inc.
www.thinkorswim.com
BACK TO LIST

WEALTH-LAB: APRIL 2014
In “Evidence-Based Support & Resistance” in this issue, author Melvin Dickover presents a new framework for discovering supply and demand pools and creating dependable support and resistance lines that claim to identify the prices where those pools are located on the chart. The underlying method is quite simple to grasp.
Because drawing the Defended Price Lines (DPLs) is to some extent a heuristic process, the example strategy plots the DPLs using a rudimentary algorithm: a line is drawn when either the relative volume or Freedom of Movement jumps two or more standard deviations away from the mean. We recommend using that only as a starting point, though. To avoid getting distracted by too many DPLs, pinpoint the most influential ones by considering such criteria as clustering behavior, strong momentum, and high volume.
To hide the complexity and make the process easier, the two new indicators (relative volume and Freedom of Movement) have been added to the Wealth-Lab TASCIndicators library. To execute the included sample code, Wealth-Lab users need to install (or update) the latest version of the TASCIndicators library from the extensions section of our website if they haven’t already done so, and restart Wealth-Lab.
C# Code

using System;
using System.Collections.Generic;
using System.Text;
using System.Drawing;
using WealthLab;
using WealthLab.Indicators;
using TASCIndicators;

namespace WealthLab.Strategies
{
	public class MyStrategy : WealthScript
	{
		protected override void Execute()
		{
			int period = 60;
			double d = 2;
			DataSeries relVol = Close*0; 	relVol.Description = "Relative Volume";
			DataSeries theFoM = Volume*0;	theFoM.Description = "Freedom of Movement";

			for(int bar = 0; bar < Bars.Count; bar++)
			{
				relVol[bar] = RelVol.Series(Bars,period)[bar] > 0 ? RelVol.Series(Bars,period)[bar] : 0;
				theFoM[bar] = FOM.Series(Bars,period)[bar] > 0 ? FOM.Series(Bars,period)[bar] : 0;
			}

			HideVolume();
			ChartPane r = CreatePane( 30,false,true );
			PlotSeries( r, relVol, Color.Black, LineStyle.Histogram, 3 );
			ChartPane f = CreatePane( 30,false,true );
			PlotSeries( f, theFoM, Color.Black, LineStyle.Histogram, 3 );

			for(int bar = 1; bar < Bars.Count; bar++)
			{
				if (relVol[bar] <= d)
					SetSeriesBarColor( bar, relVol, Color.DarkGray);
				if (theFoM[bar] < d)
					SetSeriesBarColor( bar, theFoM, Color.DarkGray);

				if (theFoM[bar] > d || relVol[bar] > d) // Draw DPLs
				{
					DrawLine(PricePane,bar,Close[bar],Bars.Count-1,Close[bar],Color.Blue,LineStyle.Solid,1);
				}
			}
		}
	}
}
A sample chart is shown in Figure 3.
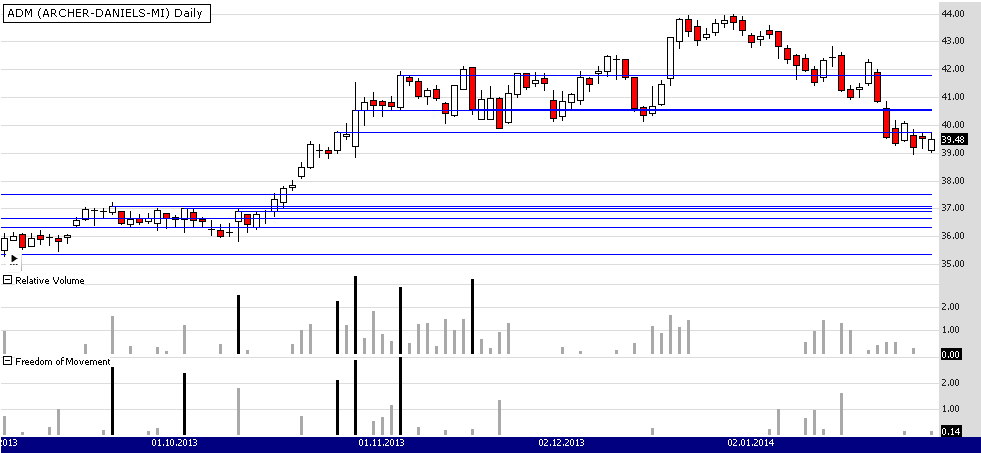
FIGURE 3: WEALTH-LAB. This sample Wealth-Lab 6 chart illustrates how the DPLs can be plotted following some of the rules from Melvin Dickover’s article in this issue. The DPLs are the blue lines on a daily chart of ADM. The relative volume and Freedom of Movement (FoM) indicators are plotted on the bottom pane for reference purposes.
—Wealth-Lab team
MS123, LLC
www.wealth-lab.com
BACK TO LIST

NEUROSHELL TRADER: APRIL 2014
The relative volume and Freedom of Movement indicators described by Melvin Dickover in his article in this issue, “Evidence-Based Support & Resistance.” can be easily implemented with a few of NeuroShell Trader’s 800+ indicators. Simply select “New indicator” from the Insert menu and use the indicator wizard to recreate the following indicators:
Relative Volume:	StndNormZScore( Volume,  PERIOD )

RelVol Significance:	A>B( Relative Volume, STDEVS )

FoM:	StndNormZScore( Divide(Add2( 1, Mult2( SimpleStoch%K( StndNormZScore(Volume,PERIOD), PERIOD), 0.09 ), Add2( 1, Mult2( SimpleStoch%K( abs( PercentChange(Close,1)), PERIOD), 0.09)), PERIOD)

FoM Significance:	A>=B( FoM, STDEVS )
Users of NeuroShell Trader can go to the Stocks & Commodities section of the NeuroShell Trader free technical support website to download a copy of this or any previous Traders’ Tips.
A sample chart is shown in Figure 4.
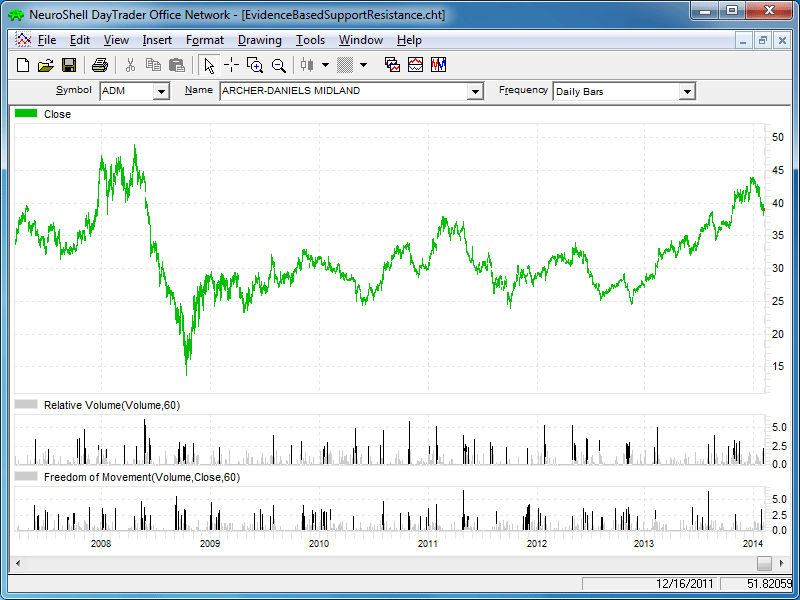
FIGURE 4: NEUROSHELL TRADER. This NeuroShell Trader chart displays the relative volume and Freedom of Movement indicators based on Melvin Dickover’s article in this issue.
—Marge Sherald, Ward Systems Group, Inc.
301 662-7950, sales@wardsystems.com
www.neuroshell.com
BACK TO LIST

AIQ: APRIL 2014
The AIQ code based on Melvin Dickover’s article in this issue, “Evidence-Based Support & Resistance,” can be found at https://www.TradersEdgeSystems.com/traderstips.htm.
The code provided there and also shown here will allow AIQ users to plot the two indicators presented by Dickover, the relative volume and Freedom of Movement (FoM) indicators, which are shown in Figure 5.
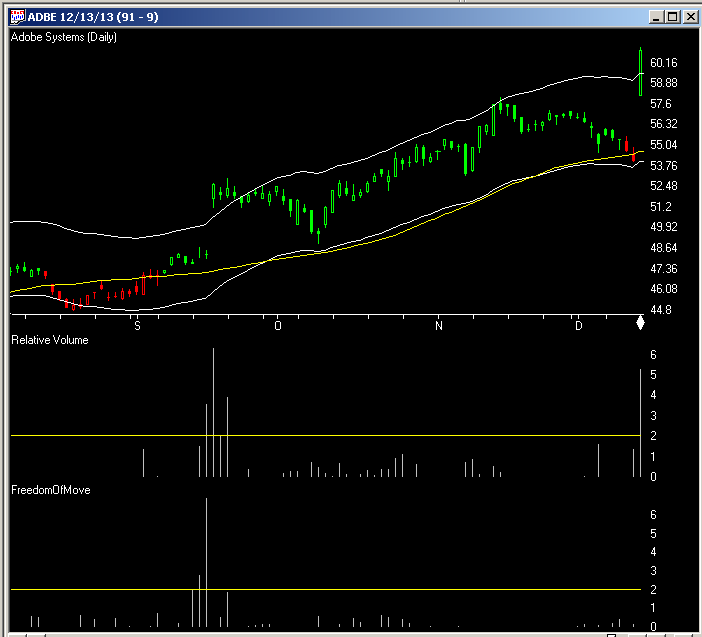
FIGURE 5: AIQ. Here is a sample plot of the relative volume and Freedom of Movement indicators on a chart of Adobe Systems (ADBE). The horizontal lines are set at two standard deviations.
!EVIDENCE-BASED SUPPORT & RESISTANCE
!Author: Melvin E. Dickover, TASC April 2014
!Coded by: Richard Denning, 2/5/2014
!www.TradersEdgeSystems.com

!INPUTS:
vLen is 60.
sdSigLvl is 2.

V is [volume].
C is [close].
C1 is valresult(C,1).

avgV is simpleavg(V,vLen).
sdV is sqrt(variance(V,vLen)).
rv is (V-avgV)/sdV.
rvi is iff(rv>0,rv,0).    !PLOT

aMove is abs((C-C1)/C1).
minM is lowresult(aMove,vLen).
maxM is highresult(aMove,vLen).
normM is 1+((aMove-minM)*(10-1))/(maxM-minM).

minV is lowresult(rv,vLen).
maxV is highresult(rv,vLen).
normV is 1+((rv-minV)*(10-1))/(maxV-minV).

vByM is normV/normM.
avgF is simpleavg(vByM,vLen).
sdF is sqrt(variance(vByM,vLen)).
FofM is (vByM-avgF)/sdF.
FofMI is iff(FofM>0,FofM,0).!PLOT
—Richard Denning
info@TradersEdgeSystems.com
for AIQ Systems
BACK TO LIST

TRADERSSTUDIO: APRIL 2014
The TradersStudio code based on Melvin Dickover’s article in this issue, “Evidence-Based Support & Resistance,” is provided at both of the following websites:
The following code files are provided in the download:
- Function MED_NORMALIZE: Returns a normalized value that can be used to make comparisons
- Function MED_RELATIVE_VOLUME: Returns the values for the relative volume indicator
- Function MED_FREEEDOM_MOVE: Returns the values from the Freedom of Movement (FoM) indicator
- Indicator MED_RELATIVE_VOLUME_IND: Indicator plot for the relative volume indicator
- Indicator MED_FREEDOM_MOVE_IND: Indicator plot for the Freedom of Movement (FoM) indicator
'EVIDENCE-BASED SUPPORT & RESISTANCE
'Author: Melvin E. Dickover, TASC April 2014
'Coded by: Richard Denning, 2/7/2014
'www.TradersEdgeSystems.com

'Normalizes input variable so that comparison can be made
Function MED_NORMALIZE(notN as bararray,lenN)
Dim norm As BarArray
If (Highest(notN,lenN)-Lowest(notN,lenN)) <> 0 Then
    norm = 1+((notN-Lowest(notN,lenN))*(10-1))/(Highest(notN,lenN)-Lowest(notN,lenN))
End If
MED_NORMALIZE = norm
End Function
'-----------------------------------------------
Function MED_RELATIVE_VOLUME(lenV)
Dim sdV As BarArray
Dim RV As BarArray
sdV = StdDev(V,lenV,0)
If sdV<>0 Then RV = (V-Average(V,lenV))/sdV
MED_RELATIVE_VOLUME = RV
End Function
'-----------------------------------------------
'Returns the Fredom Of Movement values
Function MED_FREEDOM_MOVE(vLen)
Dim normM As BarArray
Dim normV As BarArray
Dim vByM As BarArray
Dim avgF As BarArray
normM = MED_NORMALIZE(Abs(C/C[1]-1),vLen)
normV = MED_NORMALIZE(MED_RELATIVE_VOLUME(vLen),vLen)
If normM<>0 Then vByM = normV / normM
avgF = Average(vByM,vLen)
MED_FREEDOM_MOVE = (vByM-avgF)/StdDev(vByM,vLen)
End Function
'-----------------------------------------------
'Indicator plot for Relative Volume indicator
Sub MED_RELATIVE_VOLUME_IND(vLen)
Dim RV As BarArray
Dim RVI As BarArray
RV = MED_RELATIVE_VOLUME(vLen)
RVI = Max(RV,0)
plot1(RVI)
plot2(2)
'Print FormatDateTime(Date)," ",RVI
End Sub
'-----------------------------------------------
'Indicator plot for Freedom Of Movement indicator
Sub MED_FREEDOM_MOVE_IND(vLen)
Dim FoM As BarArray
Dim FoMI As BarArray
FoM = MED_FREEDOM_MOVE(vLen)
FoMI = max(FoM,0)
plot1(FoMI)
plot2(2)
'Print FormatDateTime(Date)," ",FoMI
End Sub
'------------------------------------------------
In Figure 6, I show Dickover’s two indicators, Freedom of Movement and relative volume, on a chart of Alaska Air (ALK). The horizontal lines are set at two standard deviations.
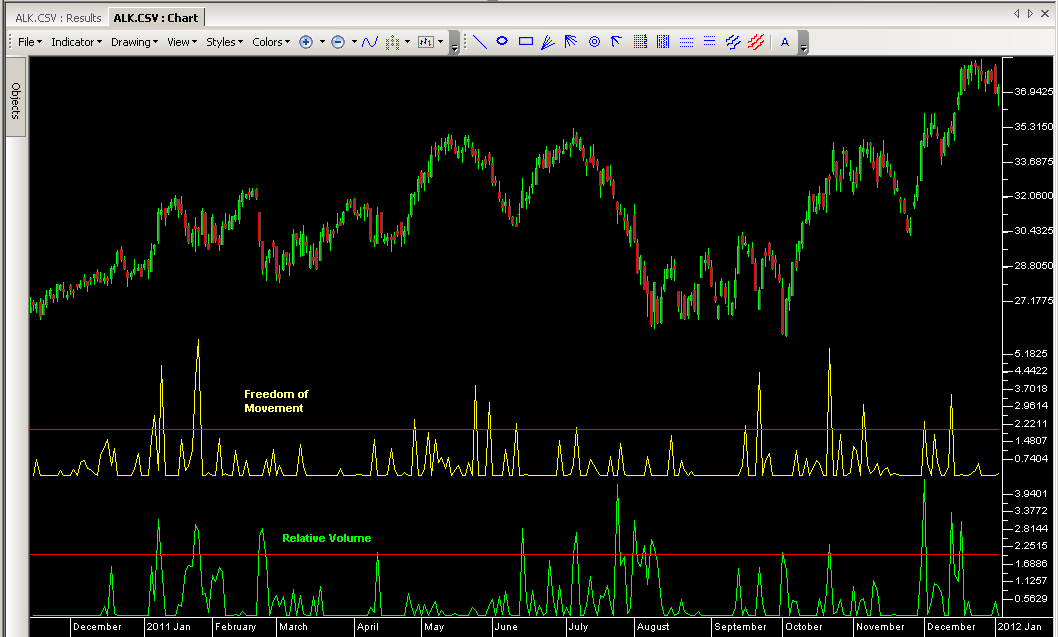
FIGURE 6: TRADERSSTUDIO. Here, the Freedom of Movement (yellow) and relative volume (green) indicators are shown on a chart of Alaska Air (ALK).
—Richard Denning
info@TradersEdgeSystems.com
for TradersStudio
BACK TO LIST

NINJATRADER: APRIL 2014
We have implemented the RelativeVolume and Freedom of Movement (FoM) indicators that are presented in Melvin Dickover’s article in this issue, “Evidence-Based Support & Resistance.” These indicators are available for download at www.ninjatrader.com/SC/April2014SC.zip.
Once they have been downloaded, from within the NinjaTrader Control Center window, select the menu File → Utilities → Import NinjaScript and select the downloaded file. This file is for NinjaTrader version 7 or greater.
You can review both indicators’ source code by selecting the menu Tools → Edit NinjaScript → Strategy from within the NinjaTrader Control Center window and selecting the RelativeVolume and FoM files.
A sample chart implementing the strategy is shown in Figure 7.
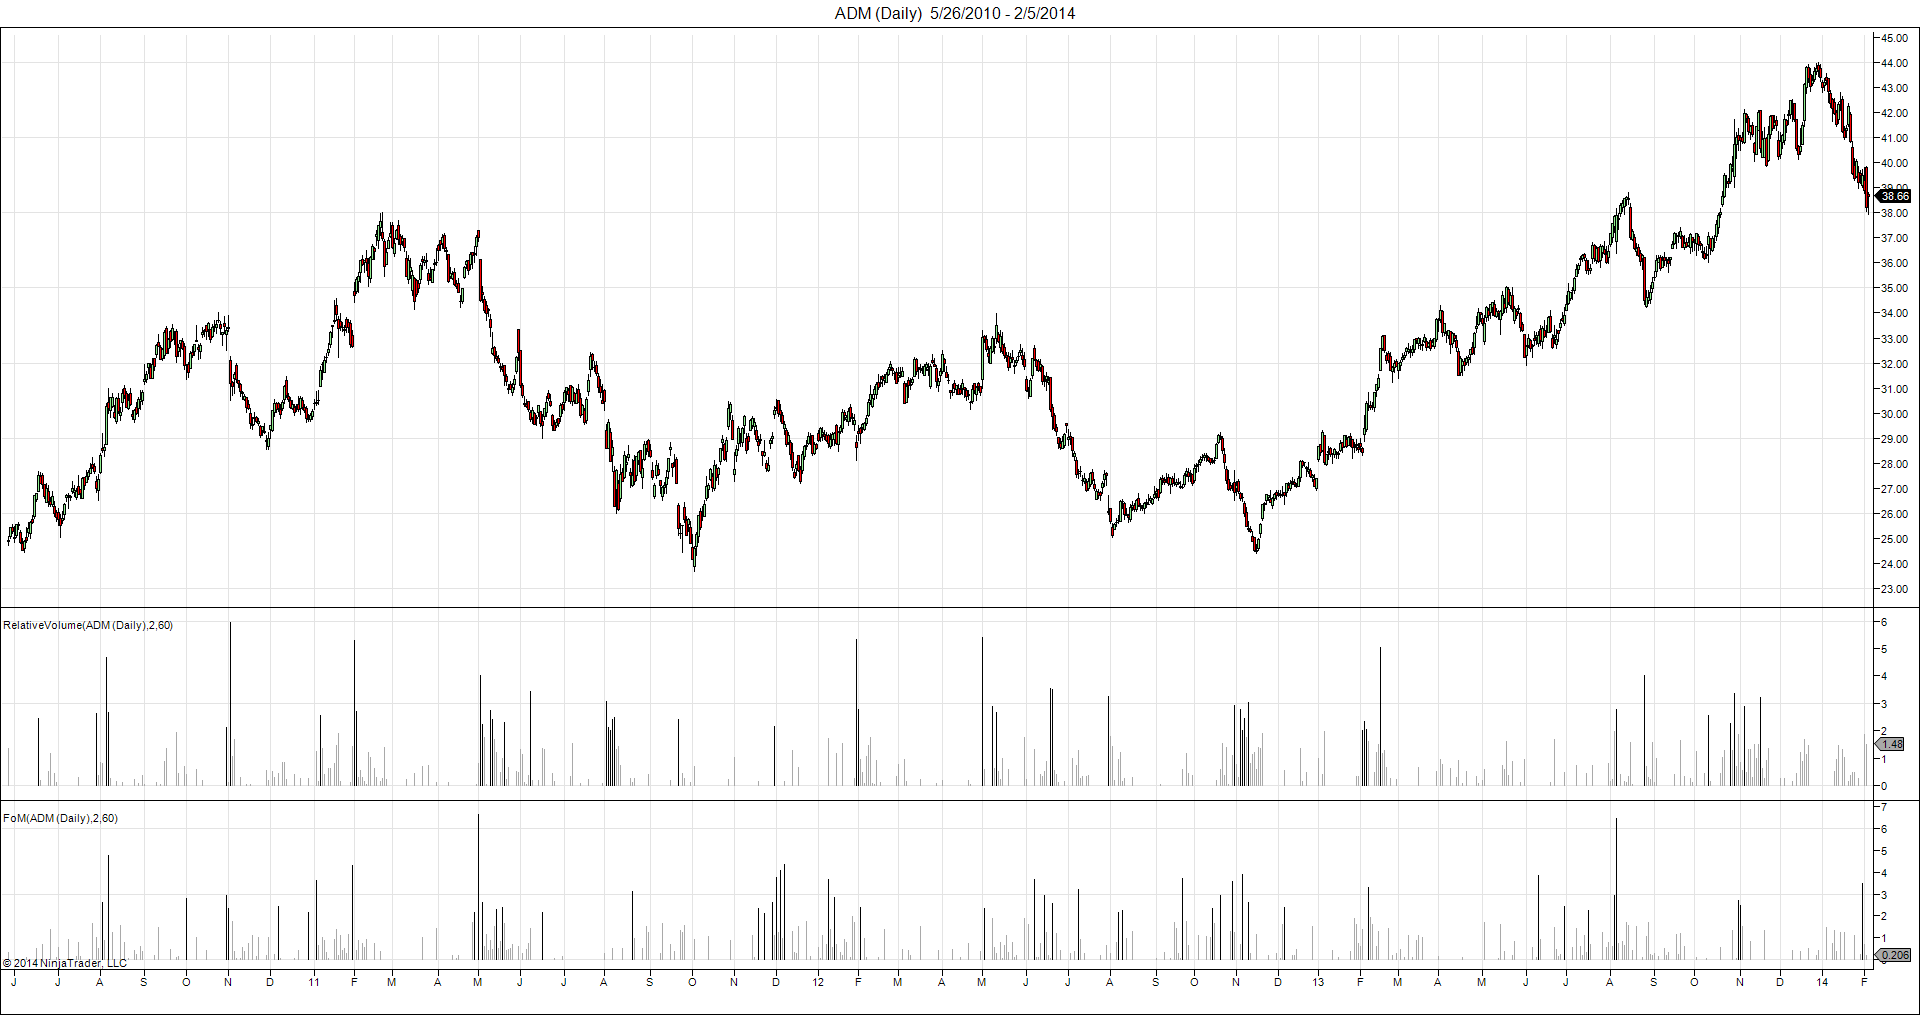
FIGURE 7: NINJATRADER. This screenshot shows the RelativeVolume and FoM indicators applied to a daily chart of Archer-Daniels Midland (ADM) stock.
—Raymond Deux & Brandon Sutrina
NinjaTrader, LLC
www.ninjatrader.com
BACK TO LIST

UPDATA: APRIL 2014
This Traders’ Tip is based on Melvin Dickover’s article in this issue, “Evidence-Based Support & Resistance.”
The author develops two indicators based on price and volume behavior to better determine support and resistance lines. The first is a relative volume indicator, which identifies large-volume days, illustrated with a black bar in an otherwise gray histogram. The second is the Defended Price Line (DPL).Updata has slightly extended the article by adding rules for the additional DPL, plotted at the close price after a cluster of large-volume black bars.
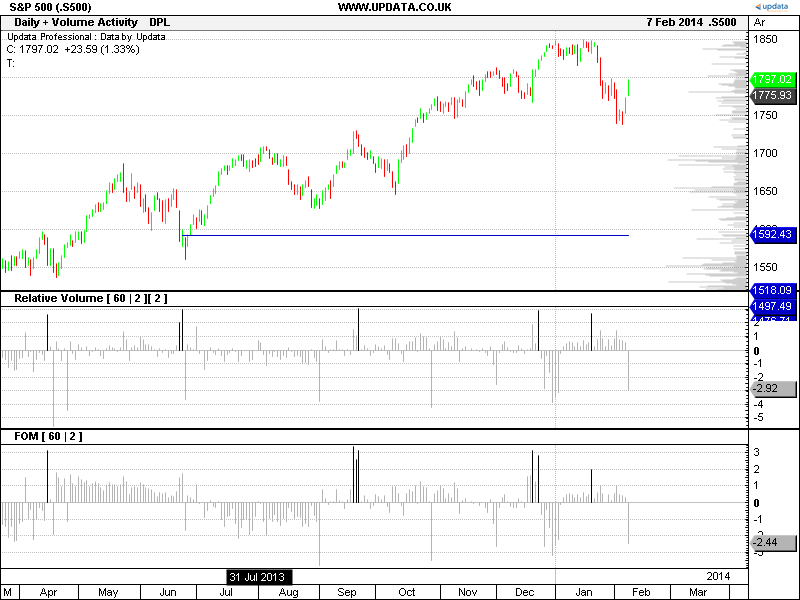
FIGURE 8: UPDATA. Here, the relative volume [60|2] and Freedom of Movement [60|2] indicators are applied to daily S&P 500 index data. The DPLs are drawn with relative volume clusters of size 2.
The second colored histogram (Figure 8) is Dickover’s Freedom of Movement (FoM) indicator, which seeks to identify when price movement has suddenly become restricted by comparing a price move to volume change over a period.
The Updata code for this article is in the Updata Library and may be downloaded by clicking the custom menu and indicator library. Those who cannot access the library due to a firewall may paste the code shown below into the Updata custom editor and save it.
'Relative Volume (Cluster)
PARAMETER "Period" #PERIOD=60
PARAMETER "Std. Dev." @STDDEV=2
PARAMETER "Cluster Size" #CLUSTER=3
NAME "DPL" ""
NAME2 "Relative Volume [" #PERIOD "|" @STDDEV "][" #CLUSTER "]" ""
DISPLAYSTYLE 2LINES
INDICATORTYPE TOOL
INDICATORTYPE2 CHART
PLOTSTYLE2 HISTOGRAM
@AVGVOL=0
@STDDEVVOL=0
@RELATIVEVOL=0
#DISTANCE=0
@VOLTHRESH=0
@VOLTHRESHSUM=0
@CLUSTERFOUND=0
FOR #CURDATE=#PERIOD TO #LASTDATE
   @AVGVOL=SGNL(VOL,#PERIOD,M)
   @STDDEVVOL=STDDEV(VOL,#PERIOD)
   @RELATIVEVOL=(VOL-@AVGVOL)/@STDDEVVOL
   #DISTANCE=#LASTDATE-#CURDATE
   '=1 If Relative Vo greater then Std. Dev. Parameter,=0 otherwise
   @VOLTHRESH=@RELATIVEVOL>@STDDEV
   @VOLTHRESHSUM=SGNL(@VOLTHRESH,#CLUSTER,M)*#CLUSTER
   'Tests if condition met for cluster definition by summing variable
   @CLUSTERFOUND=0
   IF @VOLTHRESHSUM>=#CLUSTER
      @CLUSTERFOUND=1
   ENDIF
   'Plot Relative Vol Histogram
   IF @RELATIVEVOL>@STDDEV
      @PLOT2=@RELATIVEVOL
      COLOUR2 RGB(0,0,0)
   ELSE
      @PLOT2=@RELATIVEVOL
      COLOUR2 RGB(180,180,180)
   ENDIF
   'Plot DPL if more at least '3' black bars clustered consecutively
   IF @CLUSTERFOUND=1
      COLOUR RGB(0,0,200)
      DRAWLINE 0,CLOSE,-#DISTANCE,CLOSE
   ENDIF
NEXT

'Freedom Of Movement
PARAMETER "Period" #PERIOD=60
PARAMETER "Std. Dev." @STDDEV=2
DISPLAYSTYLE LINE
INDICATORTYPE CHART
PLOTSTYLE HISTOGRAM
NAME "FOM [" #PERIOD "|" @STDDEV "]" ""
@MOVE=0
@MINMOVE=0
@MAXMOVE=0
@AVERAGEMOVE=0
@STDDEVVOL=0
@AVERAGEVOL=0
@RELATIVEVOLUME=0
@MAXVOLUME=0
@MINVOLUME=0
@VOL=0
@VOLUMEBYMOVE=0
@AVGVOLUMEBYMOVE=0
@AVERAGEFREEDOM=0
@STDDEVFREEDOM=0
@FOM=0
FOR #CURDATE=#PERIOD TO #LASTDATE
    'Movement
    @MOVE=ABS((CLOSE-CLOSE(1))/CLOSE)
    @MAXMOVE=PHIGH(@MOVE,#PERIOD)
    @MINMOVE=PLOW(@MOVE,#PERIOD)
    IF (@MAXMOVE-@MINMOVE)>0
       @MOVE=1+((@MOVE-@MINMOVE)*(10-1))/(@MAXMOVE-@MINMOVE)
    ENDIF
    'Compute Relative Volume
    @AVERAGEVOL=SGNL(VOL,#PERIOD,M)
    @STDDEVVOL=STDDEV(VOL,#PERIOD)
    @RELATIVEVOLUME=(VOL-@AVERAGEVOL)/@STDDEVVOL
    @MAXVOLUME=PHIGH(@RELATIVEVOLUME,#PERIOD)
    @MINVOLUME=PLOW(@RELATIVEVOLUME,#PERIOD)
    IF (@MAXVOLUME-@MINVOLUME)>0
       @VOL=1+((@RELATIVEVOLUME-@MINVOLUME)*(10-1))/(@MAXVOLUME-@MINVOLUME)
    ENDIF
    'Compute Freedom of Movement in StdDevs
    @VOLUMEBYMOVE=@VOL/@MOVE
    @AVERAGEFREEDOM=SGNL(@VOLUMEBYMOVE,#PERIOD,M)
    @STDDEVFREEDOM=STDDEV(@VOLUMEBYMOVE,#PERIOD)
    @FOM=(@VOLUMEBYMOVE-@AVERAGEFREEDOM)/@STDDEVFREEDOM
    IF @FOM<@STDDEV
       @PLOT=@FOM
       COLOUR RGB(180,180,180)
    ELSE
       @PLOT=@FOM
       COLOUR RGB(0,0,0)
    ENDIF
NEXT
—Updata support team
support@updata.co.uk
www.updata.co.uk
BACK TO LIST
MICROSOFT EXCEL: APRIL 2014
In his article in this issue, “Evidence-Based Support & Resistance,” author Melvin Dickover provides two new indicators that point out locations of possible support and resistance. With these indicators and a simple set of rules, Dickover determines initial support or resistance levels, which he manually plots as Defended Price Lines (DPLs).
Since the indicators show repeated support and resistance levels that tend to cluster near the same levels, Dickover adjusts his DPL up or down to reflect this new confirming information with a single best-fit for the apparent localized support or resistance level.
What you see in my Figure 9 is the same data that’s shown in Figure 1 of Dickover’s article. I have used the heuristics described in his article to have Excel set the DPLs.
As you can see, there are lots of them. Many originate off the chart to the left. The darker areas show critical price point confirmation by way of the closely located DPLs.
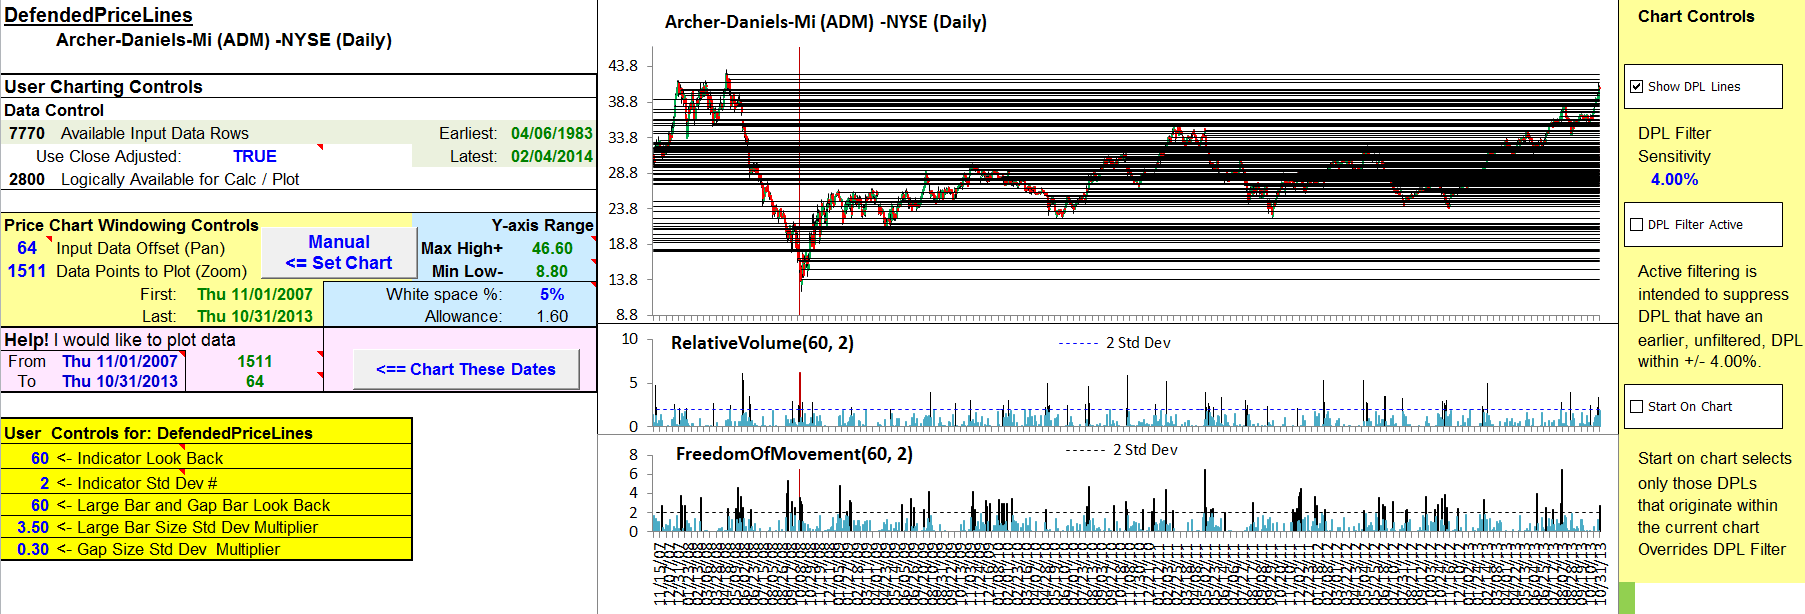
FIGURE 9: EXCEL, ACTIVE FILTER. Use the active filter to remove some of the cluster clutter.
Figure 10 shows the results of one filtering method that can “thin the herd” a bit by suppressing the plot of DPLs whose levels are within a user-specified tolerance proximity of older, already displayed DPLs. The method I used is not as precise as I would like, so some clutter remains.
An Excel limitation on the maximum number of series per chart (256) causes some interesting things to happen on the chart. In Figure 10, the active filter has eliminated some of the clutter shown in the upper-right part of Figure 9. This made room within the series limitation for some older-origination DPLs to appear in Figure 10. Compare the DPLs that run through the sharp valley formation near the vertical cursor.
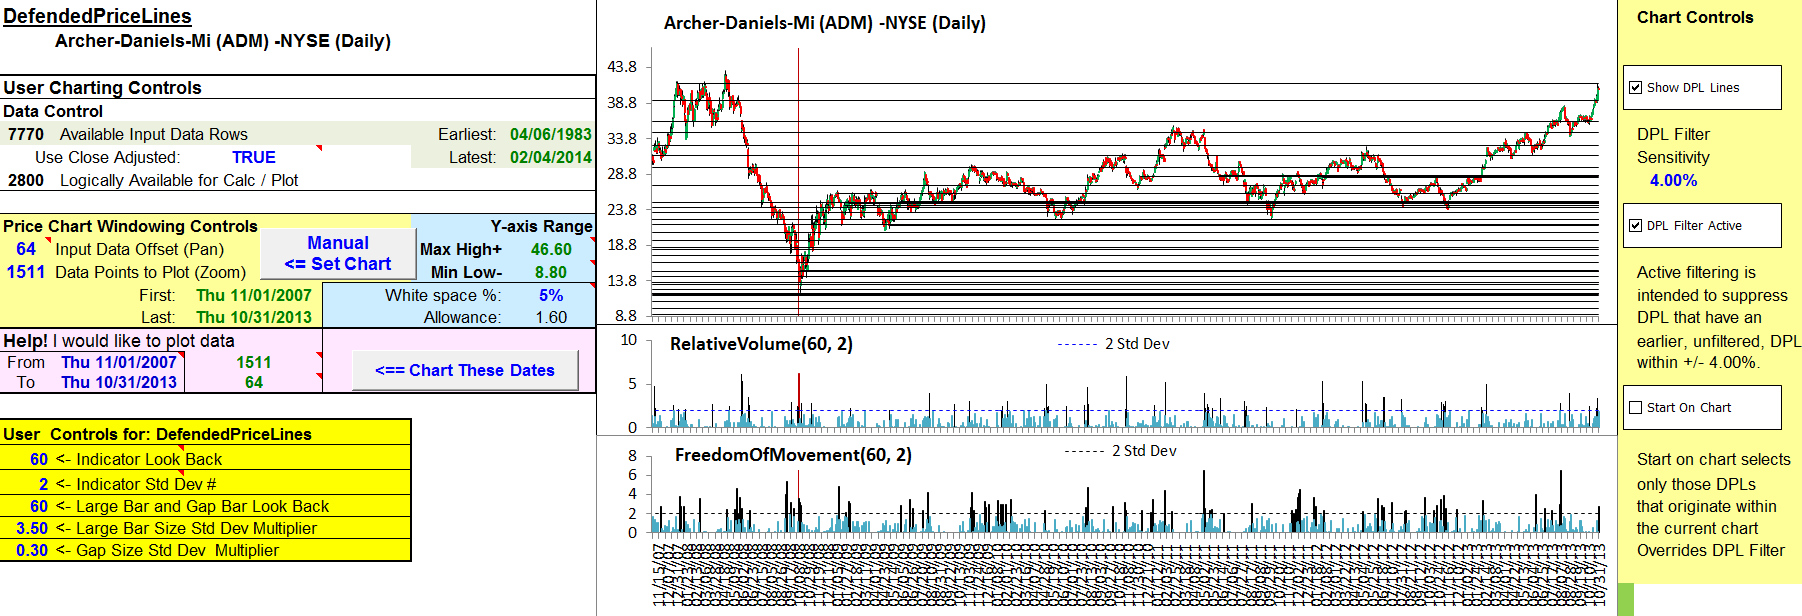
FIGURE 10: EXCEL, Defended Price Lines (DPLs). Here, we show only those DPLs that originate within the current chart specifications.
Figure 11 does a better job of approximating Figure 1 from Dickover’s article by restricting the display to DPLs that originate on the visible area of the chart. This version still gets congested as we move to the right. But it also makes clear the sort of manual DPL-level selections and adjustments that Dickover had to perform to arrive at his much-less cluttered Figure 1.
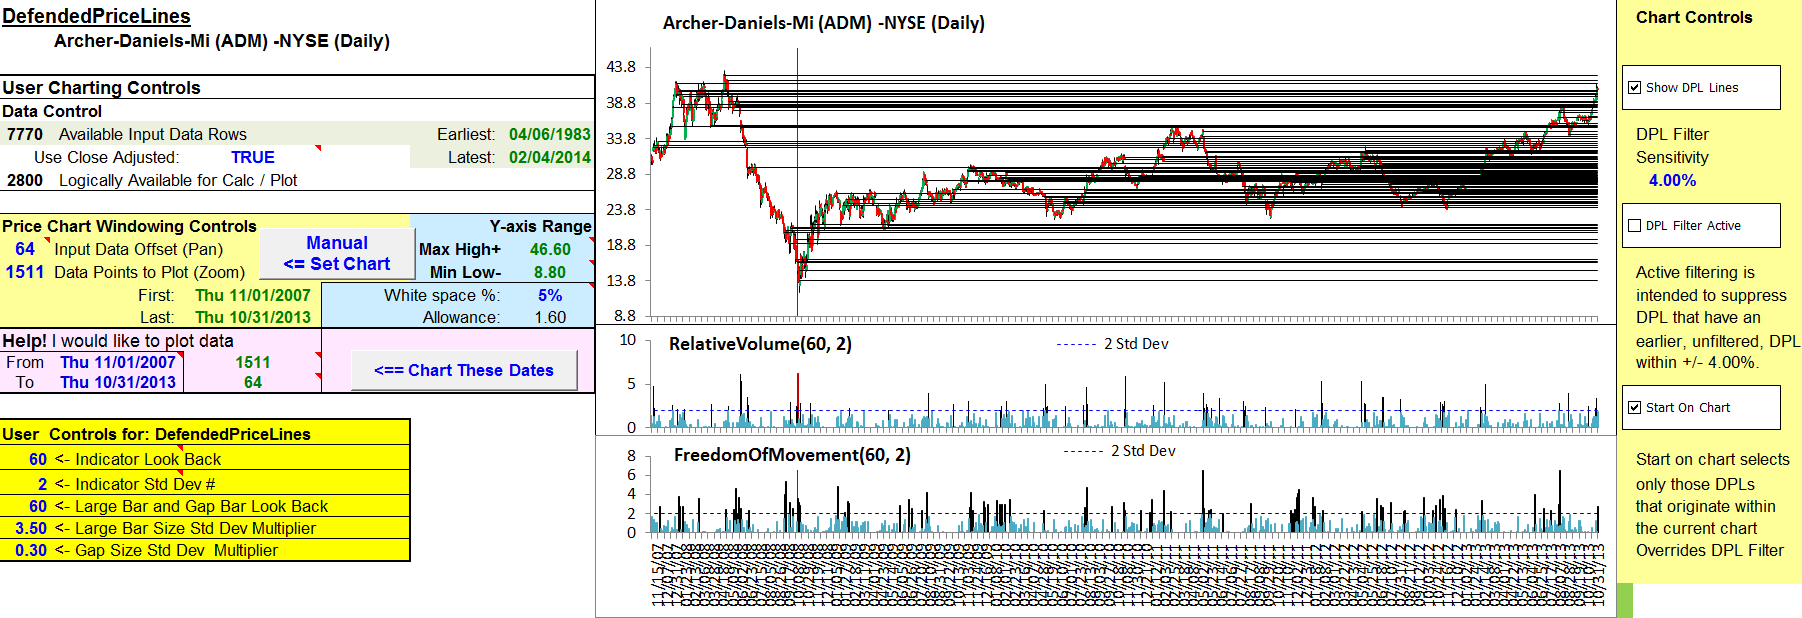
FIGURE 11: EXCEL, FREEDOM OF MOVEMENT AND DPLs. Volume and the FoM indicators are displayed with automatically generated DPLs.
Under the heading of user friendly, I have added a follow tab to my Traders’ Tips Excel template.
Simply enter a list of Yahoo! Finance–acceptable symbols in column A of the follow tab. Then you can double-click on one of these symbols to automatically initiate data retrieval by way of the InputPriceData tab. Any time you retrieve data for a symbol listed on the follow tab, that row of the follow tab will be updated to record a last trade entry with time stamp. (See the notes on the follow tab.)
The spreadsheet file for this Traders’ Tip can be downloaded here (NOTE: corrected version, posted 04-21-14). To successfully download it, follow these steps:
- Right-click on the Excel file link, then
- Select “save target as” to place a copy of the spreadsheet file on your hard drive.
—Ron McAllister
Excel and VBA programmer
rpmac_xltt@sprynet.com
BACK TO LIST
Originally published in the April 2014 issue of
Technical Analysis of Stocks & Commodities magazine.
All rights reserved. © Copyright 2014, Technical Analysis, Inc.


