TRADERS’ TIPS
May 2014

For this month’s Traders’ Tips, the focus is Donald W. Pendergast Jr.’s article in the 2014 Bonus Issue of Stocks & Commodities, “A Trading Method For The Long Haul.” Here we present the May 2014 Traders’ Tips code with possible implementations in various software.
The 2014 Bonus Issue of Stocks & Commodities magazine was mailed to paid subscribers in late February 2014. To get a copy of the Bonus Issue, you can become a subscriber to Stocks & Commodities magazine by visiting Traders.com or calling 800-TECHNICAL (800 832-4642).
Traders’ Tips code is provided to help the reader implement a selected technique from a selected article in this magazine. The entries are contributed by various software developers or programmers for software that is capable of customization.

TRADESTATION: MAY 2014
In “A Trading Method For The Long Haul” which appeared in the 2014 Bonus Issue of Stocks & Commodities, author Donald W. Pendergast Jr. discusses a method for selecting equities for possible trades. He then provides a set of rules for entering and exiting trades.
The author demonstrates a screening method using TradeStation’s RadarScreen, which allows you to monitor up to 2,000 symbols in real time. The indicators he shows are all built in analysis techniques that are included with the TradeStation platform. As an alternative, the trader could use the TradeStation Scanner to search an even broader range of symbols.
We are providing the strategy code for the author’s entry and exit rules. In addition to backtesting the strategy in a TradeStation chart, remember that you can use TradeStation’s Portfolio Maestro product to quickly backtest on a portfolio of symbols of your choice.
To download the EasyLanguage code, please visit our TradeStation and EasyLanguage support forum. The code for this technique can be found here: https://www.tradestation.com/TASC-2014. The ELD filename is “_TASC_LongHaul.ELD.” (The code is also shown below.)
inputs:
	NumBarsForTrail( 3 ),
	EMALength( 6 ),
	EMAFilterLength( 200 ),
	RSILength( 2 ),
	RSIOverSoldLevel( 5 ),
	RSIOverBoughtLevel( 95 ) ;

variables:
	RSIValue( 0 ),
	EMAFastValue( 0 ),
	EMAFilterOK( false ),
	ReversalOK( false ) ,
	RSISetUpOK( false ),
	MP( 0 )	;

MP = MarketPosition ;
RSIValue = RSI( Close, RSILength ) ;
EMAFastValue = XAverage( Close, EMALength ) ;

EMAFilterOK = Close >
	XAverage( Close, EMAFilterLength ) ;
ReversalOK = High < High[1]
	and Close < Open and Close[1] < Open[1] ;

if MP = 0 and RSIValue < RSIOverSoldLevel then
	RSISetUpOK = true
else if MP = 1 or RSIValue > RSIOverBoughtLevel then
	RSISetUpOK = false ;


if RSISetUpOK and ReversalOK and EMAFilterOK then
	Buy next bar at High + MinMove / PriceScale Stop ;

if MP = 1 then
begin
	Sell ( "3B Trail" )next bar
		at Lowest( Low[1], 3 ) Stop ;
	if Close crosses under EMAFastValue then
		Sell ( "EMA Cross" )next bar at Market ;
	end ;
For more information about EasyLanguage in general, please see https://www.tradestation.com/EL-FAQ.
A sample chart is shown in Figure 1.
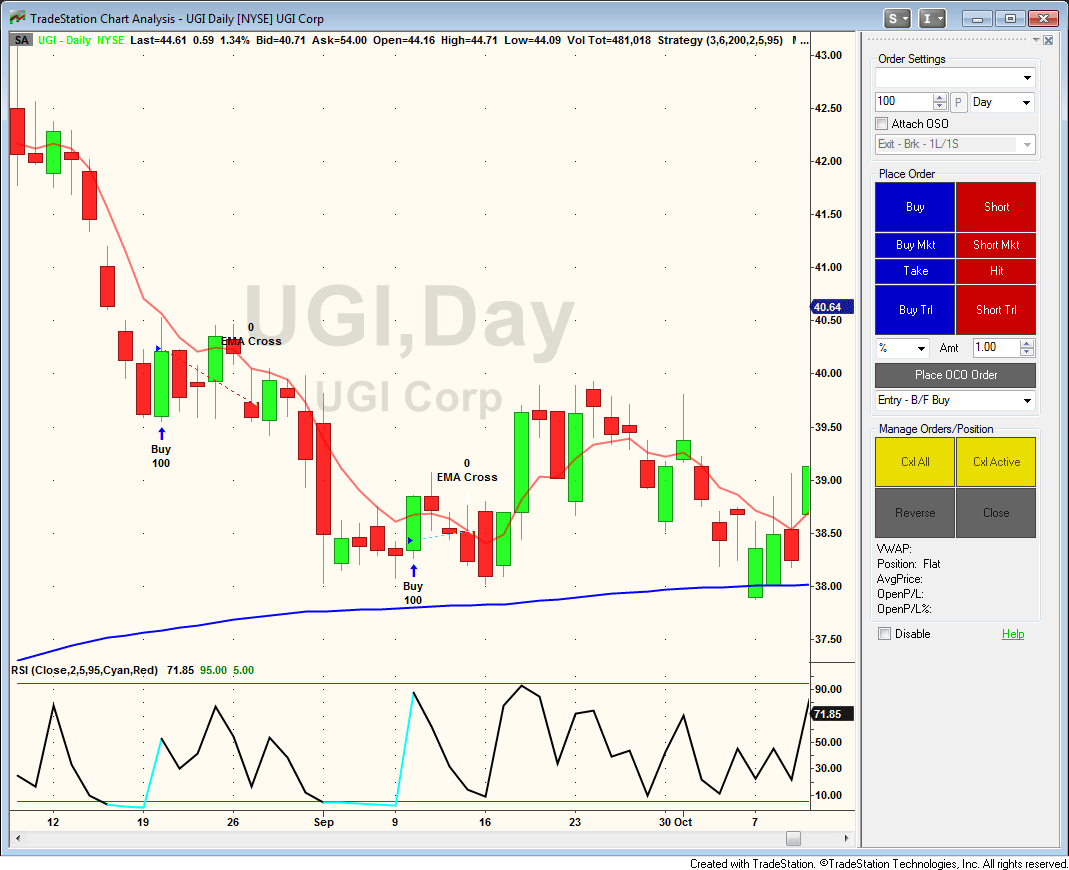
FIGURE 1: TRADESTATION. This chart shows Donald Pendergast’s strategy applied to a daily chart of UGI along with the six- and 200-period exponential moving averages and two-period RSI indicators.
This article is for informational purposes. No type of trading or investment recommendation, advice, or strategy is being made, given, or in any manner provided by TradeStation Securities or its affiliates.
—Doug McCrary
TradeStation Securities, Inc.
www.TradeStation.com
BACK TO LIST

THINKORSWIM: MAY 2014
In “A Trading Method For The Long Haul,” which appeared in the 2014 Bonus Issue of Stocks & Commodities, author Donald W. Pendergast Jr. serves up a model that is “dirt-simple,” per his own words. One of the hardest parts of trading is staying disciplined. That is why a simple trading model like the one described in Pendergast’s article is perfect for many investors.
At thinkorswim, we make the loading process easy. Simply click on the link https://tos.mx/fIH5JZ and choose backtest. You can adjust the parameters within the edit studies window to fine-tune your variables.
The chart in Figure 2 shows the entry and exit point when the criteria described in the article was met (based on the RSI, volume average, and beta.) In thinkorswim, backtesting is done with a tool called strategies. The link mentioned earlier will save the strategy for you. Then you will have the ability to load the strategy and begin backtesting.
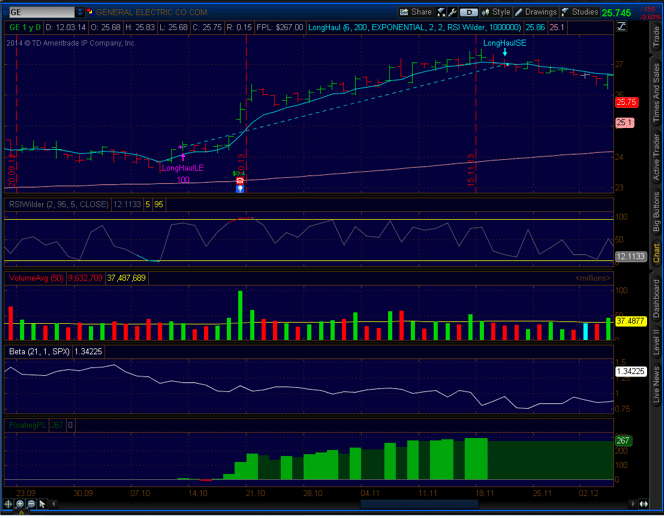
FIGURE 2: THINKORSWIM. The chart shows the entry and exit point when the criteria described in Donald Pendergast’s article in the 2014 Bonus Issue was met (based on RSI, volume average, and beta.)
Pendergast’s article also discusses scanning for stocks that meet his defined criteria. Don’t worry — thinkorswim has you covered there as well. Just click the following link to load his predefined scan: https://tos.mx/WE2FzG. Now you can backtest your known stocks as well as find new ones that meet this model’s criteria, all with a couple of clicks. Happy swimming!
—thinkorswim
A division of TD Ameritrade, Inc.
www.thinkorswim.com
BACK TO LIST

WEALTH-LAB: MAY 2014
It’s usually interesting to see if there’s added benefit from including non-price information such as fundamental items or sentiment data into a system’s rules. In addition to having an intermarket filter (beta), the system featured in Donald W. Pendergast’s article that appeared in the 2014 Bonus Issue of Stocks & Commodities (“A Trading Method For The Long Haul”) puts emphasis on beating a stock’s most recent quarterly earnings estimates as one of the key elements. To be able to backtest its rules and generate signals for live trading, Wealth-Lab customers should use one of the fundamental data sources that provides access to earnings-surprise data, for example, 99WallStreet.com, for which a fundamental provider already exists.
The strategy we’re using to illustrate the trading method adheres to Pendergast’s bullet-point list of entry criteria with one exception: It’s not required for a stock to have a strong history of positive earnings surprises over the last couple of years, as that would limit the number of signals to a mere handful. To enter, the system would scout for stocks where the five technical, intermarket, and fundamental conditions are in place, and then wait while a stock’s two-day RSI crosses above 5 from oversold territory. As we found the proposed exit strategy triggering too many false signals, not allowing the system to operate to its full potential, we replaced it with a simple trailing exit at a 20-day stop of the daily lows (Figure 3).
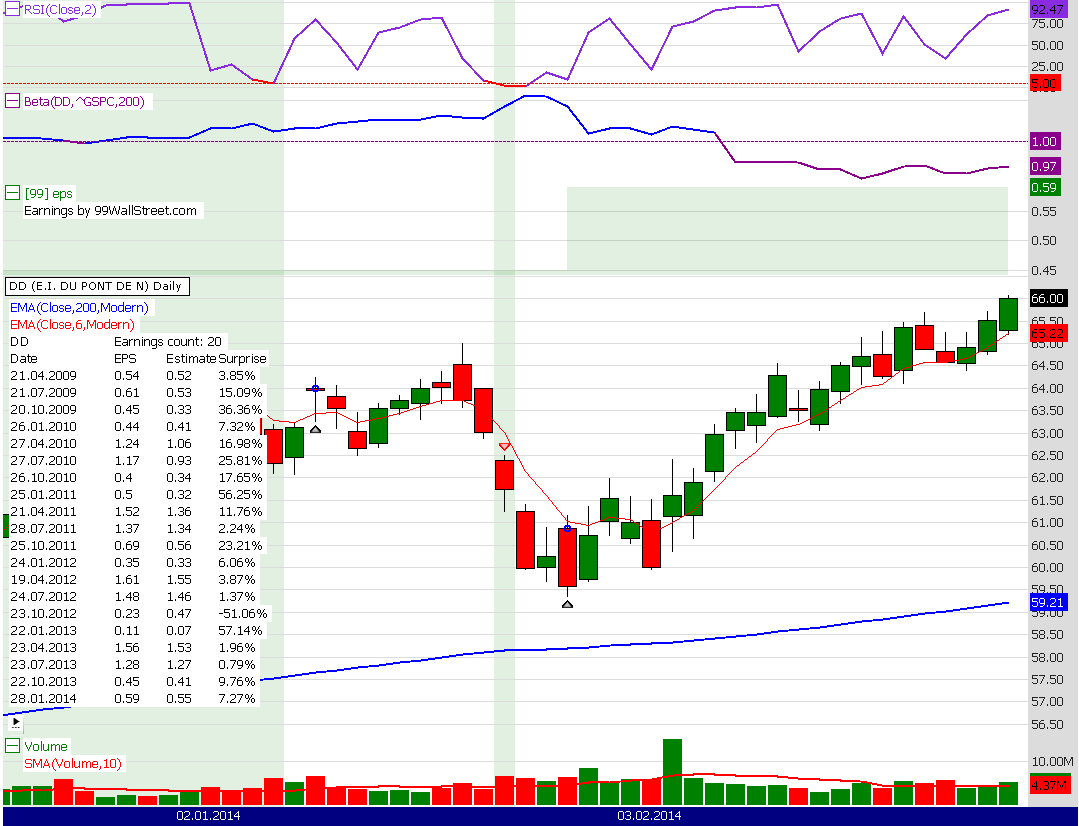
FIGURE 3: WEALTH-LAB. This Wealth-Lab 6 chart shows the application of the fundamental and technical rules from Donald Pendergastís article in the 2014 Bonus Issue on a daily chart of DD (Dupont). The upper pane shows the two-day RSI, below that is the 200-day beta indicator, on top of price there are historical quarterly earnings releases, and volume with average 10-day volume are at the bottom.
There are two prerequisites to successfully execute the included strategy in Wealth-Lab:
- Install the Community Indicators library to build the beta indicator
- Install 99WallStreet fundamental data provider and download the earnings surprise data for your DataSet.
Latest versions of both libraries are available to registered Wealth-Lab customers for download from the extensions section of our website (restart Wealth-Lab after installation or update).
The code listing is also shown below.
C# Code

using System;
using System.Collections.Generic;
using System.Text;
using System.Drawing;
using WealthLab;
using WealthLab.Indicators;
using Community.Indicators;

namespace WealthLab.Strategies
{
	public class TASC201405Pendergast : WealthScript
	{
		protected override void Execute()
		{
			const char tab = '\u0009';
			string item = "[99] eps";
			IList<FundamentalItem> fList = FundamentalDataItems(item);
			DataSeries e = FundamentalDataSeries(item);
			ChartPane ep = CreatePane( 20, true, true );
			PlotFundamentalItems(ep, item, Color.Green, WealthLab.LineStyle.Invisible, 1);
			DrawLabel(ep, "Earnings by 99WallStreet.com");

			if( fList.Count == 0 )
			{
				DrawLabel( PricePane, "Update 99WallStreet.com data before running the Strategy");
				Abort();
			}

			DrawLabel(PricePane, Bars.Symbol + tab + tab + "Earnings count: " + fList.Count);
			DrawLabel(PricePane, "Date" + tab + tab + "EPS" + tab + "Estimate" + tab + "Surprise");
			foreach (FundamentalItem fi in fList)
			{
				DrawLabel(PricePane,
					fi.Date.ToShortDateString() + tab +
					fi.Value.ToString() + tab +
					fi.GetDetail("EPSEstimate") + tab +
					fi.GetDetail("EPSSurprise"));
			}

			Bars spx = GetExternalSymbol("∧GSPC", true); // Yahoo data
			//Bars spx = GetExternalSymbol(".SPX", true); // Fidelity data
			Beta beta = Beta.Series( Bars, spx,200);
			ChartPane pb = CreatePane( 20, true, true );
			PlotSeries( pb, beta, Color.DarkMagenta, LineStyle.Solid, 2 );
			DrawHorzLine( pb, 1.0, Color.DarkMagenta, LineStyle.Dashed, 1 );

			DataSeries smaAvgVol = SMA.Series(Volume, 10);
			PlotSeries( VolumePane, smaAvgVol, Color.Red, LineStyle.Solid, 2 );

			DataSeries ema = EMA.Series(Close,200,EMACalculation.Modern);
			DataSeries ema6 = EMA.Series( Close,6,EMACalculation.Modern);
			PlotSeries( PricePane, ema, Color.Blue, LineStyle.Solid, 2 );
			PlotSeries( PricePane, ema6, Color.Red, LineStyle.Solid, 1 );

			DataSeries rsi = RSI.Series(Close,2);
			ChartPane pr = CreatePane( 20, true, true );
			PlotSeries( pr, rsi, Color.BlueViolet, LineStyle.Solid, 2 );
			DrawHorzLine( pr, 5, Color.Red, LineStyle.Dashed, 1 );
			for(int bar = 2; bar < Bars.Count; bar++)
			{
				if ( rsi[bar] < 5 )
					SetSeriesBarColor( bar, rsi, Color.Red );
				if ( beta[bar] > 1 )
					SetSeriesBarColor( bar, beta, Color.Blue );
			}

			bool SetupValid = false;

			for(int bar = GetTradingLoopStartBar(200); bar < Bars.Count; bar++)
			{
				if (IsLastPositionActive)
				{
					SellAtTrailingStop( bar+1, LastPosition, Lowest.Series( Low, 20 )[bar], "Trailing Stop" );
				}
				else
				{
					if( !SetupValid )
					{
						bool rsi2 = rsi[bar] < 5;
						bool ema200 = Close[bar] > ema[bar];
						bool avgVol = smaAvgVol[bar] >= 1000000;
						bool surprise = false;

						for(int i = fList.Count-1; i >= 0; i--)
						{
							if( bar > fList[i].Bar )
							{
								surprise = ( Double.Parse( fList[i].GetDetail("EPSSurprise").TrimEnd(new char[] {'%'} )) > 0 );
								break;
							}
						}

						bool bet = beta[bar] > 1.0;

						if( surprise )
							SetBackgroundColor( bar, Color.FromArgb(30,Color.Green) );

						if( rsi2 && ema200 && avgVol && surprise && bet )
							SetupValid = true;
					}

					if( SetupValid )
					{
						if( CrossOver( bar, rsi, 5 ) )
							if( BuyAtMarket(bar+1) != null )
								SetupValid = false;
					}
				}
			}
		}
	}
}
—Eugene, Wealth-Lab
MS123, LLC
www.wealth-lab.com
BACK TO LIST

AMIBROKER: MAY 2014
In “A Trading Method For The Long Haul,” which appeared in the 2014 Bonus Issue of Stocks & Commodities, author Donald W. Pendergast Jr. presents a long-only strategy based on the RSI, channel breakouts, and moving averages.
Our ready-to-use formula based on Pendergast’s article has three purposes: It works as a screening tool (called an exploration in AmiBroker) to filter out trade candidates meeting the criteria described in the article. It also can be used as a set of trading rules to backtest the system, and it can also be used as a chart.
To use the formula, copy it to the AFL formula editor, then press “send to analysis” button. From the analysis window, you can press the explore button to run a screening and/or press backtest to evaluate trading system performance.
The code listing is shown below. A sample chart is shown in Figure 4.
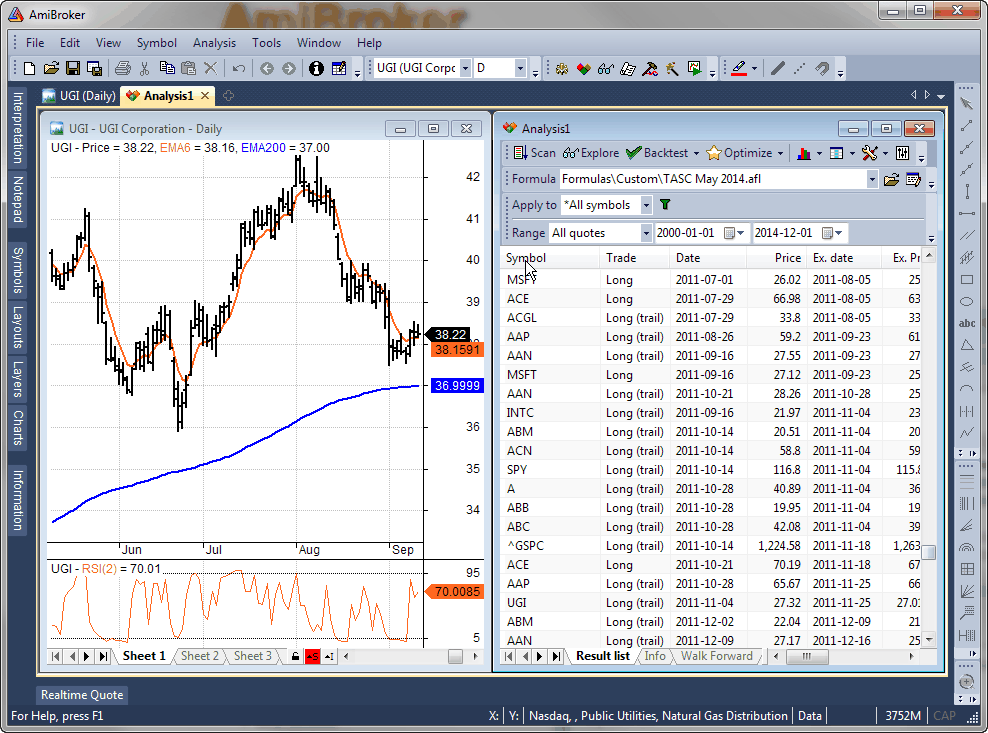
FIGURE 4: AMIBROKER. Here is a daily chart of UGI with six-day and 200-day exponential moving averages, a two-day RSI (left side), and an analysis trade list (right).
// TASC May 2014 - A Trading Method For The Long Haul
// - article by Donald W. Pendergast Jr.
//
// Screening part / Exploration
//

RSI2 = RSI( 2 );
EMA200 = EMA( C, 200 );
AvgVol = MA( V, 50 );

SP = Foreign( "SPY", "C" );

RelPerf52Week = ROC( C / SP, 252 );
RelPerf26Week = ROC( C / SP, 126 );
RelPerf13Week = ROC( C / SP, 61 );
RelPerf4Week = ROC( C, 20 );
StartYear = Year() != Ref( Year(), -1 );
SYV = ValueWhen( StartYear, C / SP );
RelPerfYTD = 100 * ( ( C / SP ) - SYV ) / SYV;

Filter = RSI2 < 5 AND C > EMA200 AND AvgVol > 1000000;

AddColumn( RSI2, "RSI2" );
AddColumn( EMA200, "EMA200" );
AddColumn( AvgVol, "AvgVol" );
AddColumn( RelPerf4Week, "RelPerf4Week" );
AddColumn( RelPerf13Week, "RelPerf13Week" );
AddColumn( RelPerf26Week, "RelPerf26Week" );
AddColumn( RelPerf52Week, "RelPerf52Week" );
AddColumn( RelPerfYTD , "RelPerfYTD" );


// trading rules part
SetPositionSize( 10, spsPercentOfEquity ); // 10% in single trade
SetOption("MaxOpenPositions", 10 ); // 10 positions max.

Buy = Hold( Filter, 40 ) // screening criteria met within last 40 bars
      AND
      Close > Ref( HHV( High, 5 ), -1 ); // stock closes above highs of last 5 bars


Sell = Cross( EMA( C, 6 ), C ); // exit when it drops below 6 period EMA

ApplyStop( stopTypeTrailing, stopModePoint, BuyPrice - Ref( LLV( Low, 3 ), -1 ), True, True ); // 3-bar LLV trailing stop


// indicator part
Plot( C, "Price", colorDefault, styleBar | styleThick );
Plot( EMA( C, 6 ), "EMA6", colorOrange, styleThick );
Plot( EMA200, "EMA200", colorBlue, styleThick  );
—Tomasz Janeczko
AmiBroker.com
www.amibroker.com
BACK TO LIST

NEUROSHELL TRADER: MAY 2014
A trigger trading system based on the system described by Donald W. Pendergast Jr. in his 2014 Bonus Issue article in Stocks & Commodities, “A Trading Method For The Long Haul,” can be easily implemented in NeuroShell Trader with a few of the program’s 800+ indicators. Simply select “New trading strategy” from the Insert menu and enter the following formulas in the appropriate locations of the trading strategy wizard:
BUY LONG CONDITIONS: [All of which must be true]
A<B(Min(RSI(Close,2),25),5)
     CrossAbove(Close,Lag(Max(High,25),1))


LONG TRAILING STOP PRICES:
IfThenElse(A<B(Close,ExpAvg(Close,6)),MaxValEntryAct(Trading Strategy,Min(Low,3),1),*)


SELL LONG CONDITIONS
CrossBelow(Close,ExpAvg(Close,6))
If you have NeuroShell Trader Professional, you can also choose whether the parameters should be optimized. After backtesting the trading strategy, use the detailed analysis button to view the backtest and trade-by-trade statistics for the strategy.
Users of NeuroShell Trader can go to the Stocks & Commodities section of the NeuroShell Trader free technical support website to download a copy of this or any previous Traders’ Tips.
A sample chart is shown in Figure 5.
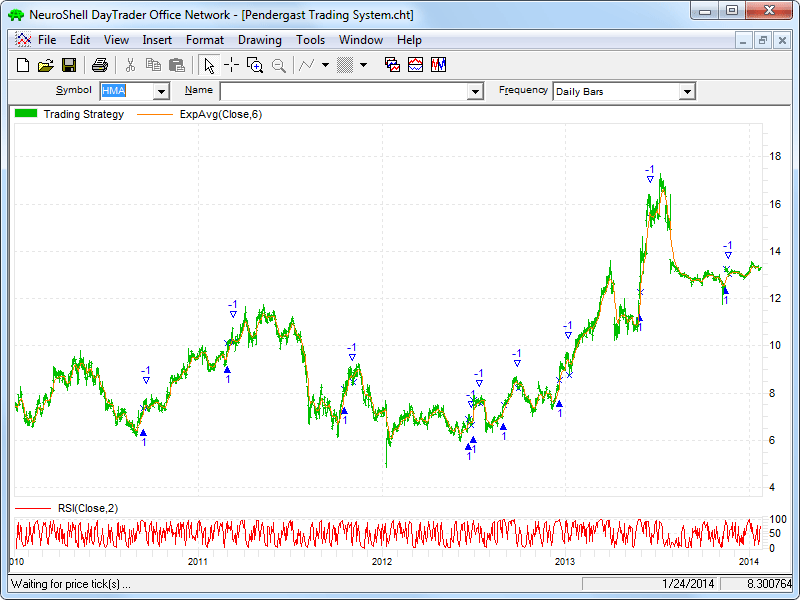
FIGURE 5: NEUROSHELL TRADER. This NeuroShell Trader chart displays the trading system for HMA.
—Marge Sherald, Ward Systems Group, Inc.
301 662-7950, sales@wardsystems.com
www.neuroshell.com
BACK TO LIST

AIQ: MAY 2014
The AIQ code and EDS file based on Donald W. Pendergast’s article in the 2014 Bonus Issue of Stocks & Commodities, “A Trading Method For The Long Haul,” can be found at www.TradersEdgeSystems.com/traderstips.htm.
The code I provide there for the long haul system is modified somewhat from the author’s descriptions as follows. First, I did not implement the fundamental rule, but this can be done if a data source is located that can export the fundamental fields needed for each stock into a .csv file. This could then be imported into the fundamental module. Second, I modified the exit to add an RSI profit target and changed some of the exit parameters.
To get the code to run properly, the AIQALL list of stocks and groups must be installed and updated on the user’s computer. To do this, first get the most recent AIQALL list from the AIQ website, then add all the stocks from the latest data disk that have trading volume greater than about 200,000 shares. We need these in order to have enough stocks to compute the group indexes. Next, we would download data for all the stocks in the database up to the current date. Then, as shown in Figure 6, we would set the RS tickers to the AIQALL list, and also, as shown in Figure 7, recompute all dates for all the groups in the AIQALL list.
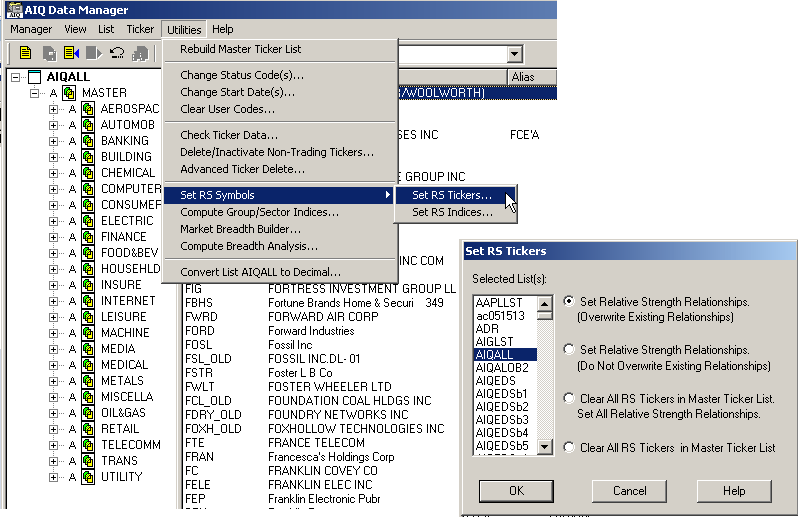
FIGURE 6: AIQ DATA MANAGER. Use the AIQ Data Manager to set the RS tickers to the AIQALL list.
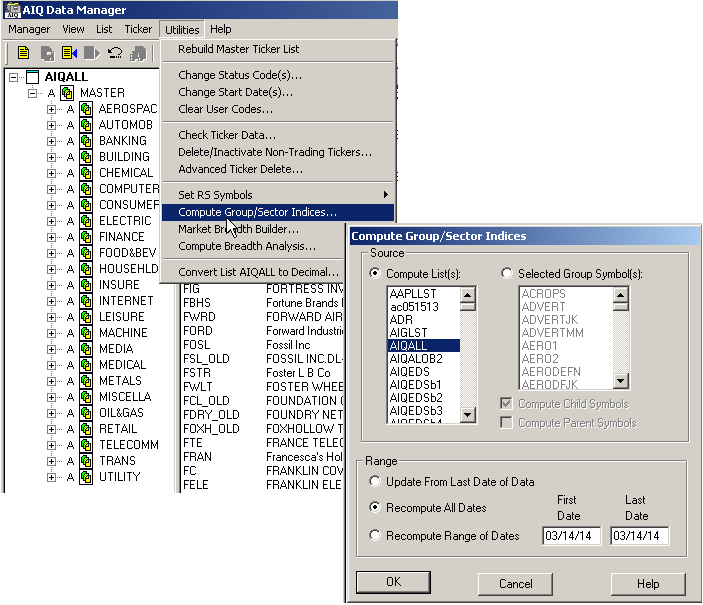
FIGURE 7: AIQ DATA MANAGER. Use the AIQ Data Manager to compute the group & sector indexes for the AIQALL list.
The EDS file containing the code has the properties set to the AIQALL list. If you are building an EDS file directly from the code listing below, then be sure to set the properties to the AIQALL list.
!A Trading Method for the Long Haul
!Author: Donald W. Pendergast Jr., TASC Bonus Issue 2014
!Coded by: Richard Denning 3/10/14
!www.TradersEdgeSystems.com

!INPUTS:
trendLen is 200.
rsiLen is 2.
minAvgVolume is 10000.
volaLen is 21.
relStrLen is 80.
minVolaRatio is 0.5.
rsSPXmin is 1.0.
rsGroupmin is 1.0.
trailBars is 2.
rsiBuyLvl is 5.
rsiExitLvl is 95.
exitLen is 18.
C is [close].
H is [high].
L is [low].
PD is {position days}.

!LONG TERM MOVING AVERAGE:
emaLT is expavg(C,trendLen).
emaST is expavg(L,exitLen).

!RSI WILDER
!To convert Wilder Averaging to Exponential Averaging use this formula:
!ExponentialPeriods = 2 * WilderPeriod - 1.
U is C-valresult(C,1).
D is valresult(C,1)-C.
rsiLen1 is 2 * rsiLen - 1.
AvgU is ExpAvg(iff(U>0,U,0),rsiLen1).
AvgD is ExpAvg(iff(D>=0,D,0),rsiLen1).
rsi is 100-(100/(1+(AvgU/AvgD))).

!VOLATILITY
price1 is H.
price2 is L.
ratio is price1 / price2.
dp is Ln(ratio).
dpsqr is Ln(ratio) * Ln(ratio).
totdpsqr is sum(dpsqr,volaLen).
sumdp is sum(dp,volaLen).
sumdpsqr is sumdp * sumdp.
sumdpave is sumdpsqr / volaLen.
diff is totdpsqr - sumdpave.
!!use 252 for daily, or 52 for weekly below
factor is 252 / (volaLen-1).
result is sqrt(diff * factor).
vola  is result * 100 .
volaAvg is expavg(vola,volaLen).
volaSPXavg is tickerUDF("SPX",volaAvg).
volaRatio is volaSPXavg/volaAvg.

!AVERAGE VOLUME
avgVolume is expavg([volume],50).

!RELATIVE STRENGTH
roc is C / valresult(C,relStrLen).
rocSPX is tickerUDF("SPX",roc).
rocGroup is tickerUDF(rsticker(),roc).
groupSymbol is tickerUDF(rsticker(),symbol()).
groupName is tickerUDF(rsticker(),description()).
rsSPX is roc / rocSPX.
rsGroup is rocGroup / rocSPX.

!SCREENING RULES
VolumeRule if avgVolume > minAvgVolume.
TrendRule if C > emaLT.
VolaRule if volaRatio > minVolaRatio and simpleavg(H-L,10) > simpleavg(H-L,200).
RelStrRule if rsSPX > rsSPXmin and rsGroup > rsGroupmin.
PullbackRule if rsi < rsiBuyLvl.
EnoughData if hasdatafor(trendLen+10) > trendLen.
!FundamentalRule if [eps]>[eps est].

Screen if EnoughData
	and TrendRule
	and VolaRule
	and RelStrRule
	and PullbackRule
	!and FundamentalRule
	and VolumeRule.

EntryTrigger if C > lowresult(H,2,1).
Buy if valrule(Screen,1) and EntryTrigger.

Exit if (C < lowresult(L,trailBars,1))
	or
	(valrule(C > emaST,1) and C < emaST)
	or
	rsi > rsiExitLvl.

ShowValues if EnoughData.
—Richard Denning
info@TradersEdgeSystems.com
for AIQ Systems
BACK TO LIST

TRADERSSTUDIO: MAY 2014
The TradersStudio code based on Donald W. Pendergast’s article in the 2014 Bonus Issue of Stocks & Commodities, issue, “A Trading Method For The Long Haul,” is provided at the following websites:
The following code files are provided in the download:
- System LONG_HAUL: A trading system that employs most of the rules outlined in Pendergast’s 2014 Bonus Issue article, “A Trading Method For The Long Haul,”
- Function VOLATILITY: Returns the volatility value based on a standard deviation-type formula
- Function SUMM: Returns the summation value of the price array input (helper function for volatility).
To set up the system as Pendergast outlines, we would create a session for each group of stocks that will be traded. Independent1 should always be set to a major market index like the S&P 500, and independent2 should be set to the group index for the stocks that are included in the session. Once a session is set up for each group to be traded, a trade plan could be written that would control how many trades are accepted from each group as well as the size of each trade. I did not write the trade plan due to time constraints, but I did test the system on just one group, the NASDAQ 100 group of stocks. I set independent1 to the S&P 500 index (SPX) and independent2 to the NASDAQ 100 index (NDX). I did a minor amount of optimization and also added an RSI profit target exit. My code does not implement the fundamental rule.
In Figure 8, I show the equity curve and underwater equity curve for the single session trading a fixed 200 shares of each stock.
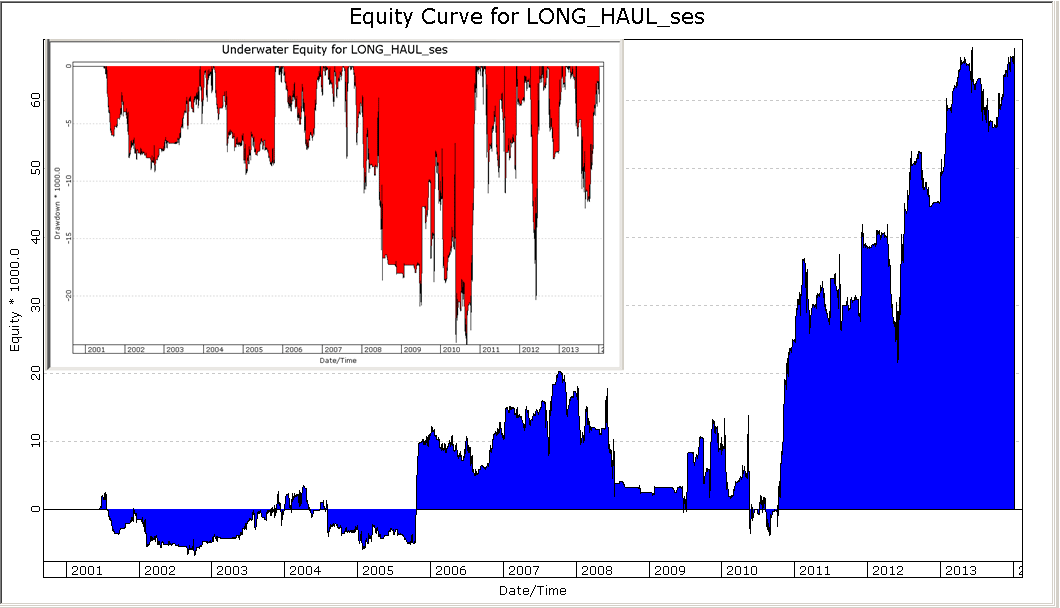
FIGURE 8: TRADERSSTUDIO. Here is an equity curve (blue) and underwater equity curve (red) for Donald Pendergast’s long haul system trading a single group, the NASDAQ 100 group of stocks.
'A Trading Method for the Long Haul
'Author: Donald W  Pendergast Jr , TASC Bonus Issue 2014
'Coded by: Richard Denning 3/10/14
'www TradersEdgeSystems com

'LONG HAUL TRADING SYSTEM:
Sub LONG_HAUL(trendLen,rsiLen,minAvgVolume,volaLen,relStrLen,minVolaRatio,rsSPXmin,rsGroupmin,trailBars,rsiBuyLvl,rsiExitLvl,exitLen)

'LONG & SHORT TERM MOVING AVERAGES:
Dim emaLT As BarArray
Dim emaST As BarArray
emaLT  = XAverage(C,trendLen)
emaST  = XAverage(L,exitLen)

'RSI WILDER
Dim rsiWilder As BarArray
rsiWilder = rsi(C,rsiLen,0)

'VOLATILITY
Dim ratio As BarArray
Dim ratioINDX As BarArray
Dim volaAvg As BarArray
Dim volaAvgINDX As BarArray
Dim IndexC As BarArray
Dim IndexH As BarArray
Dim IndexL As BarArray
Dim GroupC As BarArray
IndexC = C Of independent1
IndexH = H Of independent1
IndexL = L Of independent1
GroupC = C Of independent2
If H - L <> 0 then ratio  = (H - L )/((H + L)/2)
If IndexL>0 Then ratioINDX = IndexH / IndexL
volaAvg = Average(volatility(ratio,volaLen),volaLen)
volaAvgINDX = Average(volatility(ratioINDX,volaLen),volaLen)

'AVERAGE VOLUME
Dim avgVolume As BarArray
avgVolume  = XAverage(V,50)

'RELATIVE STRENGTH
Dim rocStk As BarArray
Dim rocINDX As BarArray
Dim rocGroup As BarArray
If C[relStrLen]>0 Then rocStk  = C / C[relStrLen]
If IndexC[relStrLen]>0 Then rocINDX  = IndexC / IndexC[relStrLen]
If GroupC[relStrLen]>0 Then rocGroup  = GroupC / GroupC[relStrLen]

'SCREENING RULES
Dim VolumeRule,TrendRule,VolaRule,RelStrRule,PullBackRule,FundamentalRule
Dim SetUp As BarArray
VolumeRule = avgVolume > minAvgVolume
TrendRule = C > emaLT
If volaAvgINDX>0 Then VolaRule = volaAvg/volaAvgINDX > minVolaRatio
If rocINDX>0 Then RelStrRule = rocStk/rocINDX > rsSPXmin And rocGroup/rocINDX > rsGroupmin
PullBackRule = rsiWilder < rsiBuyLvl
'FundamentalRule = eps > eps est
SetUp = TrendRule And PullBackRule And VolumeRule And RelStrRule 'And VolaRule
Dim EntryTrigger As BarArray
EntryTrigger = C > Lowest(H,2,1)
If (SetUp[1] Or SetUp) And EntryTrigger Then Buy("LE",1,0,Market,Day)

If (C < Lowest(L,trailBars,1) And C < emaST) Then
    ExitLong("LX_trail","",1,0,Market,Day)
End If
If (C[1] > emaST[1] And C < emaST And countof(C < emaST,BarsSinceEntry,0)>1) Then
    ExitLong("LX_ema","",1,0,Market,Day)
End If
If rsiWilder > rsiExitLvl Then
    ExitLong("LX_rsi","",1,0,Market,Day)
End If
End Sub
'--------------------------------------------------------------------------------------------
'FUNCTION TO COMPUTE VOLATILITY:
Function Volatility(price As BarArray, volaLen) As BarArray
    Dim dp
    Dim dpSqr
    Dim totDpSqr
    Dim sumDp
    Dim sumDpSqAvg
    Dim annualizationFactor

    If price[1] <> 0 Then dp = Log(price/price[1])
    dpSqr = dp*dp
    totDpSqr = Summ(dpSqr, volaLen)
    sumDp = Summ(dp, volaLen)
    if volalen > 0 then sumDpSqAvg = (sumDp*sumDp)/volaLen
    annualizationFactor = 252
    Volatility = 100 * Sqr((annualizationFactor/(volaLen - 1))*(totDpSqr - sumDpSqAvg))
End Function
'----------------------------------------------------------------------------------------------
'HELPER FUNCTION USED BY VOLATILITY FUNCTION TO GET SUMMATION:
' SUMM
' Adds all the values passed to it

Function Summ(Var1 As BarArray,Length) As BarArray
    Dim Counter
    Dim CSum As BarArray

    Counter = 0
    CSum = 0

    CSum = 0
    For Counter = 0 To Length - 1
        CSum = CSum + Var1[Counter]
    Next
    Summ = CSum
End Function
'------------------------------------------------------------------------------------------------
—Richard Denning
info@TradersEdgeSystems.com
for TradersStudio
BACK TO LIST

UPDATA: MAY 2014
This Traders’ Tip is based on “A Trading Method For The Long Haul” by Donald W. Pendergast Jr., which appeared in the 2014 Bonus Issue of Stocks & Commodities.
In the article, the author develops a long-only system for equity products that have beaten their quarterly earnings expectations consistently. The first stage of the process is to filter your universe of stocks using Updata’s scan facility to create a list based on that fundamental criteria.
On this list, you apply two exponentially weighted averages, which are used to determine short-term weakness in an overall uptrend. Above average trading volume, outperformance of the SPX index and a two-period RSI are also included as trade filters. The system exits on a close below some trailing-period low. All parameter values can be optimized within the Updata System Optimiser.
The Updata code for this article is in the Updata library and may be downloaded by clicking the custom menu and system library. Those who cannot access the library due to a firewall may paste the code shown below into the Updata custom editor and save it.
PARAMETER "RSI Period" #RSIPeriod=2
PARAMETER "EMA Long Period" #EMAPeriodLong=200
PARAMETER "EMA Short Period" #EMAPeriodShort=6
PARAMETER "Volume Avg" #VOLUMEPERIOD=60
PARAMETER "Volume (Millions)" #VOLTHRESH=1
PARAMETER "SPX Ticker" ~SPXIndex=Select
PARAMETER "Beta Period" #BETAPeriod=200
PARAMETER "Beta Thresh." @BETAThresh=1
PARAMETER "Lower High Period" #LOWERHIGHPERIOD=5
NAME "EMA[" #EMAPeriodLong "," #EMAPeriodShort "]" ""
NAME3 "RSI[" #RSIPeriod "]" ""
NAME4 "Beta" ""
NAME6 "Volume" ""
DISPLAYSTYLE 8LINES
INDICATORTYPE TOOL
INDICATORTYPE3 CHART
INDICATORTYPE4 CHART
INDICATORTYPE6 CHART
PLOTSTYLE6 HISTOGRAM
COLOUR RGB(200,0,0)
COLOUR2 RGB(0,0,200)
COLOUR4 RGB(0,0,0)
COLOUR5 RGB(200,0,0)
COLOUR7 RGB(200,0,0)
COLOUR8 RGB(0,0,200)
@RSI=0
@EMALong=0
@EMAShort=0
@BETA=0
@VOLUMEAVG=0
@STOPLONG=0
@TRAILINGHIGHS=0
@ACCEPTLONGS=0
FOR #CURDATE=MAX(#EMAPeriodLong,#BETAPeriod) TO #LASTDATE-1
   @RSI=RSI(#RSIPeriod)
   @EMALong=EAVE(#EMAPeriodLong)
   @EMAShort=EAVE(#EMAPeriodShort)
   @BETA=BETA(CLOSE,~SPXIndex,#BETAPeriod)
   @VOLUMEAVG=SGNL(VOL,#VOLUMEPERIOD,M)
   'ACCEPTS LONGS AFTER RSI CROSSING BELOW 5
   'LONG SIGNAL ABROGATED WHEN RSI MOVES ABOVE 50
   IF @RSI<5
      @ACCEPTLONGS=1
   ELSEIF @RSI>50
      @ACCEPTLONGS=0
   ENDIF
   'STOP OR EMA EXIT
   IF ORDERISOPEN=1 AND HASX(CLOSE,@EMAShort,DOWN) OR CLOSE<@STOPLONG
      SELL CLOSE
   ENDIF
   IF @TRAILINGHIGHS=1 AND HIGH>HIGH(1) AND ORDERISOPEN=0 AND @ACCEPTLONGS=1 AND @VOLUMEAVG>(#VOLTHRESH*1000000)
      BUY HIGH(1)
      @STOPLONG=PLOW(LOW(1),3)
   ENDIF
   'LOGS NUMBER OF TRAILING HIGHS
   @TRAILINGHIGHS=SGNL(HIGH<HIGH(1),#LOWERHIGHPERIOD,M)
   'CREATES A TRAILING STOP OF LOWS
   IF ORDERISOPEN=1
      @STOPLONG=MAX(@STOPLONG,PLOW(LOW(1),3))
   ENDIF
   @PLOT=@EMAShort
   @PLOT2=@EMALong
   @PLOT3=@RSI
   @PLOT4=@BETA
   @PLOT5=@BETAThresh
   @PLOT6=VOL
   @PLOT7=#VOLTHRESH*1000000
   @PLOT8=@VOLUMEAVG
NEXT
A sample chart is shown in Figure 9.
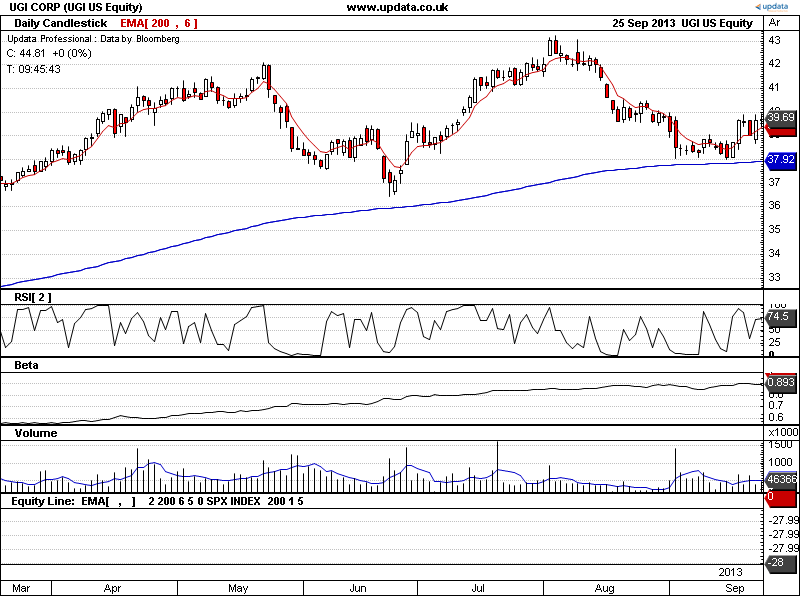
FIGURE 9: UPDATA. This chart shows the trading rules as applied to UGI Corp. data of daily resolution.
—Updata support team
support@updata.co.uk, www.updata.co.uk
BACK TO LIST

NINJATRADER: MAY 2014
The LongHaulScanner, as discussed in “A Trading Method For The Long Haul” by Donald W. Pendergast Jr. in the 2014 Bonus Issue of Stocks & Commodities, has been implemented as indicator available for download at www.ninjatrader.com/SC/May2014SC.zip.
Once it has been downloaded, from within the NinjaTrader Control Center window, select the menu File → Utilities → Import NinjaScript and select the downloaded file. This file is for NinjaTrader version 7 or greater.
You can review the indicator source code by selecting the menu Tools → Edit NinjaScript → Strategy from within the NinjaTrader Control Center window and selecting the LongHaulScanner file.
A sample chart implementing the strategy is shown in Figure 10.
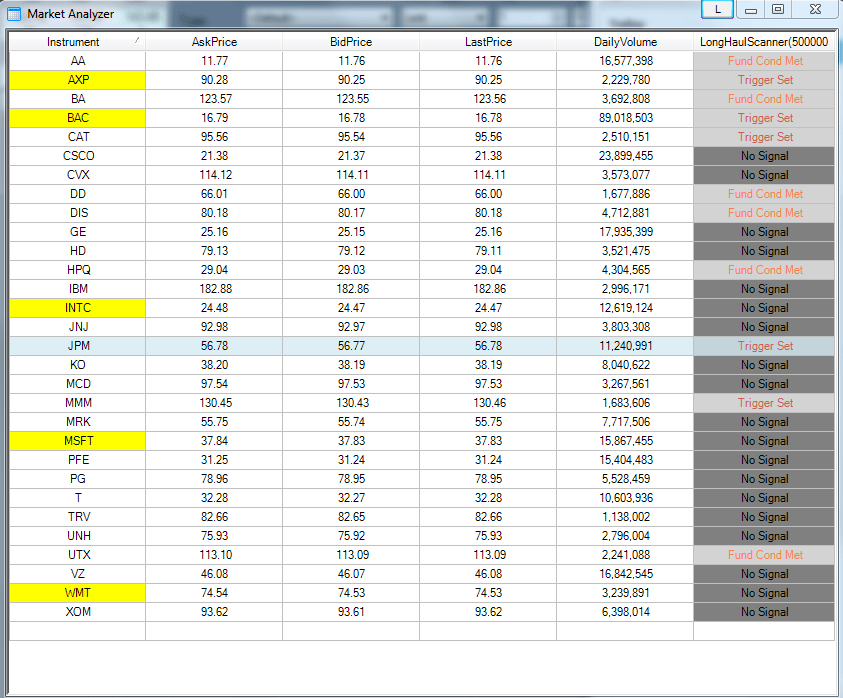
FIGURE 10: NINJATRADER MARKETANALYZER. This screenshot shows the scanner indicator applied to the DOW30 in NinjaTrader’s MarketAnalyzer.
—Raymond Deux & Chelsea Bell
NinjaTrader, LLC
www.ninjatrader.com
BACK TO LIST
Originally published in the May 2014 issue of
Technical Analysis of Stocks & Commodities magazine.
All rights reserved. © Copyright 2014, Technical Analysis, Inc.


