TRADERS’ TIPS
June 2014
For this month’s Traders’ Tips, the focus is Perry Kaufman’s article in this issue, “Slope Divergence: Capitalizing On Uncertainty.” Here we present the June 2014 Traders’ Tips code with possible implementations in various software.
Code for TradeStation is already provided in Perry Kaufman’s article by the author. S&C subscribers will find that code at the Subscriber Area of our website here. Presented here is an overview of some possible implementations for other software as well.
Traders’ Tips code is provided to help the reader implement a selected technique from an article in this issue. The entries are contributed by various software developers or programmers for software that is capable of customization.

TRADESTATION: JUNE 2014
In “Slope Divergence: Capitalizing On Uncertainty” in this issue, author Perry Kaufman presents a trading strategy based on finding a divergence between a security’s price and its momentum. The author has already provided some TradeStation Easy-Language code for the strategy in his article in this issue, which we have also made available for download at the link below.
In addition to backtesting the strategy in a Trade-Station chart on one symbol at a time, remember that you can use TradeStation’s Portfolio Maestro product to quickly backtest on a portfolio of symbols of your choice. You can also use the TradeStation Walk-Forward Optimizer to automate the complex, multistep task of carrying out a statistical walk-forward test of a trading strategy’s optimized inputs.
To download the EasyLanguage code, please visit our TradeStation and EasyLanguage support forum. The code can be found here: https://www.tradestation.com/TASC-2014. The ELD filename is “_TASC_SlopeDivergence.ELD.”
For more information about EasyLanguage in general, please see https://www.tradestation.com/EL-FAQ.
A sample chart is shown in Figure 1.
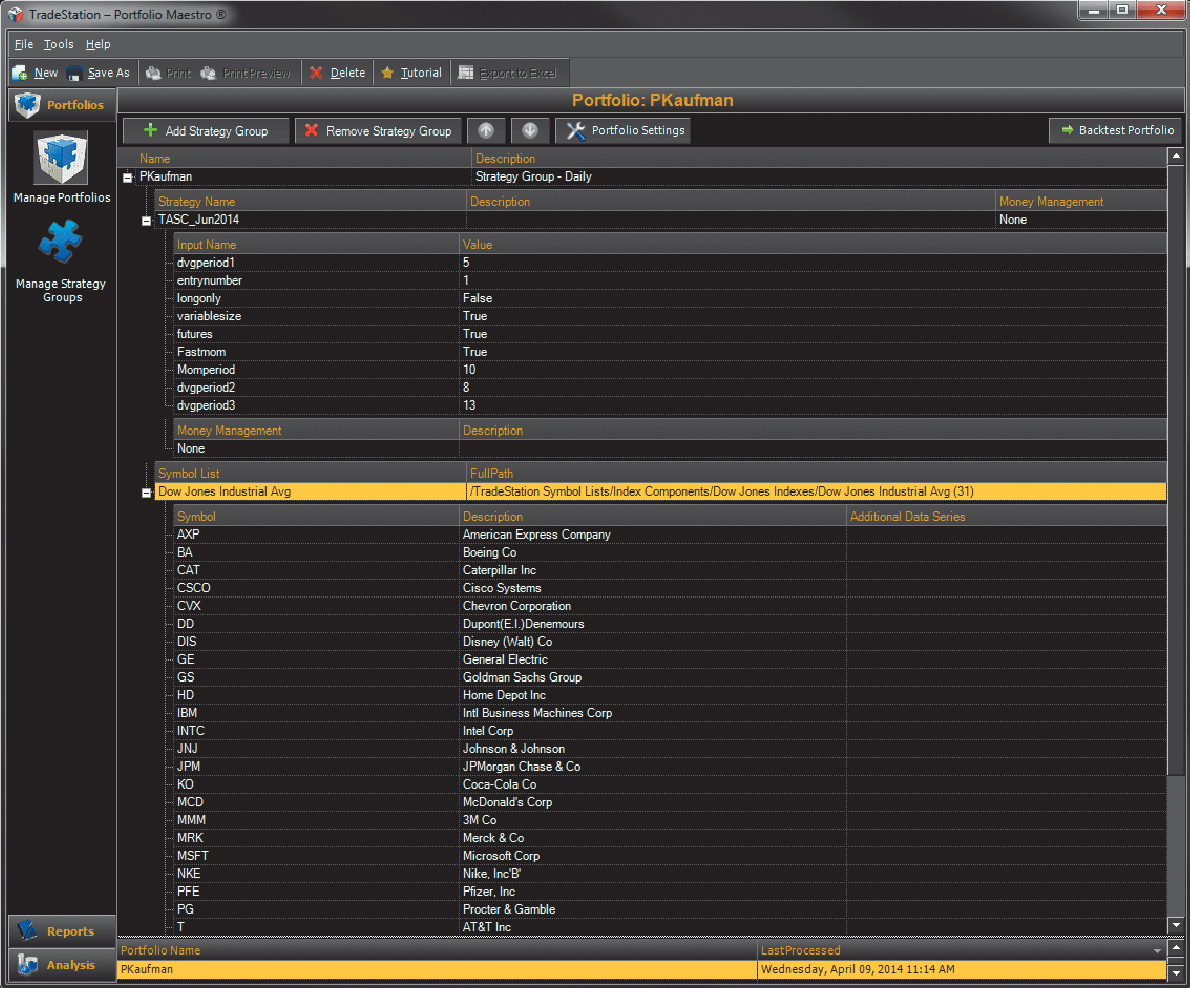
FIGURE 1: TRADESTATION. The strategy described here can be backtested and optimized on a portfolio of securities using TradeStation’s Portfolio Maestro.
This article is for informational purposes. No type of trading or investment recommendation, advice, or strategy is being made, given, or in any manner provided by TradeStation Securities or its affiliates.
—Doug McCrary
TradeStation Securities, Inc.
www.TradeStation.com
BACK TO LIST

METASTOCK: JUNE 2014
In “Slope Divergence: Capitalizing On Uncertainty” in this issue, author Perry Kaufman describes a divergence-based trading system. The formulas for this system are shown here:
Buy Order:

tpm:= 25;
tp1:= 5;
tp2:= 12;
tp3:= 14;
mi:= Stoch(tpm, 1);

md1:= linregslope(mi, tp1);
md2:= linregslope(mi, tp2);
md3:= linregslope(mi, tp3);
pd1:= linregslope(c, tp1);
pd2:= linregslope(c, tp2);
pd3:= linregslope(c, tp3);

((md1<0) + (md2<0) + (md3<0) >= 2) AND
((pd1>0) + (pd2>0) + (pd3>0) >= 2)


Sell Order:

tpm:= 25;
tp1:= 5;
tp2:= 12;
tp3:= 14;
mi:= Stoch(tpm, 1);

md1:= linregslope(mi, tp1);
md2:= linregslope(mi, tp2);
md3:= linregslope(mi, tp3);
pd1:= linregslope(c, tp1);
pd2:= linregslope(c, tp2);
pd3:= linregslope(c, tp3);

min(md1, min(md2, min(md3, min(pd1, min(pd2, pd3))))) >0 OR
max(md1, max(md2, max(md3, max(pd1, max(pd2, pd3))))) <0


Sell Short Order:

tpm:= 25;
tp1:= 5;
tp2:= 12;
tp3:= 14;
mi:= Stoch(tpm, 1);

md1:= linregslope(mi, tp1);
md2:= linregslope(mi, tp2);
md3:= linregslope(mi, tp3);
pd1:= linregslope(c, tp1);
pd2:= linregslope(c, tp2);
pd3:= linregslope(c, tp3);

((md1>0) + (md2>0) + (md3>0) >= 2) AND
((pd1<0) + (pd2<0) + (pd3<0) >= 2)


Buy to CovrOrder:

tpm:= 25;
tp1:= 5;
tp2:= 12;
tp3:= 14;
mi:= Stoch(tpm, 1);

md1:= linregslope(mi, tp1);
md2:= linregslope(mi, tp2);
md3:= linregslope(mi, tp3);
pd1:= linregslope(c, tp1);
pd2:= linregslope(c, tp2);
pd3:= linregslope(c, tp3);

min(md1, min(md2, min(md3, min(pd1, min(pd2, pd3))))) >0 OR
max(md1, max(md2, max(md3, max(pd1, max(pd2, pd3))))) <0
—William Golson
MetaStock Technical Support
www.metastock.com
BACK TO LIST

THINKORSWIM: JUNE 2014
In “Slope Divergence: Capitalizing On Uncertainty” in this issue, author Perry Kaufman expands on the classic idea of divergence by combining an indicator and price movement. The indicator of focus is stochastics. The article goes into great detail, but the essence is that the divergence signals displayed will normally be missed.
We have made this strategy easy for users to load. Simply click on the link https://tos.mx/WP7mBx and choose backtest in thinkorswim. You can adjust the parameters of these within the edit studies window to fine-tune your variables.
The chart in Figure 2 shows the entry & exit point when the criteria described in the article were met on a one-year daily chart of Microsoft (MSFT). What is being investigated here and what is triggering the backtested trades are the slopes of the stochastics and the slopes of the price movement. This strategy calculates multiple lengths and bases the entry points on the lengths that meet Kaufman’s criteria.
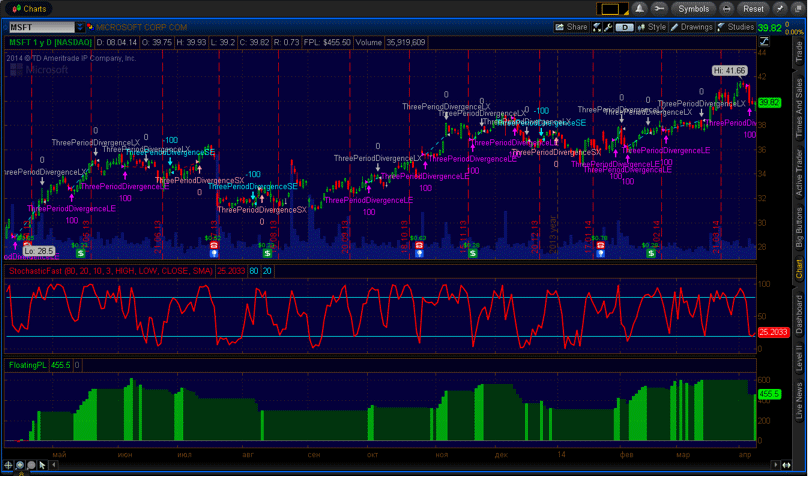
FIGURE 2: THINKORSWIM
For more information about the strategy, refer to Kaufman’s article in this issue. Happy swimming!
—thinkorswim
A division of TD Ameritrade, Inc.
www.thinkorswim.com
BACK TO LIST

eSIGNAL: JUNE 2014
For this month’s Traders’ Tip, we’ve provided the formula TheThreePeriodDivergence.efs based on the formula described in Perry Kaufman’s article in this issue, “Slope Divergence: Capitalizing On Uncertainty.” The study contains formula parameters that may be configured through the edit chart window (right-click on the chart and select “edit chart”). A sample chart implementation of the technique is shown in Figure 3.
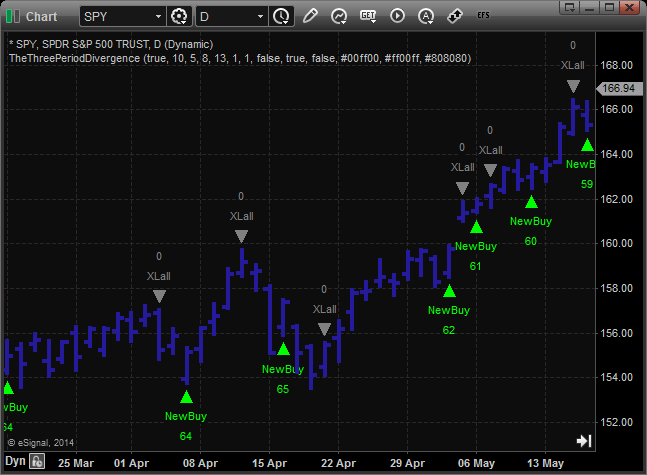
FIGURE 3: eSIGNAL
To discuss this study or download a complete copy of the formula code, please visit the EFS Library Discussion Board forum under the Forums link from the support menu at www.esignal.com or visit our EFS KnowledgeBase at https://www.esignal.com/support/kb/efs/. The eSignal formula script (EFS) is also available for download here.
—Eric Lippert
eSignal, an Interactive Data company
800 779-6555, www.eSignal.com
BACK TO LIST

WEALTH-LAB: JUNE 2014
This WealthScript strategy implements a simplified version of Perry Kaufman’s triple-divergence trading system described in his article in this issue, “Slope Divergence: Capitalizing On Uncertainty.” Users have the control to turn the system into long-only, as well as to configure its sensitivity by triggering a trading signal after one, two, or three divergences on the same bar.
C# Code

using System;
using System.Collections.Generic;
using System.Text;
using System.Drawing;
using WealthLab;
using WealthLab.Indicators;

namespace WealthLab.Strategies
{
	enum Side { Buy = 1, Sell = -1, NA = 0 }

	public class TASC201406_Kaufman : WealthScript
	{
		Side SingleDivergence( int bar, int period, int momperiod,
			DataSeries ps, DataSeries ms, out bool trendup, out bool trenddn, out int p, out int m )
		{
			trendup = (ps[bar] > 0 && ms[bar] > 0);
			trenddn = (ps[bar] < 0 && ms[bar] < 0);
			p = ps[bar] >= 0 ? 1 : ps[bar] < 0 ? -1 : 0;
			m = ms[bar] >= 0 ? 1 : ms[bar] < 0 ? -1 : 0;

			return ( ps[bar] > 0 && ms[bar] < 0 ) ? Side.Buy :
				( ps[bar] < 0 && ms[bar] > 0 ) ? Side.Sell : Side.NA;
		}

		void Colorize( int bar, Side side )
		{
			SetBackgroundColor( bar, Color.FromArgb(30, side == Side.Buy ? Color.Green : Color.Red ) );
		}

		private StrategyParameter paramNumDiv;
		private StrategyParameter paramLongOnly;

		public TASC201406_Kaufman()
		{
			paramNumDiv = CreateParameter("Divergences", 1, 1, 3, 1);
			paramLongOnly = CreateParameter("Long Only", 0, 0, 1, 1);
		}

		protected override void Execute()
		{
			int momperiod = 10, entrynumber = paramNumDiv.ValueInt,
				dvgperiod1 = 5, dvgperiod2 = 8, dvgperiod3 = 13, maxdivergences = 3;
			bool longonly = (paramLongOnly.ValueInt == 0 ? false : true);
			LinearRegSlope lsp1 = LinearRegSlope.Series( Close,dvgperiod1 );
			LinearRegSlope lsp2 = LinearRegSlope.Series( Close,dvgperiod2 );
			LinearRegSlope lsp3 = LinearRegSlope.Series( Close,dvgperiod3 );
			StochK fastK = StochK.Series(Bars,momperiod);
			LinearRegSlope lsm1 = LinearRegSlope.Series( fastK,dvgperiod1 );
			LinearRegSlope lsm2 = LinearRegSlope.Series( fastK,dvgperiod2 );
			LinearRegSlope lsm3 = LinearRegSlope.Series( fastK,dvgperiod3 );

			ClearDebug(); HideVolume(); LineStyle ls = LineStyle.Solid;
			ChartPane lrspPane = CreatePane( 40,false,true );
			PlotSeries( lrspPane, lsp1, Color.DarkGreen, ls, 1 );
			PlotSeries( lrspPane, lsp2, Color.Blue, ls, 1 );
			PlotSeries( lrspPane, lsp3, Color.Red, ls, 1 );
			//ChartPane lrsmPane = CreatePane( 30,false,true );
			//PlotSeries( lrsmPane, fastK, Color.Black, ls, 1 );

			for(int bar = GetTradingLoopStartBar(Math.Max(momperiod,dvgperiod3)); bar < Bars.Count; bar++)
			{
				int nbuys = 0, nsells = 0, ps1 = 0, ps2 = 0, ps3 = 0, ms1 = 0, ms2 = 0, ms3 = 0,
					npriceslopeup = 0, npriceslopedown = 0, nmomslopeup = 0, nmomslopedown = 0;
				bool trend1up = false, trend2up = false, trend3up = false,
					trend1dn = false, trend2dn = false, trend3dn = false;

				Side _d1 = SingleDivergence( bar, dvgperiod1, momperiod, lsp1, lsm1, out trend1up, out trend1dn, out ps1, out ms1 );
				Side _d2 = SingleDivergence( bar, dvgperiod2, momperiod, lsp2, lsm2, out trend2up, out trend2dn, out ps2, out ms2 );
				Side _d3 = SingleDivergence( bar, dvgperiod3, momperiod, lsp3, lsm3, out trend3up, out trend3dn, out ps3, out ms3 );

				int d1 = (int)_d1;
				int d2 = (int)_d2;
				int d3 = (int)_d3;

				if( d1 > 0 ) nbuys += 1; if( d1 < 0 ) nsells += 1;
				if( d2 > 0 ) nbuys += 1; if( d2 < 0 ) nsells += 1;
				if( d3 > 0 ) nbuys += 1; if( d3 < 0 ) nsells += 1;

				if( ps1 > 0 ) npriceslopeup += 1; if( ps1 < 0 ) npriceslopedown += 1;
				if( ps2 > 0 ) npriceslopeup += 1; if( ps2 < 0 ) npriceslopedown += 1;
				if( ps3 > 0 ) npriceslopeup += 1; if( ps3 < 0 ) npriceslopedown += 1;

				if( ms1 > 0 ) nmomslopeup += 1; if( ms1 < 0 ) nmomslopedown += 1;
				if( ms2 > 0 ) nmomslopeup += 1; if( ms2 < 0 ) nmomslopedown += 1;
				if( ms3 > 0 ) nmomslopeup += 1; if( ms3 < 0 ) nmomslopedown += 1;

				if( nbuys >= entrynumber )
					Colorize( bar, Side.Buy );
				else
					if( nsells >= entrynumber )
						Colorize( bar, Side.Sell );
				if( false )
				PrintDebug( "bar: " + bar + ", d1: " + d1 + ", d2: " + d2 + ", d3: " + d3 + ", nbuys: " + nbuys + ", nsells: " + nsells +
					", npriceslopeup: " + npriceslopeup + ", npriceslopedown: " + npriceslopedown +
					", nmomslopeup: " + nmomslopeup + ", nmomslopedown: " + nmomslopedown );

				if (IsLastPositionActive)
				{
					Position p = LastPosition;

					if( p.PositionType == PositionType.Long )
					{
						if( nsells >= entrynumber)
							SellAtClose( bar, p, "revLong");
					}
					else //if( p.PositionType == PositionType.Short )
					{
						if( nbuys >= entrynumber)
							CoverAtClose( bar, p, "revShort");
					}

					if( (npriceslopeup == maxdivergences && nmomslopeup == maxdivergences) ||
						(npriceslopedown == maxdivergences && nmomslopedown == maxdivergences) )
					{
						ExitAtMarket( bar+1, p, p.PositionType == PositionType.Long ? "xLall" : "xSall" );
					}
				}
				else
				{
					if( nbuys >= entrynumber)
						BuyAtMarket(bar+1, "newBuy");
					else
						if( nsells >= entrynumber && longonly == false)
						ShortAtMarket(bar+1, "newSell");
				}
			}
		}
	}
}
A sample chart implementation is shown in Figure 4.
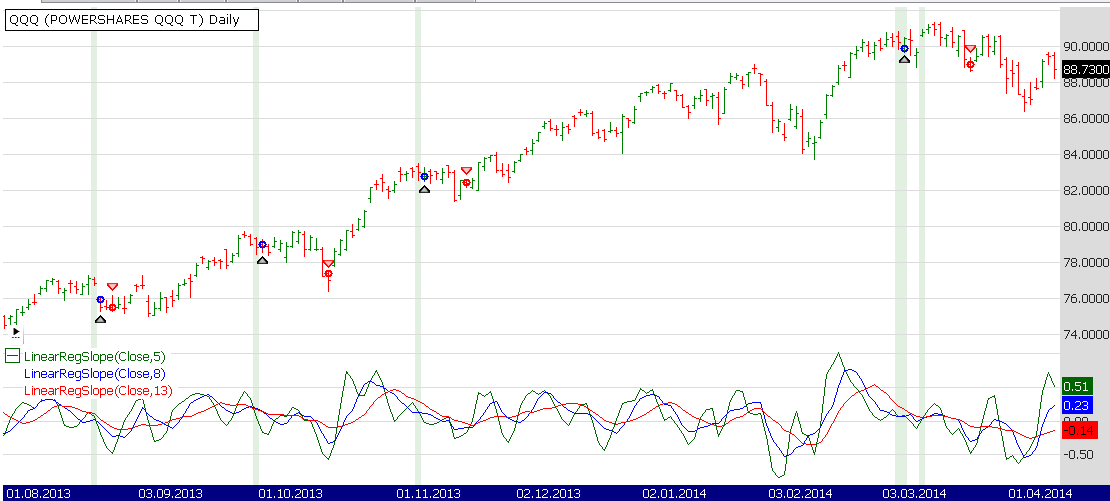
FIGURE 4: WEALTH-LAB, QQQ. This chart illustrates the application of the system’s rules on a daily chart of QQQ. The lower panel shows the five-, eight-, and 13-day linear regression slope of the recent close price.
—Wealth-Lab team
MS123, LLC
www.wealth-lab.com
BACK TO LIST

AMIBROKER: JUNE 2014
In “Slope Divergence: Capitalizing On Uncertainty” in this issue, author Perry Kaufman presents a strategy based on divergences between stochastics and price action. A ready-to-use formula based on the article for use in AmiBroker is presented here. To use the formula, copy it to the AFL formula editor, then press the send to analysis button. From the analysis window, you can press backtest to evaluate trading system performance.
A sample chart implemention is shown in Figure 5.
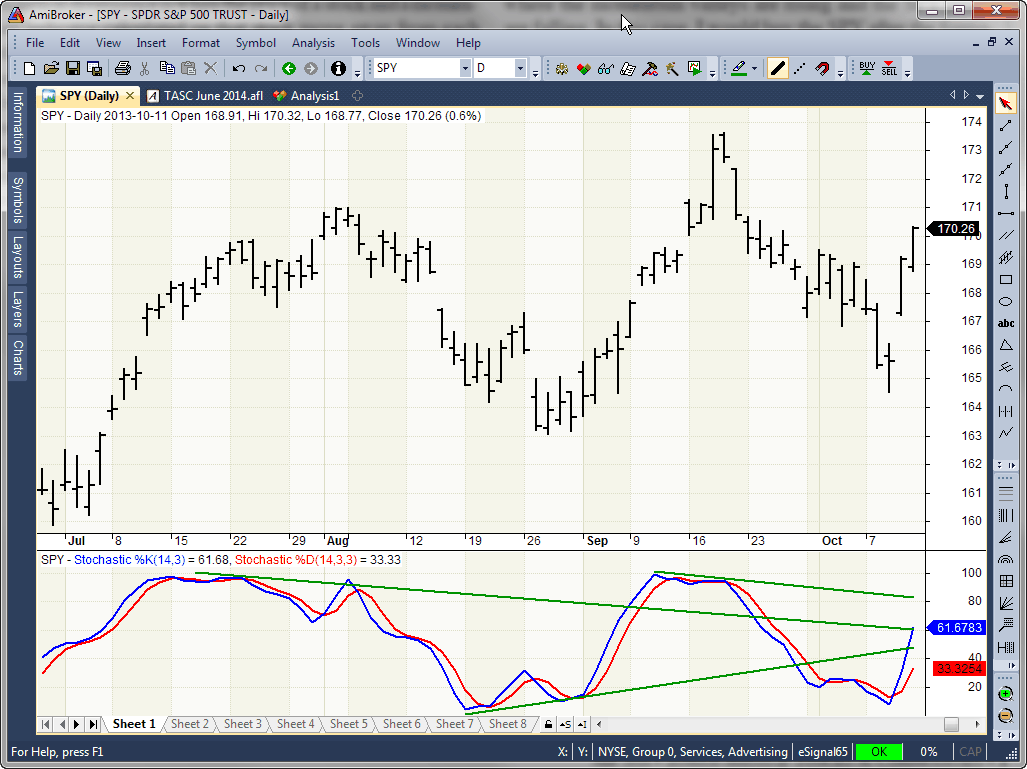
FIGURE 5: AMIBROKER. Here is a daily chart of the SPY with a 14-day slow stochastic showing divergence with price action.
LISTING 1.
fastmom = ParamToggle("Fast momenum", "No|Yes", 1 );
momperiod = Param("Momentum period", 10, 1, 100 );;
dvgperiod1 = Param("Div. period 1", 5, 1, 100 );
dvgperiod2 = Param("Div. period 2", 8, 1, 100 );;
dvgperiod3 = Param("Div. period 3", 13, 1, 100 );
ATRperiod = Param("ATR period", 20, 1, 1, 100 );
entrynumber = Param("Entry no", 1, 1, 3, 1 );
maxdivergences = 3;
investment = Param("Investment per trade", 25000, 10000, 250000, 1000 );

mom = IIf( fastmom, StochK( momperiod, 1 ), StochK( momperiod, 3 ) );

priceslope1 = LinRegSlope(Close,dvgperiod1);
momslope1 = LinRegSlope(mom,dvgperiod1);
dvgbuy1 = priceslope1 > 0 AND momslope1 < 0;
dvgsell1 = priceslope1 < 0 AND momslope1 > 0;

priceslope2 = LinRegSlope(Close,dvgperiod2);
momslope2 = LinRegSlope(mom,dvgperiod2);
dvgbuy2 = priceslope2 > 0 AND momslope2 < 0;
dvgsell2 = priceslope2 < 0 AND momslope2 > 0;

priceslope3 = LinRegSlope(Close,dvgperiod3);
momslope3 = LinRegSlope(mom,dvgperiod3);
dvgbuy3 =  priceslope3 > 0 AND momslope3 < 0;
dvgsell3 = priceslope3 < 0 AND momslope3 > 0;

nbuys = dvgbuy1 + dvgbuy2 + dvgbuy3;
nsells = dvgsell1 + dvgsell2 + dvgsell3;

npriceslopeup = ( priceslope1 >= 0 ) + ( priceslope2 >= 0 ) + ( priceslope3 >= 0 );
npriceslopedown = ( priceslope1 < 0 ) + ( priceslope2 < 0 ) + ( priceslope3 < 0 );

nmomslopeup = ( momslope1 >= 0 ) + ( momslope2 >= 0 ) + ( momslope3 >= 0 );
nmomslopedown = ( momslope1 < 0 ) + ( momslope2 < 0 ) + ( momslope3 < 0 );

Exit = ( npriceslopeup == maxdivergences AND nmomslopeup == maxdivergences) OR ( npriceslopedown == maxdivergences AND nmomslopedown == maxdivergences);
Cover = Sell = Exit; // exit both long and short

Buy = nbuys >= entrynumber;
Short = nsells >= entrynumber;

SetOption("ReverseSignalForcesExit", True ); // to reverse position

SetPositionSize( investment, spsValue );
—Tomasz Janeczko, AmiBroker.com
www.amibroker.com
BACK TO LIST

NEUROSHELL TRADER: JUNE 2014
The trading system based on slope divergence presented by Perry Kaufman in his article in this issue, “Slope Divergence: Capitalizing On Uncertainty,” can be easily implemented in NeuroShell Trader using a few of NeuroShell Trader’s 800+ indicators. Simply select new trading strategy from the Insert menu and enter the following in the appropriate locations of the Trading Strategy Wizard:
BUY LONG CONDITIONS (two of which must be true):

And2( A>B( LinRegSlope(Close,5), 0), A<B( LinRegSlope( Stoch%K(High,Low,Close,10), 5), 0))
And2( A>B( LinRegSlope(Close,8), 0), A<B( LinRegSlope( Stoch%K(High,Low,Close,10), 8), 0))
And2( A>B( LinRegSlope(Close,13), 0), A<B( LinRegSlope( Stoch%K(High,Low,Close,10), 13), 0))

SELL-SHORT CONDITIONS (two of which must be true):

And2( A<B( LinRegSlope(Close,5), 0), A>B(LinRegSlope( Stoch%K(High,Low,Close,10), 5), 0))
And2( A<B( LinRegSlope(Close,8), 0), A>B(LinRegSlope( Stoch%K(High,Low,Close,10), 8), 0))
And2( A<B( LinRegSlope(Close,13), 0), A>B(LinRegSlope( Stoch%K(High,Low,Close,10), 13), 0))

SELL LONG CONDITIONS and COVER SHORT CONDITIONS (one of which must be true):

And3( And2( A>B( LinRegSlope(Close,5), 0), A>B( LinRegSlope( Stoch%K(High,Low,Close,10), 5), 0)), And2( A>B( LinRegSlope(Close,8), 0), A>B( LinRegSlope( Stoch%K(High,Low,Close,10), 8), 0)),
And2( A>B( LinRegSlope(Close,13), 0), A>B( LinRegSlope( Stoch%K(High,Low,Close,10), 13), 0)))

And3( And2( A<B( LinRegSlope(Close,5), 0), A<B( LinRegSlope( Stoch%K(High,Low,Close,10), 5), 0)), And2( A<B( LinRegSlope(Close,8), 0), A<B( LinRegSlope( Stoch%K(High,Low,Close,10), 8), 0)),
And2( A<B( LinRegSlope(Close,13), 0), A<B( LinRegSlope( Stoch%K(High,Low,Close,10), 13), 0)))
Select also “Long/Short entries exit existing short/long positions” in the trading strategy parameters dialog.
If you have NeuroShell Trader Professional, you can also choose whether the parameters should be optimized. After backtesting the trading strategy, use the detailed analysis button to view the backtest and trade-by-trade statistics for the strategy.
Users of NeuroShell Trader can go to the STOCKS & COMMODITIES section of the NeuroShell Trader free technical support website to download a copy of this or any previous Traders’ Tip.
A sample chart is shown in Figure 6.
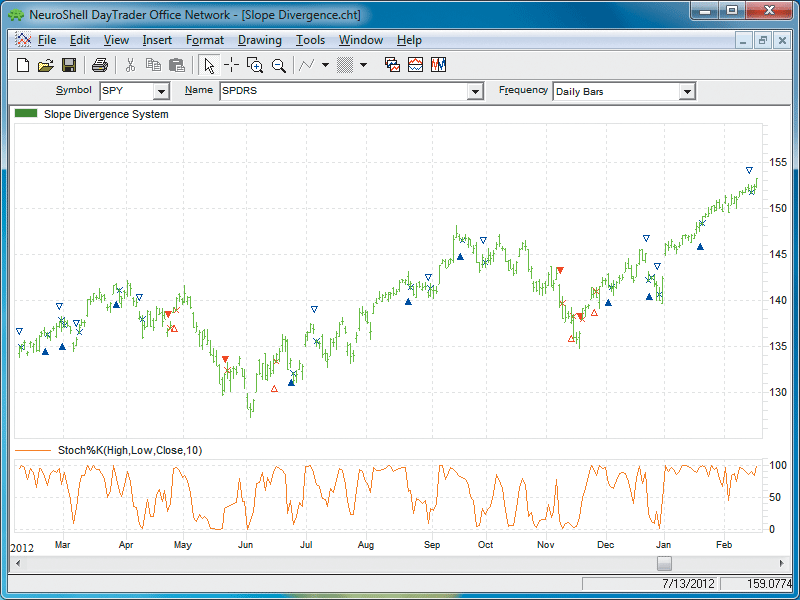
FIGURE 6: NEUROSHELL TRADER. This NeuroShell Trader chart displays the slope divergence trading system.
—Marge Sherald, Ward Systems Group, Inc.
301 662-7950, sales@wardsystems.com
www.neuroshell.com
BACK TO LIST

AIQ: JUNE 2014
The AIQ code based on Perry Kaufman’s article in this issue, “Slope Divergence: Capitalizing On Uncertainty,” is provided at www.TradersEdgeSystems.com/traderstips.htm.
I have modified the implementation somewhat from the author’s descriptions. I did not find that the system was exiting in an average of six days but was holding for a longer period. My exits might be the issue so I added a time exit that can be used to force an exit after the “maxBars” input number of bars. I liked the results when my time exit was set to hold for a maximum of nine bars.
Figure 7 shows the AIQ EDS summary long-only backtest report using the NASDAQ 100 list of stocks over the prior four years ending 4/10/2014. Neither commission nor slippage have been subtracted from these results. To get the short side of the system to show a profit, I added slope filters on the NASDAQ 100 index. Note that my parameter settings differ from those suggested by the author.
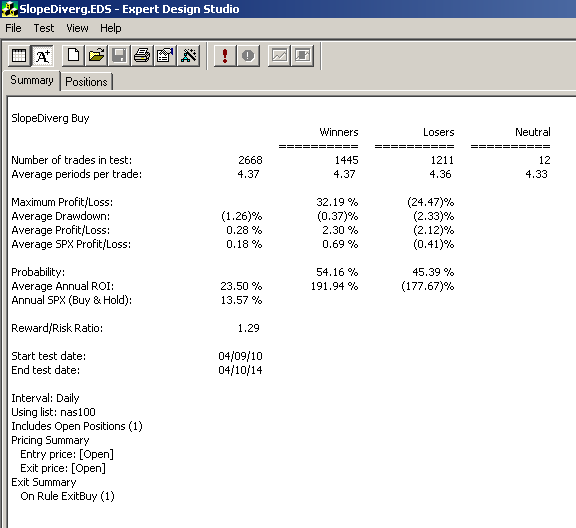
FIGURE 7: AIQ, SAMPLE RESULTS. Here is a sample AIQ EDS summary long-only backtest report using the NASDAQ 100 list of stocks over the prior four years ending 4/10/2014.
The code and EDS file can be downloaded from www.TradersEdgeSystems.com/traderstips.htm. The code is also shown here:
!SLOPE DIVERGENCE: CAPITALIZING ON UNCERTAINTY
!Author: Perry Kaufman, TASC June 2014
!Coded by: Richard Denning 4/7/2014
!www.TradersEdgeSystems.com

!INPUTS:
momLen is 10.
dvgLen1 is 5.
dvgLen2 is 7.
dvgLen3 is 10.
entryNum is 3.
maxDiverg is 3.
minPrice is 10.
maxBars is 3.

!USER DEFINED FORMULAS:
C is [close].
L is [low].
H is [high].
HH is highresult(H,momLen).
LL is lowresult(L,momLen).
stoch is (C - LL) / (HH - LL).

momSlope1 is slope2(stoch,dvgLen1).
momSlope2 is slope2(stoch,dvgLen2).
momSlope3 is slope2(stoch,dvgLen3).

priceSlope1 is slope2(C,dvgLen1).
priceSlope2 is slope2(C,dvgLen2).
priceSlope3 is slope2(C,dvgLen3).

dvgBuy1 if priceSlope1 > 0 and momslope1 < 0.
dvgBuy2 if priceSlope1 > 0 and momslope2 < 0.
dvgBuy3 if priceSlope1 > 0 and momslope3 < 0.

dvgSell1 if priceSlope1 < 0 and momslope1 > 0.
dvgSell2 if priceSlope1 < 0 and momslope2 > 0.
dvgSell3 if priceSlope1 < 0 and momslope3 > 0.

nPriceSUp is priceSlope1 > 0 + priceSlope2 > 0 + priceSlope3 > 0.
nMomSUp is momSlope1 > 0 + momSlope2 > 0 + momSlope3 > 0.

nPriceSDown is priceSlope1 < 0 + priceSlope2 < 0 + priceSlope3 < 0.
nMomSDown is momSlope1 < 0 + momSlope2 < 0 + momSlope3 < 0.

dvgBuySum is dvgBuy1 + dvgBuy2 + dvgBuy3.
dvgSellSum is dvgSell1 + dvgSell2 +dvgSell3.

Buy if dvgBuySum >= entryNum and C > minPrice.
AllComboExit if (nPriceSDown = maxDiverg and nMomSDown = maxDiverg)
	     or (nPriceSUp = maxDiverg and nMomSUp = maxDiverg).
Time if {position days} >= maxBars.
ExitBuy if AllComboExit or Sell or Time.

Sell if dvgSellSum >= entryNum.
ExitSell if AllComboExit or Buy or Time.
—Richard Denning
info@TradersEdgeSystems.com
for AIQ Systems
BACK TO LIST

TRADERSSTUDIO: JUNE 2014
The TradersStudio code based on Perry Kaufman’s article in this issue, “Slope Divergence: Capitalizing On Uncertainty,” is provided at the following websites:
The following code files are provided in the download:
- System SDIVERG_SYS: A trading system that employs most of the rules outlined in Kaufman’s article;
- Function LinearRegSRV: Returns the linear regression (LR) slope and other related LR variables.
The code I am providing departs somewhat from Kaufman’s descriptions. I did not find that the system was exiting in an average of six days but was holding for a longer period. My exits could be the issue, so I added a time exit that can be used to force an exit after the “maxBars” input number of bars. I liked the results when my time exit was set to hold for a maximum of nine bars.
In Figure 8, I show the equity and underwater equity curves based on this system trading the NASDAQ 100 list of stocks, long only, for the period 2008 through February 2014. On each signal, 100 shares were traded. Neither commission nor slippage was subtracted from these results. I did not code or test the short side of the system.
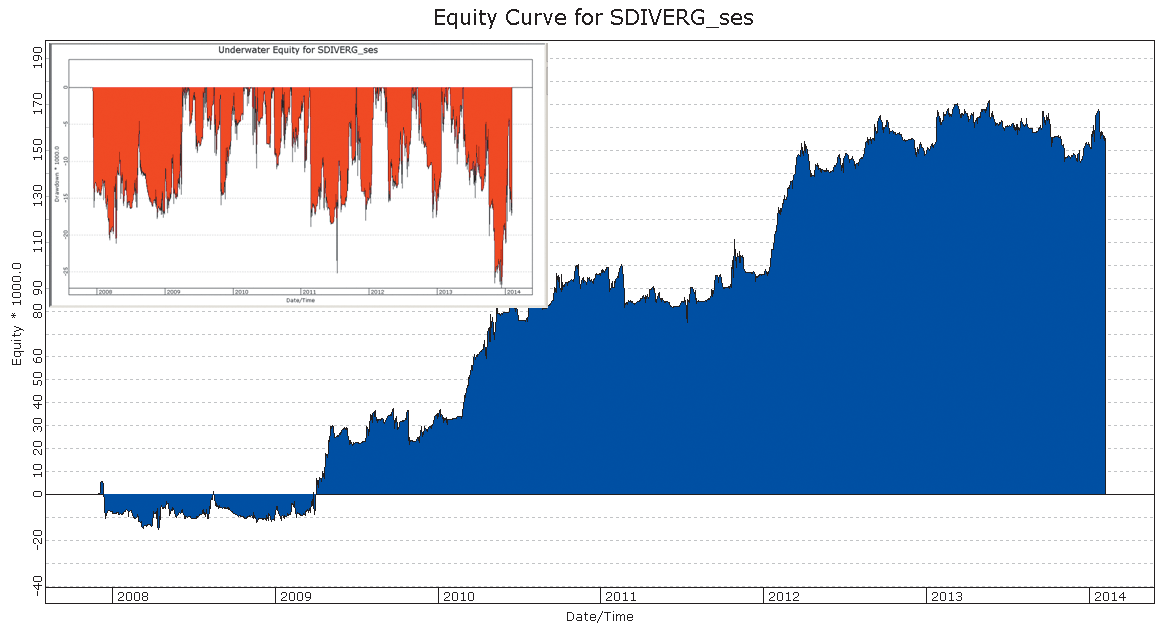
FIGURE 8: TRADERSSTUDIO. Here are sample equity and underwater equity curves trading the NASDAQ 100 list of stocks, long only, for the period 2008 through February 2014.
The code is also shown below:
'SLOPE DIVERGENCE: CAPITALIZING ON UNCERTAINTY
'Author: Perry Kaufman, TASC June 2014
'Coded by: Richard Denning 4/7/2014
'www.TradersEdgeSystems.com

Sub SDIVERG_SYS(momLen,dvgLen1,dvgLen2,dvgLen3,entryNum,maxDiverg,minPrice,maxBars)
'momLen=10,dvgLen1=5,dvgLen2=7,dvgLen3=10,entryNum=3,maxDiverg=3,minPrice=10,maxBars=3)
Dim stoc As BarArray
Dim momSlope1 As BarArray
Dim momSlope2 As BarArray
Dim momSlope3 As BarArray
Dim priceSlope1 As BarArray
Dim priceSlope2 As BarArray
Dim priceSlope3 As BarArray
Dim rSqrd1,rSqrd2,rSqrd3,rSqrd4,rSqrd5,rSqrd6
Dim slope1,slope2,slope3,slope4,slope5,slope6
Dim endVal1,endVal2,endVal3,endVal4,endVal5,endVal6
Dim dvgBuy1,dvgBuy2,dvgBuy3,dvgSell1,dvgSell2,dvgSell3
Dim nPriceSUp,nMomSUp,nPriceSDown,nMomSDown,dvgBuySum,dvgSellSum

If (Highest(H,momLen) - Lowest(L,momLen)) <> 0 Then
   stoc = (C-Lowest(L,momLen))/(Highest(H,momLen) - Lowest(L,momLen))
End If

momSlope1 = LinearRegSRV(stoc,dvgLen1,0,rSqrd1,slope1,endVal1)
momSlope2 = LinearRegSRV(stoc,dvgLen2,0,rSqrd2,slope2,endVal2)
momSlope3 = LinearRegSRV(stoc,dvgLen3,0,rSqrd3,slope3,endVal3)
priceSlope1 = LinearRegSRV(C,dvgLen1,0,rSqrd4,slope4,endVal4)
priceSlope2 = LinearRegSRV(C,dvgLen2,0,rSqrd5,slope5,endVal5)
priceSlope3 = LinearRegSRV(C,dvgLen3,0,rSqrd6,slope6,endVal6)

dvgBuy1 = IIF(priceSlope1 > 0 And momSlope1 < 0,1,0)
dvgBuy2 = IIF (priceSlope1 > 0 And momSlope2 < 0,1,0)
dvgBuy3 = IIF (priceSlope1 > 0 And momSlope3 < 0,1,0)

dvgSell1 = IIF (priceSlope1 < 0 And momSlope1 > 0,1,0)
dvgSell2 = IIF (priceSlope1 < 0 And momSlope2 > 0,1,0)
dvgSell3 = IIF (priceSlope1 < 0 And momSlope3 > 0,1,0)

nPriceSUp = IIF(priceSlope1 > 0,1,0) + IIF(priceSlope2 > 0,1,0) + IIF(priceSlope3 > 0,1,0)
nMomSUp = IIF(momSlope1 > 0,1,0) + IIF(momSlope2 > 0,1,0) + IIF(momSlope3 > 0,1,0)

nPriceSDown = IIF(priceSlope1 < 0,1,0) + IIF(priceSlope2 < 0,1,0) + IIF(priceSlope3 < 0,1,0)
nMomSDown = IIF(momSlope1 < 0,1,0) + IIF(momSlope2 < 0,1,0) +  IIF(momSlope3 < 0,1,0)

dvgBuySum = dvgBuy1 + dvgBuy2 + dvgBuy3
dvgSellSum = dvgSell1 + dvgSell2 +dvgSell3

If (dvgBuySum >= entryNum And TSCLose > minPrice) Then Buy("LE",1,0,Market,Day)
If (nPriceSDown = maxDiverg And nMomSDown = maxDiverg) Then ExitLong("LX_allDown","",1,0,Market,Day)
If (nPriceSUp = maxDiverg And nMomSUp = maxDiverg) Then ExitLong("LX_allUp","",1,0,Market,Day)
If (BarsSinceEntry > maxBars) Then ExitLong("LX_time","",1,0,Market,Day)
If (dvgSellSum >= entryNum) Then ExitLong("LX_sell","",1,0,Market,Day)

End Sub
'----------------------------------------------------------------------------------------------------
' LINEAR REGRESSION FUNCTION
' Coded by: Richard Denning 01/21/08

'Parameters

' Y  specifies which Price Of the asset Of interest is To be used
' SLen the number Of trailing bars To consider
' TargetB represents the number Of bars into the future Or back into the past
' Returns a numeric value containing the current value Of the specified regression line at TargetB.
' Changes values of variables rSqrd, slopeR, endVal to those the least squares line computed by the function
' R squared (rSqrd) is the measure of how well the line fits the data (will vary from 0 (no fit) to 1.00 (perfect fit)
' slope (slopeR) is the rise over run of the line
' endVal is the value of the line at the current bar

'the regression formulas can be checked using the Excel tutorial on linear regression found at:
'https://phoenix.phys.clemson.edu/tutorials/excel/regression.html

Function LinearRegSRV(Y As BarArray, SLen, TargetB, ByRef rSqrd, ByRef slopeR, ByRef endVal) As BarArray
    Dim X As BarArray
    Dim Num1 As BarArray
    Dim Num2 As BarArray
    Dim SumX As BarArray
    Dim SumSqrX As BarArray
    Dim SumY As BarArray
    Dim SumSqrY As BarArray
    Dim SumXY As BarArray
    Dim Slope As BarArray
    Dim Intercept As BarArray

 If SLen <= 0 Then
    LinearRegSRV = 0
 Else

    SumX = 0
    SumSqrX = 0
    SumY = 0
    SumSqrY = 0
    SumXY = 0
    'Sum2 = 0

    For X = 0 To SLen - 1
        SumX = SumX + X
        SumSqrX = SumSqrX + X * X
        SumY = SumY + Y[X]
        SumSqrY = SumSqrY + Y[X] * Y[X]
        SumXY = SumXY + X * Y[X]
    Next

  'slope
    If (SumSqrX - SumSqrY) <> 0 Then
        'Slope = Num1 / Num2
        Slope = (SumXY - SumX * SumY) / (SumSqrX - SumSqrY)
    Else
        Slope = 0
    End If

  'intercept
    Intercept = (SumY - Slope * SumX) / SLen
    slopeR = Slope

  'R squared
    If (Sqr((SumSqrX - SumX*SumX)*(SumSqrY - SumY * SumY))) <> 0 Then
        rSqrd = (SumXY - SumX * SumY) / (Sqr((SumSqrX - SumX*SumX)*(SumSqrY - SumY * SumY)))
    Else
        rSqrd = 0
    End If

  'end value of linear regression line
    endVal = Intercept + Slope * (SLen - 1)

  'projected value of linear regression line at target bar
    LinearRegSRV = Intercept + Slope * (SLen - 1 - TargetB)

 End If
End Function
—Richard Denning
info@TradersEdgeSystems.com
for TradersStudio
BACK TO LIST

NINJATRADER: JUNE 2014
The slope divergence strategy presented by Perry Kaufman in his article in this issue, “Slope Divergence: Capitalizing On Uncertainty,” has been implemented as a NinjaTrader strategy available for download at www.ninjatrader.com/SC/June2014SC.zip.
Once it has been downloaded, from within the NinjaTrader Control Center window, select the menu File → Utilities → Import NinjaScript and select the downloaded file. This file is for NinjaTrader version 7 or greater.
You can review the strategy source code by selecting the menu Tools → Edit NinjaScript → Strategy from within the NinjaTrader Control Center window and selecting the “SlopeDivergence” file.
NinjaScript uses compiled DLLs that run native, not interpreted, which provides the highest possible performance.
A sample chart implementing the strategy is shown in Figure 9.
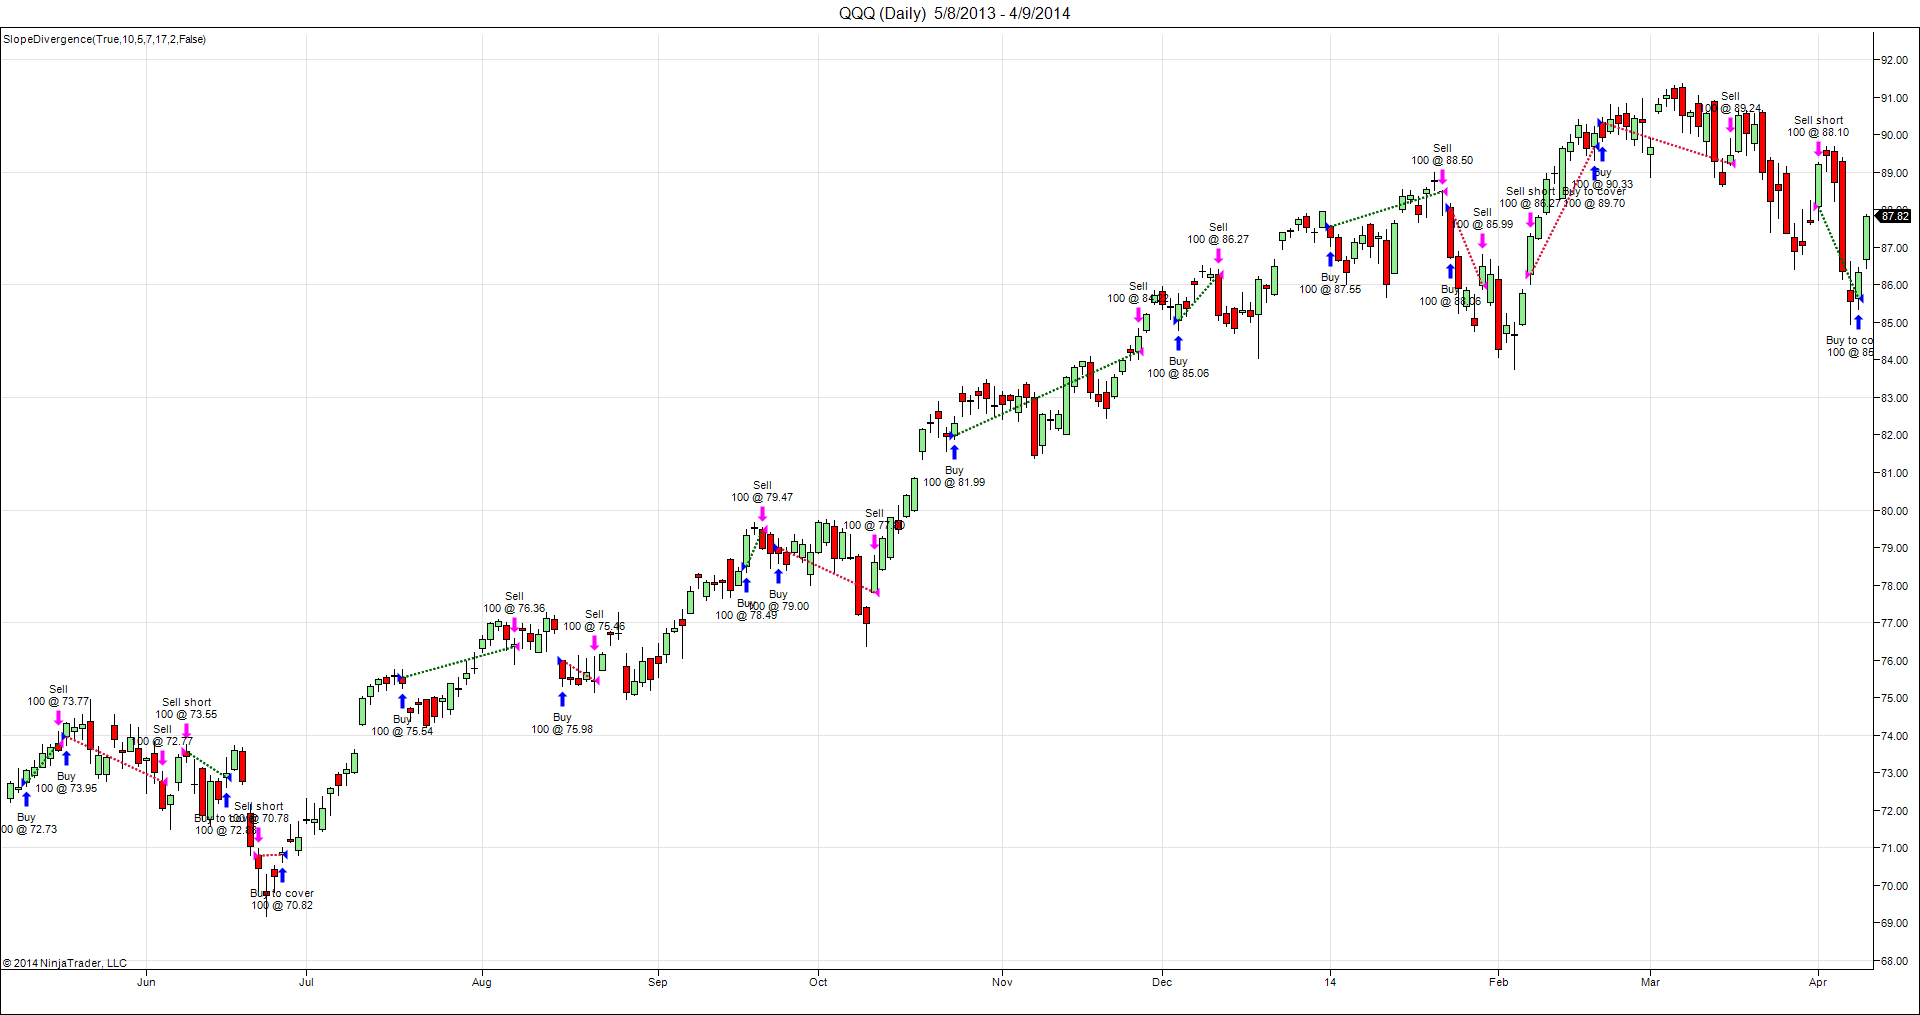
FIGURE 9: NINJATRADER. The screenshot shows the strategy applied to the QQQ daily chart in NinjaTrader.
—Raymond Deux, Cal Hueber and Jesse Nelson
NinjaTrader, LLC
www.ninjatrader.com
BACK TO LIST
MICROSOFT EXCEL: JUNE 2014
In “Slope Divergence: Capitalizing On Uncertainty” in this issue, author Perry Kaufman walks us through the use of divergence between price action and momentum to determine long and short entries & exits. Along the way, he shows us how to build a simple trading system based on these signals.
Figure 10 shows a chart that resembles Sidebar Figure 1 from Kaufman’s article. The indicator portion of the chart in his sidebar only shows price slopes calculated at three periods. I have enhanced (or cluttered?) the indicator part of the chart by including the momentum slopes.
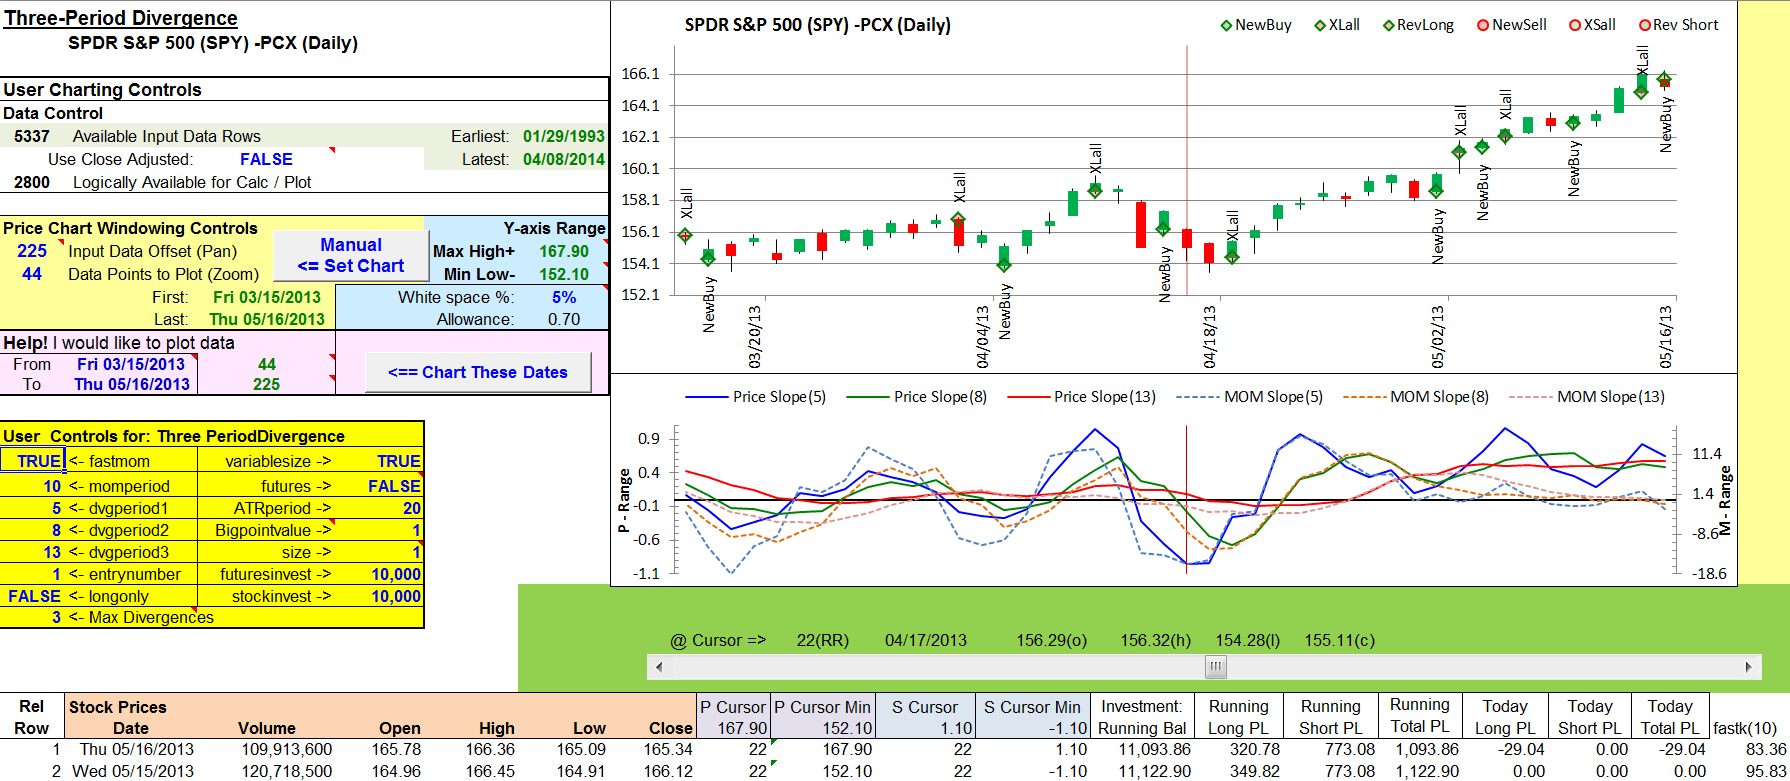
FIGURE 10: EXCEL, Trade Signals Using Fast Momentum=True
As you can see, the range of the price slopes and the range of the momentum slopes are radically different in scale. However, we do not care about this difference in scale as long as the horizontal axis is the zero line for both sets of indicators. The logic of this system makes decisions based on how many of these indicator lines and in which combinations are above or below the zero line at any given time.
Figure 11 shows the results of changing just one of the user controls. The zero crossings of the slope indicators have shifted. The divergence combinations have changed and so have our entries & exits.
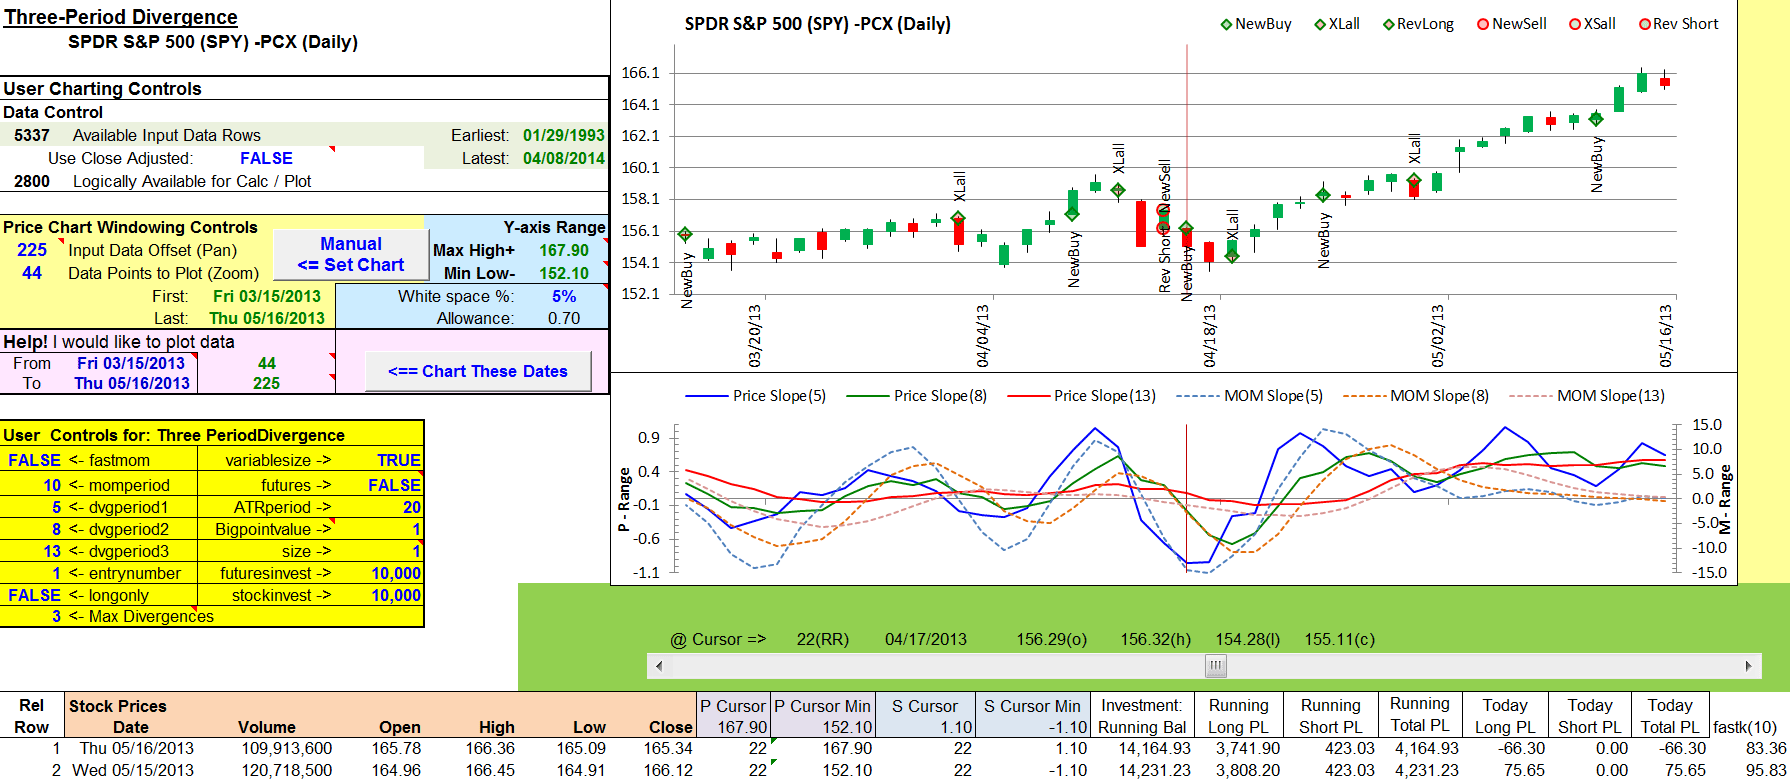
FIGURE 11: EXCEL, Changing Only One Control. When we set fast momentum=false, it alters the divergence conditions and thus the signals.
In these two charts, we are only viewing the most recent 44 bars. But under the covers, the spreadsheet calculations include 2,800 bars: 4/4/2002 through 5/16/2013, or just over 11 years.
In Figure 10, we started on 4/4/2002 with a nest egg of $10,000 and grew it to $11,093.86 (see the investment running balance and running total PL columns). Contrast that with Figure 11, where we again started on 4/4/2002 with the same $10,000 and with one change to the controls, grew it to $14.164.93. Compare also the two plots of the running balance under each of the two settings in Figures 12 and 13.
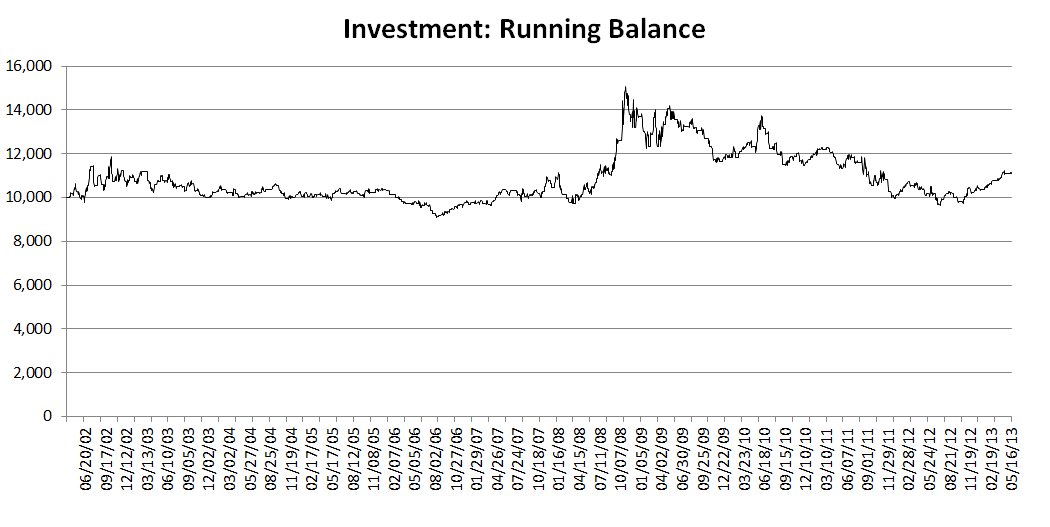
FIGURE 12: EXCEL, RUNNING BALANCE, Fast Momentum=True. Here are sample results for the running balance with the user controls as set in Figure 10 (that is, fast momentum=true).
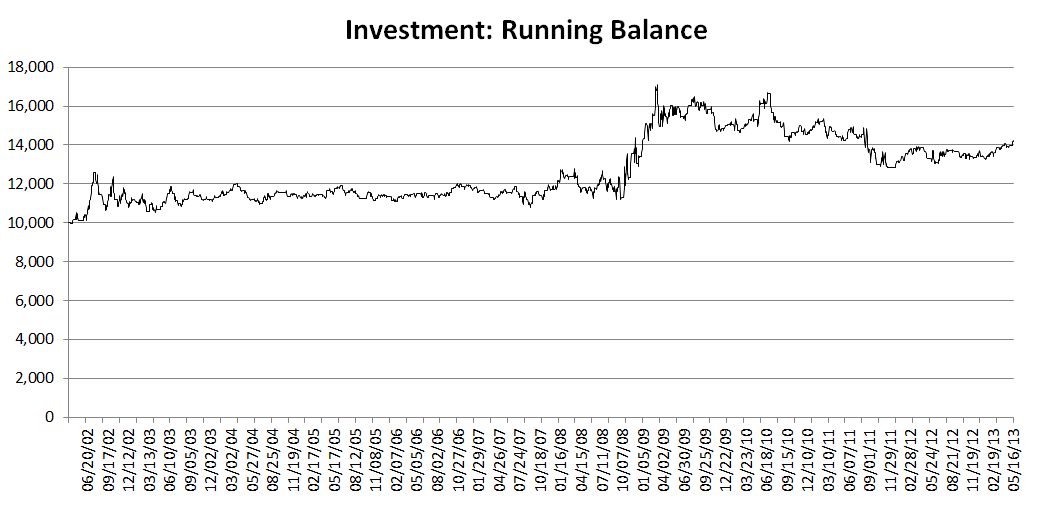
FIGURE 13: EXCEL, RUNNING BALANCE, Fast Momentum=FALSE. Here are sample results for the running balance with the user controls as set in Figure 11 (that is, fast momentum=false).
In his article, Kaufman presents us with a flexible system with eight controls that influence the trade decision logic. Here, we have explored one of the eight. Enjoy!
The spreadsheet file for this Traders’ Tip can be downloaded below. To successfully download it, follow these steps:
- Right-click on the Excel file link, then
- Select “save as” to place a copy of the spreadsheet file on your hard drive.
—Ron McAllister
Excel and VBA programmer
rpmac_xltt@sprynet.com
BACK TO LIST
Originally published in the June 2014 issue of
Technical Analysis of Stocks & Commodities magazine.
All rights reserved. © Copyright 2014, Technical Analysis, Inc.


