TRADERS’ TIPS
July 2014

For this month’s Traders’ Tips, the focus is mainly Sylvain Vervoort’s article in this issue, “Exploring Charting Techniques, Part 1,” with some Traders’ Tips focusing on topics from recent issues instead. Here we present the July 2014 Traders’ Tips code with possible implementations in various software.
Code for NinjaTrader is already provided in Vervoort’s article. S&C subscribers will find that code at the Subscriber Area of our website. Presented here is an overview of some possible implementations for other software as well.
Traders’ Tips code is provided to help the reader implement a selected technique from an article in this issue or another recent issue. The entries are contributed by various software developers or programmers for software that is capable of customization.

TRADESTATION: JULY 2014
In “Exploring Charting Techniques, Part 1” in this issue, author Sylvain Vervoort presents an overview of some of the many bar types that traders can choose to use while making their trading decisions. Vervoort starts with simple line charts, which are nothing more than a line connecting points that represent some aspect of the market that changes. Each point is a line segment endpoint, and the offset between points is the chart interval. Vervoort states he doesn’t find these useful, as too much data is ignored. Next, he reviews open, high, low, close (OHLC) representations: bar, tick bar, and candlestick charts. Both are able to display the OHLC data, with differing visual emphasis for the trader. The author states he feels these bar types present the trader with too much noise.
The author then reviews two bar types that might offer an answer to the noise issue: range bars and renko bars. He raises three issues with regard to autotrading and backtesting. First, he expresses that he doesn’t like the lack of wicks. Next, he points out that the actual open and close may not be the same as those displayed on the chart. Finally, he states that gaps could be filled with untradable virtual bars.
All of these bar types discussed in Vervoort’s article can be found in the TradeStation platform. The user can choose the type to use by formatting the symbol and selecting the desired bar types. As the author points out, advanced chart types can be automated only when the limitations are fully understood. More on strategy backtesting and automation of TradeStation’s range, renko, and other advanced chart types can be found in the advanced chart type entry within platform help. (To reach this area: From the TradeStation platform help menu, select “platform help.”)
For more information about EasyLanguage in general, see https://www.tradestation.com/EL-FAQ.
This article is for informational purposes. No type of trading or investment recommendation, advice, or strategy is being made, given, or in any manner provided by TradeStation Securities or its affiliates.
—Doug McCrary & Mark Mills
TradeStation Securities, Inc.
www.TradeStation.com
BACK TO LIST

eSIGNAL: JULY 2014
For this month’s Traders’ Tip, we’ve provided the formulas RelativeVolume.efs and FreedomOfMovement.efs based on the formulas described in Melvin Dickover’s article in the April 2014 issue of S&C, “Evidence-Based Support & Resistance.”
The studies contain formula parameters that may be configured through the edit chart window (right-click on the chart and select “edit chart”). A sample chart is shown in Figure 1.
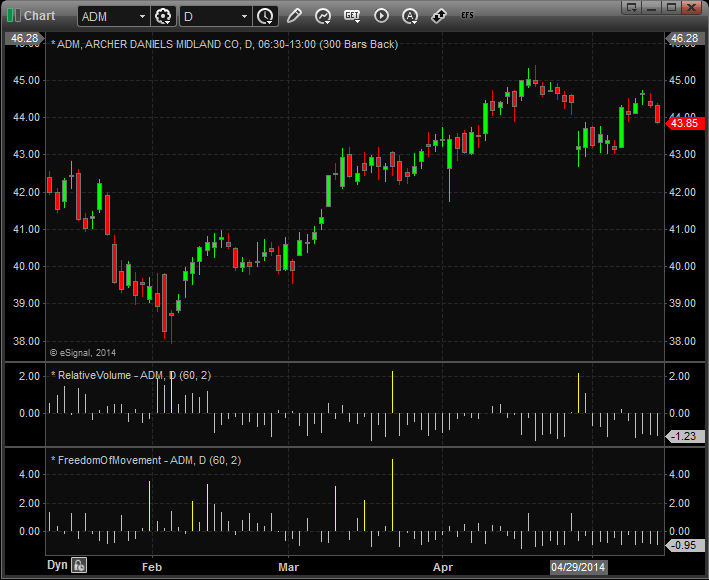
FIGURE 1: eSIGNAL
To discuss this study or download a complete copy of the formula code, please visit the EFS library discussion board forum under the forums link from the support menu at www.esignal.com or visit our EFS KnowledgeBase at https://www.esignal.com/support/kb/efs/. The eSignal formula scripts (EFS) are also available for copying & pasting below.
RelativeVolume.efs
/*********************************
Provided By:
    Interactive Data Corporation (Copyright © 2014)
    All rights reserved. This sample eSignal Formula Script (EFS)
    is for educational purposes only. Interactive Data Corporation
    reserves the right to modify and overwrite this EFS file with
    each new release.

Description:
    RelativeVolume by Melvin E. Dickover:
    finds spikes of volume above numStDevs standard
    deviations of the average volume of the lookback period.

Formula Parameters:                     Default:
Period                                  60
StDevs                                  2

Version:            1.00  14/05/2014

Notes:
    The related article is copyrighted material. If you are not a subscriber
    of Stocks & Commodities, please visit www.traders.com.

**********************************/

var fpArray = new Array();

function preMain()
{
    setStudyTitle("RelativeVolume");
    setPlotType(PLOTTYPE_HISTOGRAM);

    var x = 0;

    fpArray[x] = new FunctionParameter("fpPeriod", FunctionParameter.NUMBER);
    with(fpArray[x++])
    {
        setName("Period");
        setDefault(60);
        setLowerLimit(1);
    }

    fpArray[x] = new FunctionParameter("fpNumStDevs", FunctionParameter.NUMBER);
    with(fpArray[x++])
    {
        setName("StDevs");
        setDefault(2);
    }
}

var bInit = false;
var bVersion = null;

var x_Volume = null;
var x_av = null;
var x_sd = null;
var x_relVol = null;

function main(fpPeriod, fpNumStDevs)
{
    if (bVersion == null) bVersion = verify();
    if (bVersion == false) return;

    if (!bInit)
    {
        x_Volume = volume();

        x_av = sma(fpPeriod, x_Volume);
        x_sd = efsInternal("Calc_Std", fpPeriod, x_Volume);
        x_relVol = efsInternal("Calc_Rel", x_Volume, x_av, x_sd);

        bInit = true;
    }

    var n_RelVol = x_relVol.getValue(0);

    if (n_RelVol == null)
        return;

    if (n_RelVol > fpNumStDevs)
        setBarFgColor(Color.blue)
    else
        setBarFgColor(Color.grey);

    return n_RelVol;
}

var xSMA = null;

function Calc_Std(nPeriod, xSourse)
{
    if (getBarState() == BARSTATE_ALLBARS)
    {
        xSMA = sma(nPeriod, xSourse);
    }

    var nSMA = xSMA.getValue(0);

    if (nSMA == null)
        return;

    var nSum = 0;

    for (var i = 0; i < nPeriod; i++)
    {
       var nSource = xSourse.getValue(-i);

       if (nSource == null)
           return;

       var nVal = Math.pow((nSource - nSMA), 2);

       nSum += nVal;
    }

    var nReturnValue = Math.sqrt(nSum / nPeriod);

    return nReturnValue;
}

function Calc_Rel(xSourse, xSourseAV, xSourseSD)
{
    var nSourse = xSourse.getValue(0);
    var nSourseAV = xSourseAV.getValue(0);
    var nSourseSD = xSourseSD.getValue(0);

    if(nSourse == null || nSourseAV == null || nSourseSD == null)
        return;

    var nReturnValue = (nSourse - nSourseAV) / nSourseSD;

    return nReturnValue;
}

function verify()
{
    var b = false;
    if (getBuildNumber() < 779)
    {
        drawTextAbsolute(5, 35, "This study requires version 8.0 or later.",
            Color.white, Color.blue, Text.RELATIVETOBOTTOM|Text.RELATIVETOLEFT|Text.BOLD|Text.LEFT,
            null, 13, "error");
        drawTextAbsolute(5, 20, "Click HERE to upgrade.@URL=https://www.esignal.com/download/default.asp",
            Color.white, Color.blue, Text.RELATIVETOBOTTOM|Text.RELATIVETOLEFT|Text.BOLD|Text.LEFT,
            null, 13, "upgrade");
        return b;
    }
    else
    {
        b = true;
    }

    return b;
}
FreedomOfMovement.efs
/*********************************
Provided By:
    Interactive Data Corporation (Copyright © 2014)
    All rights reserved. This sample eSignal Formula Script (EFS)
    is for educational purposes only. Interactive Data Corporation
    reserves the right to modify and overwrite this EFS file with
    each new release.

Description:
    FreedomOfMovement by Melvin E. Dickover:
    computes how much effort to move the close up or down from previous bar.
    Effort is defined as the normalized relative volume.
    Effect is the normalized percent of (close - previous close).
    The resulting Freedom of Movement is the relative ratio of effort/effect.
    The larger the spike in FoM, the more the restriction of freedom of movement.
    Price movement is easy when FoM is small or negative,
    that is, only a small volume required to move price appreciably.

Formula Parameters:                     Default:
Period                                  60
StDevs                                  2

Version:            1.00  14/05/2014

Notes:
    The related article is copyrighted material. If you are not a subscriber
    of Stocks & Commodities, please visit www.traders.com.

**********************************/

var fpArray = new Array();

function preMain()
{
    setStudyTitle("FreedomOfMovement");
    setPlotType(PLOTTYPE_HISTOGRAM);

    var x = 0;

    fpArray[x] = new FunctionParameter("fpPeriod", FunctionParameter.NUMBER);
    with(fpArray[x++])
    {
        setName("Period");
        setDefault(60);
        setLowerLimit(1);
    }

    fpArray[x] = new FunctionParameter("fpNumStDevs", FunctionParameter.NUMBER);
    with(fpArray[x++])
    {
        setName("StDevs");
        setDefault(2);
    }
}

var bInit = false;
var bVersion = null;

var x_Volume = null;

var x_aMove = null;
var x_theMin = null;
var x_theMax = null;
var x_theMove = null;

var x_av = null;
var x_sd = null;
var x_relVol = null;

var x_theMinV = null;
var x_theMaxV = null;
var x_theVol = null;

var x_vByM = null;
var x_avF = null;
var x_sdF = null;
var x_theFoM = null;

function main(fpPeriod, fpNumStDevs)
{
    if (bVersion == null) bVersion = verify();
    if (bVersion == false) return;

    if (!bInit)
    {
        x_aMove = efsInternal("Calc_aMove");
        x_theMin = llv(fpPeriod, x_aMove);
        x_theMax = hhv(fpPeriod, x_aMove);
        x_theMove = efsInternal("Calc_Effort_Effect", x_aMove, x_theMin, x_theMax);

        x_Volume = volume();
        x_av = sma(fpPeriod, x_Volume);
        x_sd = efsInternal("Calc_Std", fpPeriod, x_Volume);
        x_relVol = efsInternal("Calc_Rel", x_Volume, x_av, x_sd);

        x_theMinV = llv(fpPeriod, x_relVol);
        x_theMaxV = hhv(fpPeriod, x_relVol);
        x_theVol = efsInternal("Calc_Effort_Effect", x_relVol, x_theMinV, x_theMaxV);

        x_vByM = efsInternal("Calc_vByM", x_theMove, x_theVol);

        x_avF = sma(fpPeriod, x_vByM);
        x_sdF = efsInternal("Calc_Std",fpPeriod, x_vByM);
        x_theFoM = efsInternal("Calc_Rel", x_vByM, x_avF, x_sdF);

        bInit = true;
    }

    var n_theFoM = x_theFoM.getValue(0);

    if (n_theFoM == null)
        return;

    if (n_theFoM < fpNumStDevs)
        setBarFgColor(Color.grey)
    else
        setBarFgColor(Color.blue);

    return n_theFoM;
}

var xSMA = null;

function Calc_Std(nPeriod, xSourse)
{
    if (getBarState() == BARSTATE_ALLBARS)
    {
        xSMA = sma(nPeriod, xSourse);
    }

    var nSMA = xSMA.getValue(0);

    if (nSMA == null)
        return;

    var nSum = 0;

    for (var i = 0; i < nPeriod; i++)
    {
       var nSource = xSourse.getValue(-i);

       if (nSource == null)
           return;

       var nVal = Math.pow((nSource - nSMA), 2);

       nSum += nVal;
    }

    var nReturnValue = Math.sqrt(nSum / nPeriod);

    return nReturnValue;
}

function Calc_Rel(xSourse, xSourseAV, xSourseSD)
{
    var nSourse = xSourse.getValue(0);
    var nSourseAV = xSourseAV.getValue(0);
    var nSourseSD = xSourseSD.getValue(0);

    if(nSourse == null || nSourseAV == null || nSourseSD == null)
        return;

    var nReturnValue = (nSourse - nSourseAV) / nSourseSD;

    return nReturnValue;
}

var xClose = null;

function Calc_aMove()
{
    if (getBarState() == BARSTATE_ALLBARS)
    {
        xClose = close();
    }

    var nClose = xClose.getValue(0);
    var nPrevClose = xClose.getValue(-1);

    if (nClose == null || nPrevClose == null)
        return;

    var nReturnValue = Math.abs((nClose - nPrevClose) / nPrevClose);

    return nReturnValue;
}

function Calc_Effort_Effect(xSourse, xSourceMin, xSourceMax)
{
    var nSourse = xSourse.getValue(0);
    var nSourseMin = xSourceMin.getValue(0);
    var nSourseMax = xSourceMax.getValue(0);

    if(nSourse == null || nSourseMin == null || nSourseMax == null)
        return;

    var nReturnValue = 0;

    if (nSourseMax > nSourseMin)
        nReturnValue = 1 + ((nSourse - nSourseMin) * (10 - 1)) / (nSourseMax - nSourseMin);

    return nReturnValue;
}

function Calc_vByM(xSourceMove, xSourceVol)
{
    var nSourceMove = xSourceMove.getValue(0);
    var nSourceVol = xSourceVol.getValue(0);

    if(nSourceMove == null || nSourceVol == null)
        return;

    return nSourceVol / nSourceMove;
}

function verify()
{
    var b = false;
    if (getBuildNumber() < 779)
    {
        drawTextAbsolute(5, 35, "This study requires version 8.0 or later.",
            Color.white, Color.blue, Text.RELATIVETOBOTTOM|Text.RELATIVETOLEFT|Text.BOLD|Text.LEFT,
            null, 13, "error");
        drawTextAbsolute(5, 20, "Click HERE to upgrade.@URL=https://www.esignal.com/download/default.asp",
            Color.white, Color.blue, Text.RELATIVETOBOTTOM|Text.RELATIVETOLEFT|Text.BOLD|Text.LEFT,
            null, 13, "upgrade");
        return b;
    }
    else
    {
        b = true;
    }

    return b;
}
—Eric Lippert
eSignal, an Interactive Data company
800 779-6555, www.eSignal.com
BACK TO LIST

WEALTH-LAB: JULY 2014
In Wealth-Lab, the renko charting style can be applied to the current chart from the Function toolbar → ChartStyle. To have the chart approximate the modified renko style as presented in “Exploring Charting Techniques, Part 1” by Sylvain Vervoort in this issue, just strike ctrl+Y (or choose chart style settings from the chart’s right-click context menu) and enable “overlay HLC chart.” The way the Wealth-Lab backtesting engine is designed, trades at market price occur at the opening price and the correct market prices are always reflected for trade execution when working with renko bricks.
As an example of applying a trading technique to the modified renko charts, Wealth-Lab users can download the “renko basic [Rev A]” strategy and switch the chart to HLC view as instructed. Downloading a public strategy is as easy as invoking the open strategy dialog (ctrl+O), clicking the download button, making sure you’ll get all available items by unchecking “Published since...”, and clicking begin download.
A sample chart is shown in Figure 2.
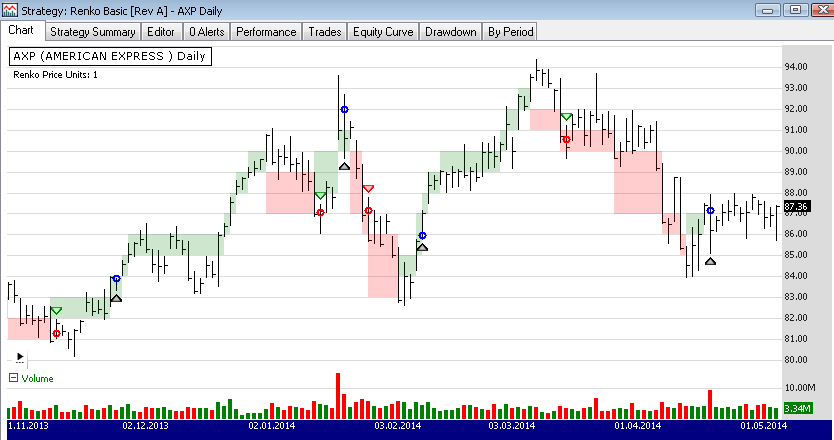
FIGURE 2: WEALTH-LAB, RENKO CHART. This sample daily chart of American Express (AXP) shows a tradable renko chart.
—Eugene, Wealth-Lab team
MS123, LLC
www.wealth-lab.com
BACK TO LIST

AMIBROKER: JULY 2014
In “Exploring Charting Techniques, Part 1” in this issue, author Sylvain Vervoort presents modified renko charts that include high/low wicks and that reflect the correct open price for renko reversal points.
A ready-to-use formula for AmiBroker is shown below, based on Vervoort’s article. You can select between normal or modified renko charts using the parameters window.
// Modified Renko Chart with custom date axis
// and high/low winks
// Loosely based on Renko chart formula by G. Kavanagh
// from AmiBroker on-line formula library (id=521)
// Modifications & fixes TJ 2014

function FillRun( dir, num, changedir )
{
   global i, j, modified, dt, RKC, RKO, RKD, RKH, RKL;

   for ( x = 1; x <= num AND j < BarCount - 1; x++ )
   {
     j++;

     extra = ( changedir AND x == 1 ) * dir;

     RKC[ j ] = RKC[ j - 1 ] + dir + extra;
     RKO[ j ] = RKC[ j - 1 ] + IIf( modified, 0, extra );
     RKD[ j ] = dt[ i ];
     RKH[ j ] = High[ i - 1 ];
     RKL[ j ] = Low[ i - 1 ];
   }
}

SetBarsRequired( sbrAll, sbrAll );
Brick = Param( "Brick Size", 0.001, 0.0001, 1.00, 0.001 );
reverse = 2;
intra = ParamToggle( "Intraday", "No|Yes", 0 );
modified = ParamToggle( "Modified", "No|Yes", 0 );

// Convert the closing price to rising and falling rounded bricks
CF = ceil( C / Brick );
CR = floor( C / Brick );

// initialize first element
j = 0;
RKC[j] = CF[0];
RKO[j] = CF[0] + 1;
RKD = 0;
RKH = 0;
RKL = 0;
dt = IIf( intra, floor( TimeNum() / 100 ), DateNum() );

dir = -1; // 1 is up, -1 is down

// Loop to produce the Renko values in number of bricks

for ( i = 1; i < BarCount - 1; i++ )
{
 if ( j >= BarCount ) break; // no more room -> finish

 if ( CF[i] <= RKC[j] - 1 AND dir < 0 ) // Continue down
 {
    num = RKC[j] - CF[i];
    FillRun( dir, num, False );
 }
 else
 if ( CR[i] >= RKC[j] + Reverse AND dir < 0 ) // Change down to up
 {
    num = CR[i] - RKC[j];
    dir = 1;
    FillRun( dir, num, True );
 }
 else
 if ( CR[i] >= RKC[j] + 1 AND dir > 0 ) // Continue Up
 {
    num = CR[i] - RKC[j];
    FillRun( dir, num, False );
 }
 else
 if ( CF[i] <= RKC[j] - Reverse AND dir > 0 ) // Change up to down
 {
    num = RKC[j] - CF[i];
    dir = -1;
    FillRun( dir, num, True );
 }
}

// move the chart to right end of chart space, ie last brick on last bar position
delta =  BarCount - 1 - j;

RKC = Ref( RKC, -delta );
RKO = Ref( RKO, -delta );
RKD = Ref( RKD, -delta );
RKH = Ref( RKH, -delta );
RKL = Ref( RKL, -delta );

C = RKC * Brick;
O = RKO * Brick;
H = IIf( modified, RKH, Max( C, O ) );
L = IIf( modified, RKL, Min( C, O ) );

Plot( C, "", IIf( C > O, colorGreen, colorRed ), styleCandle );

xnum = floor( RKD / 100 );
XChange = IIf( xnum != Ref( xnum, -1 ), 1, Null );

Plot( XChange, "", colorGrey50, styleHistogram | styleOwnScale, 0, 1 );

// Draw renko-date axis
MonthNames = "Jan,Feb,Mar,Apr,May,Jun,Jul,Aug,Sep,Oct,Nov,Dec";
fvb = FirstVisibleValue( BarIndex() );
lvb = LastVisibleValue( BarIndex() );

for ( i = fvb; i < lvb; i++ )
{
  if ( XChange[ i ] )
  {
     if ( intra )
         datetext = StrFormat( "%02gh", floor ( RKD[ i ] / 100 ) );
     else
     if ( ( xnum[ i ] % 100 ) == 1 )
         datetext = StrFormat( "%04.0f", 1900 + ( xnum[ i ] / 100 ) );
     else
         datetext = StrExtract( MonthNames, ( xnum[ i ] % 100 ) - 1 );

     PlotText( datetext  , i, LowestVisibleValue( Low ), colorGrey50, 			   colorWhite, -20 );
  }
}

Title = Name() + StrFormat( " - 20%06.0f", RKD % 1000000 ) + " - Renko Chart : Last Value = " + RKC * Brick + " H: " + RKH + " L: " + RKL + ", Brick Size = " + Brick;

GraphXSpace = 5;
A sample chart is shown in Figure 3.
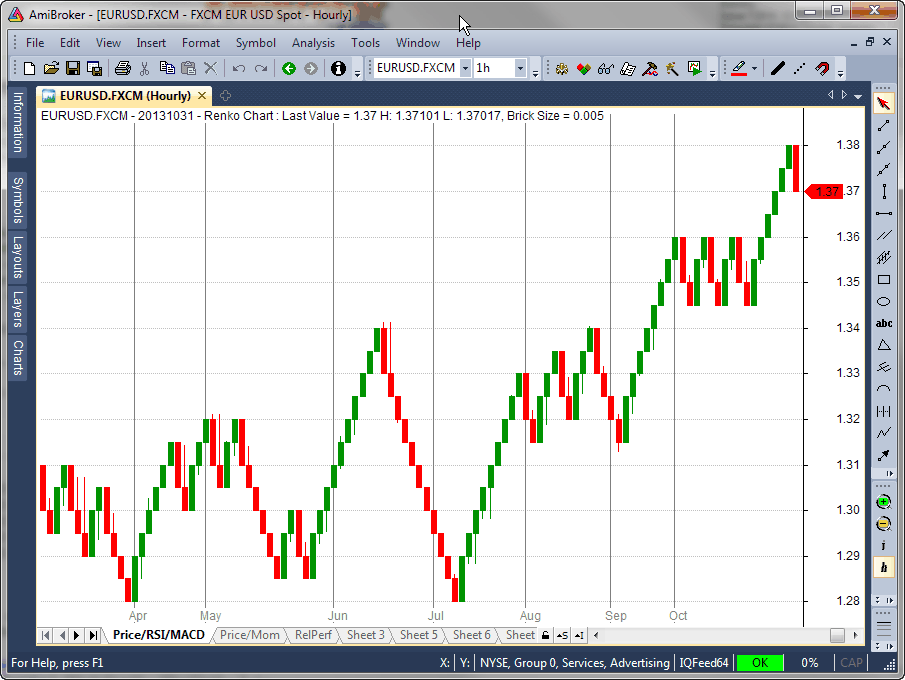
FIGURE 3: AMIBROKER, RENKO CHART. Here is a sample chart showing a modified renko chart of EUR/USD.
—Tomasz Janeczko, AmiBroker.com
www.amibroker.com
BACK TO LIST

NEUROSHELL TRADER: JULY 2014
The renko bar charts described by Sylvain Vervoort in his article in this issue, “Exploring Charting Techniques, Part 1,” may be implemented in NeuroShell Trader through the use of the InterChart Tools Renko add-in. The InterChart Tools Renko bars are virtual and perform their calculations using the same methods as traditional renko bars, but once a trading signal is generated by the renko bar, both the trade and fill are correctly displayed on the open of the next bar of the base chart.
To replicate the sample chart shown in Vervoort’s article of the S&P futures, simply select new indicator from the Insert menu and enter the following in the appropriate locations of the indicator parameters:
IctRenko High (0.25, 1, 1, 3, high, low, volume)
		(both dots and lines displayed on the chart)
IctRenko Low (0.25, 1, 1, 3, high, low, volume)
		(both dots and lines displayed on the chart)
IctRenko Volume (0.25, 1, 1, 3, high, low, volume)
IctRenko Streak Counter (0.25, 1, 1, 3, high, low, volume)
The value 0.25 corresponds to the size of the base chart’s range bar, which is used to create the virtual renko bars. It is the virtual (or actual) tick size. You will need to specify a size that will not be overcome by noise for the security that is being traded. In the example shown, it is the actual tick size. The next two parameters represent the number of ticks used to calculate the up part of the renko bar, followed by the number of ticks used to compute the down part. The “3” represents a multiplier that is applied to the described renko bar’s up/down ratio to realize its final size. This enables the indicators to use a different number of ticks for the up and down side of the renko bars. Since any bar’s function is to absorb noise, and rising price jitter is often different from falling price jitter, our renko bars permit an asymmetrical definition to accommodate this.
The renko volume indicator displays the correct volume on the base chart that corresponds to the renko bars. The streak counter indicator displays the number of consecutive up or down renko bars that appear in sequence on the chart.
NeuroShell renko bars may, at the user’s discretion, be controlled by the optimizer to identify the optimal bar size and noise absorption for a given algorithm or equity.
Users of NeuroShell Trader can go to the Stocks & Commodities section of the NeuroShell Trader free technical support website to download a copy of this or any previous Traders’ Tips.
A sample chart is shown in Figure 4.
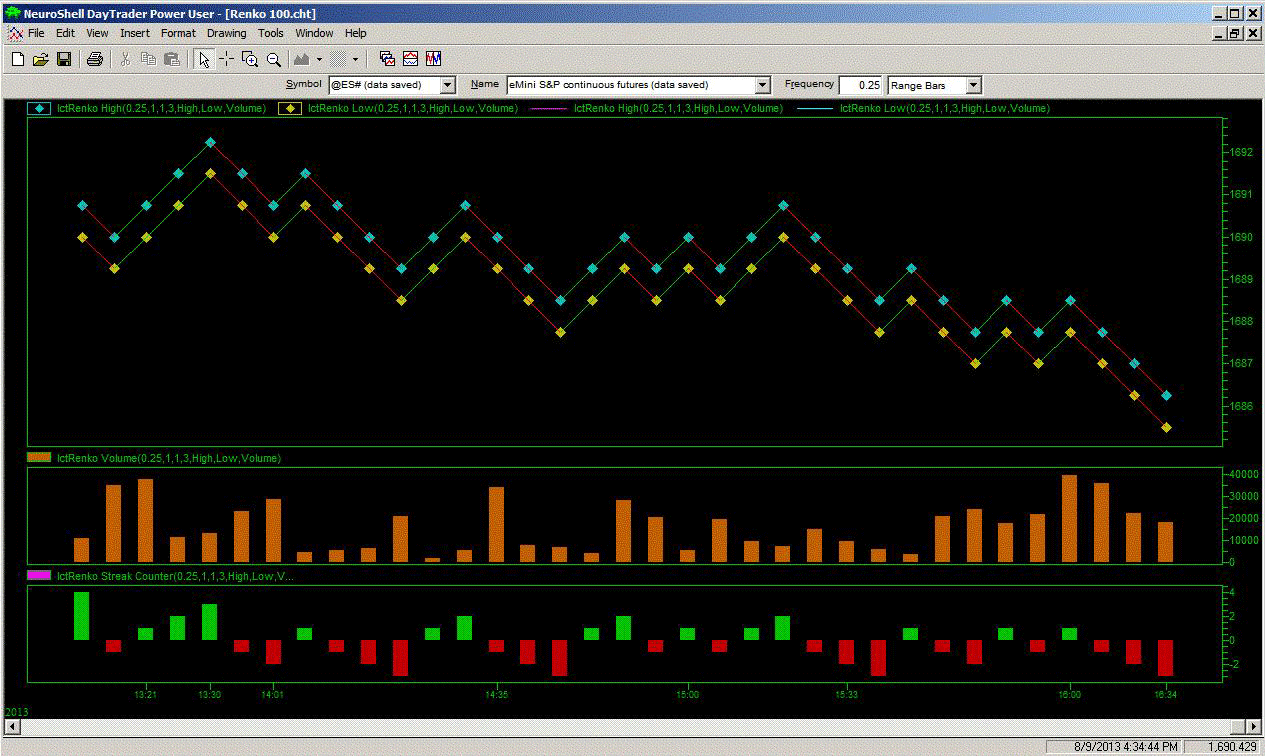
FIGURE 4: NEUROSHELL TRADER, RENKO BARS. This NeuroShell Trader chart shows InterChart Tools renko bars.
—Marge Sherald, Ward Systems Group, Inc.
301 662-7950, sales@wardsystems.com
www.neuroshell.com
BACK TO LIST

AIQ: JULY 2014
The AIQ code I am providing this month is based on Mike Siroky’s article from the May 2014 issue of STOCKS & COMMODITIES, “Wilder’s RSI: Extending the Time Horizon.” The code is provided at www.TradersEdgeSystems.com/traderstips.htm and is also shown at the end of this tip.
I am providing a system that uses Siroky’s adjustable RSI bands that automatically adjust to the appropriate level for the input RSI length. The system is very simple:
- Buy the next bar at the market open when the RSI is less than the lower confidence interval band (RSI_CILOW)
- Exit the long position on the next bar at the market open when the RSI is greater than the upper confidence interval band (RSI_CIUP)
- For shorting, reverse these rules.
I have a parameter that allows testing long-only, short-only, or both long and short. The system lost when the short side was allowed to trade.
Figure 5 shows the AIQ EDS summary long-only backtest report using the NASDAQ 100 list of stocks over the period 5/11/2000 to 5/12/2014. Neither commission nor slippage has been subtracted from these results. In running this test, I used a capital protection of 98%, which is equivalent to a 2% stop-loss using the close. All entries and exits are at the next open. I could not get the short side to show a profit even with added market timing filters for trend on the NASDAQ 100 index.
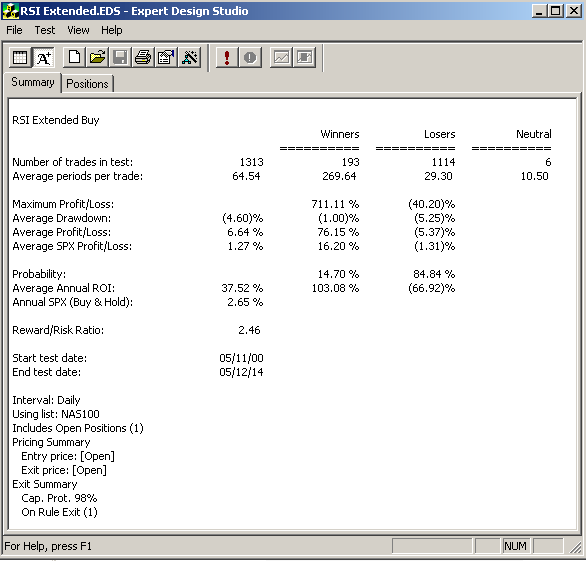
FIGURE 5: AIQ. Here is the AIQ EDS summary long-only backtest report using the NASDAQ 100 list of stocks over the period 5/11/2000 to 5/12/2014.
The code and EDS file can be downloaded from www.TradersEdgeSystems.com/traderstips.htm.
—Richard Denning
info@TradersEdgeSystems.com
for AIQ Systems
BACK TO LIST

TRADERSSTUDIO: JULY 2014
The TradersStudio code I am providing this month is based on Mike Siroky’s article from the May 2014 issue of STOCKS & COMMODITIES, “Wilder’s RSI: Extending the Time Horizon.” The code is provided at the following websites:
The following files are provided in the download:
- System RSI_EXTENDED: A trading system I created using the adjustable trading bands for the RSI that were suggested by Siroky in his article.
- Function RSI_CILOW: Returns the lower RSI trading band based on the inputs RSI length and the number of standard deviations that determine the confidence interval.
- Function RSI_CIUP: Returns the upper RSI trading band based on the inputs RSI length and the number of standard deviations that determine the confidence interval.
The system I am providing uses the author’s adjustable RSI bands that automatically adjust to the appropriate level for the input RSI length. The system is very simple. The rules are:
- Buy the next bar at the market open when the RSI is less than the lower confidence interval band (RSI_CILOW).
- Exit the long position next bar at market open when the RSI is greater than the upper confidence interval band (RSI_CIUP).
- Reverse these rules for shorting.
I have a parameter that allows testing long-only, short-only, or both long and short. The system lost when the short side was allowed to trade.
I optimized the parameters on a sample of seven of the NASDAQ 100 stocks, and then I ran a test using all 100 of the NASDAQ 100 stocks. The equity curve trading 200 shares each of the NASDAQ 100 list of stocks, trading long only, is shown in Figure 6 together with the underwater equity curve. The drawdown during bear markets might be improved by adding a market timing index trend filter.
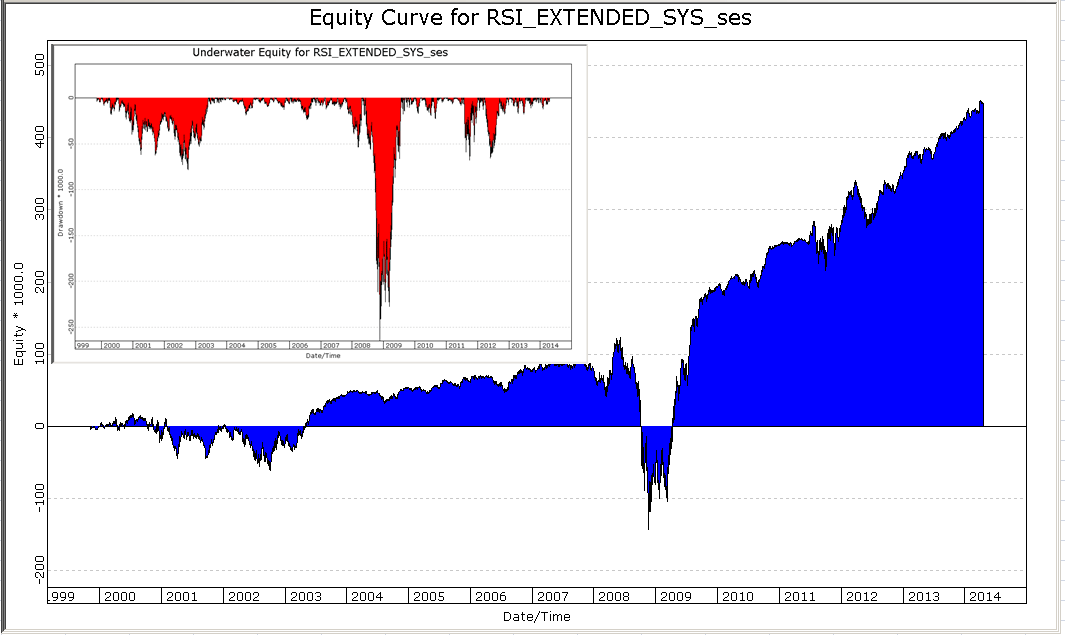
FIGURE 6: TRADERSSTUDIO, SAMPLE EQUITY CURVE. Here are sample equity and underwater equity curves trading the NASDAQ 100 list of stocks, long only, for the period 2000 through April 2014.
—Richard Denning
info@TradersEdgeSystems.com
for TradersStudio
BACK TO LIST
MICROSOFT EXCEL: JULY 2014
In “Exploring Charting Techniques, Part 1” in this issue, author Sylvain Vervoort presents his modified version of the renko bar construction method that is designed to support trend analysis in the presence of noisy-looking pricing data.
Since free, short-interval tick data for forex and other instruments is not generally available for more than one or two days back in time, I have not attempted to replicate the example charts from Vervoort’s article, which used data from October 2013.
Fortunately, we can apply the SVERenkoBars logic to end-of-day data, as I have done here. Figures 7 and 8 give us a good representation of just how effective this technique is at clearing some of the visual price noise. The price shapes align fairly well; the reported time stamps, not so much.
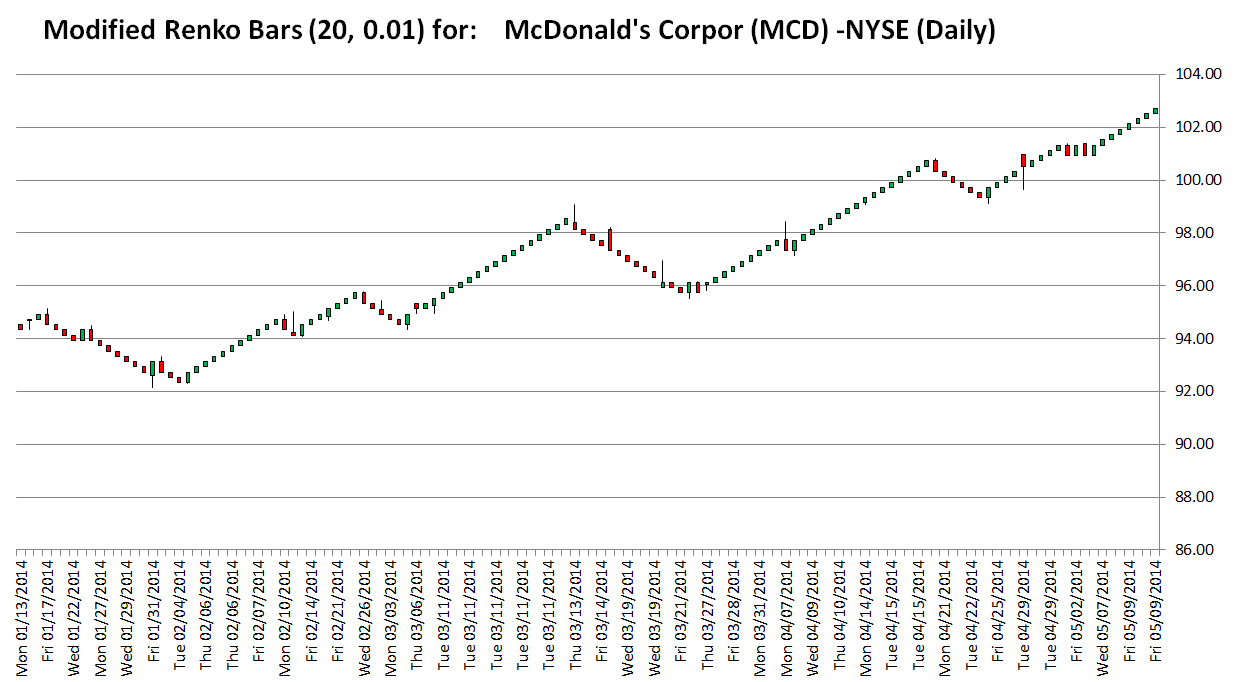
FIGURE 7: EXCEL, MODIFIED RENKO BARS. This sample chart shows modified renko bars based on Sylvain Vervoort’s technique using daily data (end-of-day [EOD] ticks). See the SVERenkoBarsChart tab in the spreadsheet.
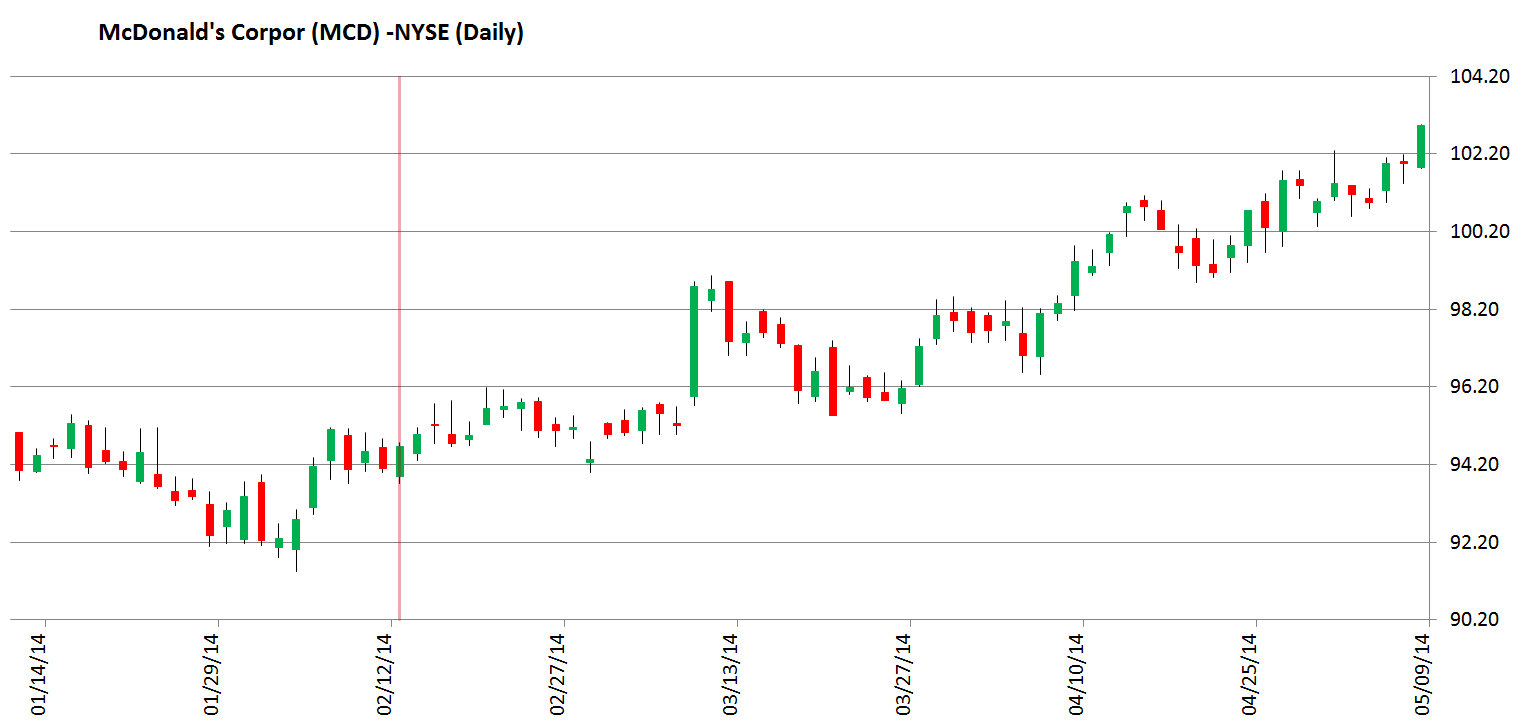
FIGURE 8: EXCEL, DAILY PRICE CANDLES. This sample chart shows daily price candles (“ticks”) for approximately the same time period as the renko bars shown in Figure 7.
Generating Excel cell formulas to build renko bars was going to take far too long and make for a very convoluted spreadsheet. So I opted to create a user-defined array function (UDF) with VBA to build the bars.
Output from this array function occupies cell range J33:Q2832. That is the area with headers in light blue titled “modified renko bars” in Figure 9.
The advantage of the array function approach is that a large amount of data can be passed to a single execution of the function, and that single execution can return a lot of processed data to a large area of the spreadsheet. For this Traders’ Tip, the computation is very fast. And, as you can see in Figure 9, in terms of columns of formulas and values, this is the least-cluttered-looking spreadsheet to date.
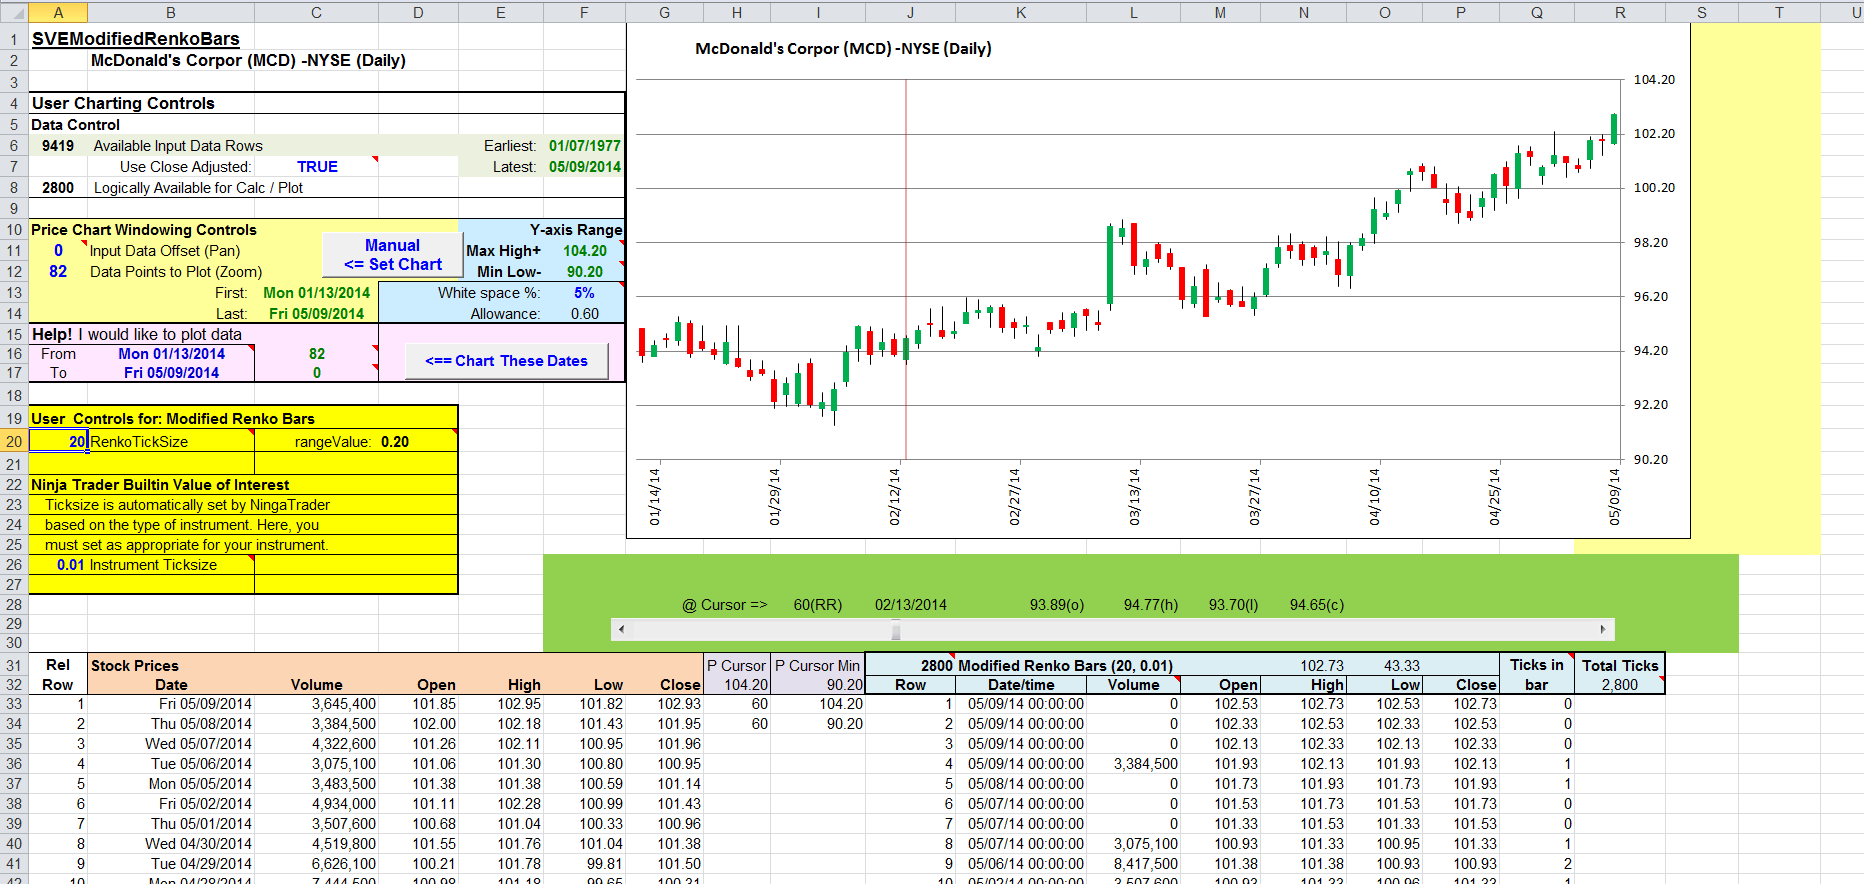
FIGURE 9: EXCEL, NO CLUTTER. This is easily the least-cluttered-looking spreadsheet.
Inside a user-defined function, the VBA code can be every bit as procedural and complex as, for example, the NinjaTrader code that Vervoort provides in his article in this issue. In fact, the main line of the VBA code for this user-defined function looks very much like the main line of Vervoort’s NinjaTrader code.
In the background are two user-defined VBA class modules, one class to represent the bars and one to make functional routines available to our UDF mainline that is designed to approximate the names and actions of the bar creation, storage, and manipulation functions used in Vervoort’s example code.
As to renko bar user controls: There are only two on this spreadsheet. The RenkoTickSize value, which is the number of “instrument” ticks per renko brick, and the instrument tick size. The instrument tick size is a NinjaTrader built-in feature that is automatically set in NinjaTrader based on the type of instrument the user is analyzing at any given time. Since Excel is not NinjaTrader, the spreadsheet user must set this stand-in for the NinjaTrader instrument tick size appropriately. For stocks, the NinjaTrader default is 0.01. For forex instruments, the NinjaTrader default is 0.0001.
The product of these two user-supplied values — the RenkoTickSize and instrument tick size — sets the “range value” or “brick size” used in the renko bar creation computations.
Outwardly calm-looking, this spreadsheet is a lot like the duck on the pond — there is a lot happening under the surface. Yet it is all out of sight, driven by the VBA user-defined function code and user-defined class routines.
To get into the VBA editor and look at these routines, open the spreadsheet. Then press the ALT key and the F11 key at the same time. This should open the VBA editor (see Figure 10). If it does not, you may need to change a couple of your Excel macro-related options. For Windows-based Excel, the path to the macro-related settings is:
File Tab→Options→Trust Center→Trust Center Settings→Macro Settings
On this panel, check the box next to “Trust access to the VBA object model.” And as long as you are already here, I recommend selecting “Disable all macros with notification” so that you get to decide if macros are allowed to run when you open a new spreadsheet for the first time. Close the options panels and return to the home tab.
Now ALT+F11 should open the VBA editor.
Next, if necessary, in the left column, click the “+” box next to the modules and class modules to expand the lists (Figure 10).
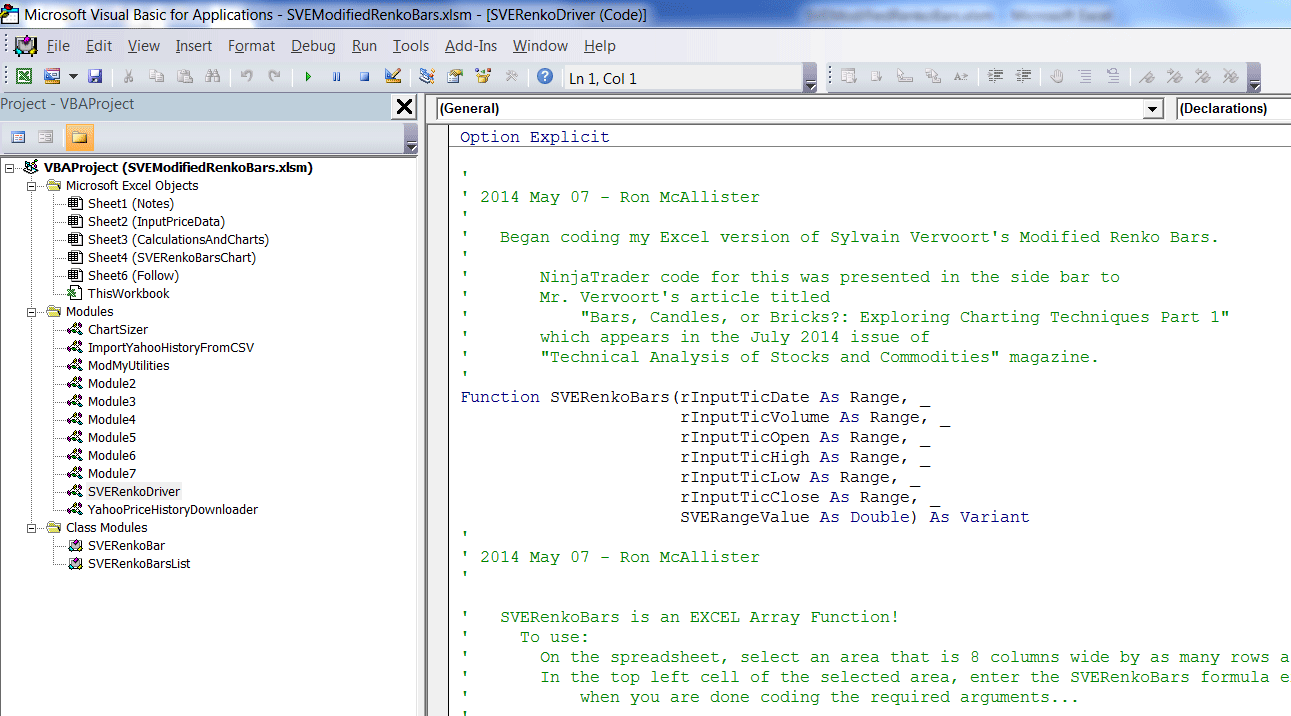
FIGURE 10: EXCEL, VBA EDITOR. You can browse the VBA code that was used to build the modified renko bars.
Doubleclick on SVERenkoDriver to open code for the user-defined array function mainline. Compare what you see in the SEVRenkoBars function to Vervoort’s NinjaTrader example code.
Doubleclick on SVERenkoBar to see the VBA-class definition for our renko bar object, and then on SVERenkoBarList to explore the VBA class methods used to create and manipulate our renko bar collection object, as the bars are built by the SEVRenkoBars function mainline and reported out to the spreadsheet at function completion.
A note on forex data: For what it’s worth, my “friend” Google and I have only found a few web-based sources for free tick-level forex data. And so far, my research implies that none of these will provide free one- and five-minute tick data older than 24 hours. Some will provide free four-hour ticks as old as three months. Many will provide end-of-day bars that go back several years. The notes tab of this month’s spreadsheet can direct you to one such website. You will need to perform a lot of manual copy & paste to get the data into a usable form for this spreadsheet or for any of my previous Traders’ Tips’ spreadsheets.
The spreadsheet file for this Traders’ Tip on modified renko bars can be downloaded here. To successfully download it, follow these steps:
- Right-click on the link to the Excel file SVEModifiedRenkoBars.xlsm, then
- Select “save as” (or “save target as”) to place a copy of the spreadsheet file on your hard drive.
—Ron McAllister
Excel and VBA programmer
rpmac_xltt@sprynet.com
BACK TO LIST
Originally published in the July 2014 issue of
Technical Analysis of STOCKS & COMMODITIES magazine.
All rights reserved. © Copyright 2014, Technical Analysis, Inc.


