TRADERS’ TIPS
September 2014

For this month’s Traders’ Tips, the focus is Charlotte Hudgin’s article in this issue, “Finding The Golden Triangle.” Here we present the September 2014 Traders’ Tips code with possible implementations in various software.
The Traders’ Tips code given here is provided to help readers implement a selected technique from an article in this or another issue. The entries are contributed by various software developers or programmers for software that is capable of customization.
Here, you can read some discussion of the techniques’ implementation by the Traders’ Tips contributors as well as some example charts.

TRADESTATION: SEPTEMBER 2014
In “Finding The Golden Triangle” in this issue, author Charlotte Hudgin introduces her setup for identifying fast-growing stocks that have paused. She analyzes both price activity and volume while looking for a reversal at the bottom of a pullback.
Here, we are providing TradeStation EasyLanguage code for both an indicator and strategy based on Hudgin’s ideas. The indicator can be used with a chart as well as with the TradeStation Scanner to search your symbol list of stocks. The author does not recommend a method for exiting her trades in the article, so when testing the strategy, you can apply one of the built-in TradeStation exit strategies or any other exit strategy that you choose. Please note that this code is compatible with TradeStation version 9.1 Update 20 and later.
Golden_Triangle (Indicator)

using elsystem ;
using elsystem.drawing ;
using elsystem.drawingobjects ;

inputs:
	Price( Close ),
	AVGLength( 50 ),
	PivotStrength( 3 ) ;

variables:
	MAValue( 0 ),
	PriceDiff( 0 ),
	PivotBar( 0 ),
	PivotPrice( 0 ),
	VolumeValue( 0 ),
	VolumeAvg( 0 ),
	PullBackBar( 0 ),
	WaitingForPivot( true ),
	WaitingForPullBack( false ),
	WaitingForConfirm( false ),
	SignalConfirmed( false ),
	InAChart( false ) ;

method void DrawPoint( int NumBarsAgo, color MyColor )
	variables: DTpoint MyPoint, TextLabel MyLabel ;
	begin
		begin
		MyPoint = DTPoint.Create( BarDateTime[NumBarsAgo],
			High[NumBarsAgo] ) ;
		MyLabel = TextLabel.Create( MyPoint, "l" ) ;
		MyLabel.Color = MyColor ;
		MyLabel.Font = Font.Create( "Wingdings", 12 ) ;
		MyLabel.VStyle = VerticalStyle.Bottom ;
		MyLabel.HStyle = HorizontalStyle.Center ;
		MyLabel.Persist = false ;
		DrawingObjects.Add( MyLabel ) ;
		end ;
	end ;

method bool PivotFound()
	variables: bool Found ;
	begin
	if PivotHighVS( 1, High, PivotStrength,
		PivotStrength, PivotStrength + 1 ) <> -1 then
		Found = true
	else
		Found = false ;
	return Found ;
	end ;

method bool WhitespaceIncreasing()
	variables: bool WhiteSpaceOK ;
	begin
	if Close[20] > MAValue[20] and
		LinearRegValue( PriceDiff[PivotStrength],
			20, PivotStrength )
		> LinearRegValue( PriceDiff[PivotStrength],
			20, PivotStrength + 20 ) then
		WhiteSpaceOK = true
	else
		WhiteSpaceOK = false ;
	return WhiteSpaceOK ;
	end ;

method bool VolumeIncreasing( int NumBars )
	variables: bool VolumeInc, int Count ;
	begin
	count = 0 ;
	VolumeInc = false ;
	for Value1 = 0 to NumBars - 1
		begin
		if VolumeValue[Value1] > VolumeAvg[Value1] then
			count += 1 ;
		end ;
	if Count >= NumBars * .5 then
		VolumeInc = true
	else
		VolumeInc = false ;
	return VolumeInc ;
	end ;

method int BarsSincePivot()
	begin
	return CurrentBar - PivotBar ;
	end ;

method int BarsSincePullBack()
	begin
	return CurrentBar - PullBackBar ;
	end ;

method bool VolumeConfirms ()
	begin
	return VolumeValue > VolumeAvg * 1.1 ;
	end ;

if BarType >= 2 and BarType < 5 then
	VolumeValue = Volume
else
	VolumeValue = Ticks ;

once
	begin
	InAChart = GetAppInfo( aiApplicationType ) = cChart ;
	end ;

MAValue = Average( Close, AVGLength ) ;
VolumeAvg = Average( VolumeValue, AVGLength ) ;
PriceDiff = ( Price - MAValue ) ;

if WaitingForPivot and PivotFound()
	and WhitespaceIncreasing() then
	begin
	if InAChart then
		DrawPoint( PivotStrength, Color.LightSeaGreen ) ;
	WaitingForPivot = false ;
	WaitingForPullBack = true ;
	PivotBar = BarNumber[PivotStrength] ;
	PivotPrice = High[PivotStrength] ;
	end ;

if WaitingForPullBack then
	begin
	if BarsSincePivot() > 20 then
		begin
		WaitingForPullBack = false ;
		WaitingForPivot = true ;
		end
	else if Low <= MAValue then
		begin
		PullBackBar = CurrentBar ;
		if BarsSincePivot() <= 3 then
			begin
			WaitingForPullBack = false ;
			WaitingForConfirm = true ;
			end
		else
			begin
			if VolumeIncreasing( BarsSincePivot() ) then
				begin
				WaitingForPullBack = false ;
				WaitingForPivot = true ;
				end
			else
				begin
				WaitingForPullBack = false ;
				WaitingForConfirm = true ;
				end ;
			end ;
		end ;
	end ;

if WaitingForConfirm then
	begin
	if BarsSincePullBack() > 15
		or Close > PivotPrice * 1.05 then
		begin
		WaitingForConfirm = false ;
		WaitingForPivot = true ;
		if InAChart then
			DrawPoint( 0, Color.Coral ) ;
		end
	else
		begin
		if ( BarsSincePullBack() = 0 or Close > Close[1] )
			and Close > MAValue and VolumeConfirms() then
			begin
			SignalConfirmed = true ;
			WaitingForConfirm = false ;
			if InAChart then
				DrawPoint( 0, Color.Green ) ;
			end ;
		end ;
	end ;

if SignalConfirmed then
	begin
	Alert( "Confirmed Signal" ) ;
	SignalConfirmed = false ;
	WaitingForPivot = true ;
	end ;


Golden_Triangle (Strategy)

using elsystem ;
using elsystem.drawing ;
using elsystem.drawingobjects ;

inputs:
	Price( Close ),
	AVGLength( 50 ),
	PivotStrength( 3 ) ;

variables:
	MAValue( 0 ),
	PriceDiff( 0 ),
	PivotBar( 0 ),
	PivotPrice( 0 ),
	VolumeValue( 0 ),
	VolumeAvg( 0 ),
	PullBackBar( 0 ),
	WaitingForPivot( true ),
	WaitingForPullBack( false ),
	WaitingForConfirm( false ),
	SignalConfirmed( false ),
	InAChart( false ) ;

method void DrawPoint( int NumBarsAgo, color MyColor )
	variables: DTpoint MyPoint, TextLabel MyLabel ;
	begin
		begin
		MyPoint = DTPoint.Create( BarDateTime[NumBarsAgo],
			High[NumBarsAgo] ) ;
		MyLabel = TextLabel.Create( MyPoint, "l" ) ;
		MyLabel.Color = MyColor ;
		MyLabel.Font = Font.Create( "Wingdings", 12 ) ;
		MyLabel.VStyle = VerticalStyle.Bottom ;
		MyLabel.HStyle = HorizontalStyle.Center ;
		MyLabel.Persist = false ;
		DrawingObjects.Add( MyLabel ) ;
		end ;
	end ;

method bool PivotFound()
	variables: bool Found ;
	begin
	if PivotHighVS( 1, High, PivotStrength,
		PivotStrength, PivotStrength + 1 ) <> -1 then
		Found = true
	else
		Found = false ;
	return Found ;
	end ;

method bool WhitespaceIncreasing()
	variables: bool WhiteSpaceOK ;
	begin
	if Close[20] > MAValue[20] and
		LinearRegValue( PriceDiff[PivotStrength],
			20, PivotStrength )
		> LinearRegValue( PriceDiff[PivotStrength],
			20, PivotStrength + 20 ) then
		WhiteSpaceOK = true
	else
		WhiteSpaceOK = false ;
	return WhiteSpaceOK ;
	end ;

method bool VolumeIncreasing( int NumBars )
	variables: bool VolumeInc, int Count ;
	begin
	count = 0 ;
	VolumeInc = false ;
	for Value1 = 0 to NumBars - 1
		begin
		if VolumeValue[Value1] > VolumeAvg[Value1] then
			count += 1 ;
		end ;
	if Count >= NumBars * .5 then
		VolumeInc = true
	else
		VolumeInc = false ;
	return VolumeInc ;
	end ;

method int BarsSincePivot()
	begin
	return CurrentBar - PivotBar ;
	end ;

method int BarsSincePullBack()
	begin
	return CurrentBar - PullBackBar ;
	end ;

method bool VolumeConfirms ()
	begin
	return VolumeValue > VolumeAvg * 1.1 ;
	end ;

if BarType >= 2 and BarType < 5 then
	VolumeValue = Volume
else
	VolumeValue = Ticks ;

once
	begin
	InAChart = GetAppInfo( aiApplicationType ) = cChart ;
	end ;

MAValue = Average( Close, AVGLength ) ;
VolumeAvg = Average( VolumeValue, AVGLength ) ;
PriceDiff = ( Price - MAValue ) ;

if WaitingForPivot and PivotFound()
	and WhitespaceIncreasing() then
	begin
	if InAChart then
		DrawPoint( PivotStrength, Color.LightSeaGreen ) ;
	WaitingForPivot = false ;
	WaitingForPullBack = true ;
	PivotBar = BarNumber[PivotStrength] ;
	PivotPrice = High[PivotStrength] ;
	end ;

if WaitingForPullBack then
	begin
	if BarsSincePivot() > 20 then
		begin
		WaitingForPullBack = false ;
		WaitingForPivot = true ;
		end
	else if Low <= MAValue then
		begin
		PullBackBar = CurrentBar ;
		if BarsSincePivot() <= 3 then
			begin
			WaitingForPullBack = false ;
			WaitingForConfirm = true ;
			end
		else
			begin
			if VolumeIncreasing( BarsSincePivot() ) then
				begin
				WaitingForPullBack = false ;
				WaitingForPivot = true ;
				end
			else
				begin
				WaitingForPullBack = false ;
				WaitingForConfirm = true ;
				end ;
			end ;
		end ;
	end ;

if WaitingForConfirm then
	begin
	if BarsSincePullBack() > 15
		or Close > PivotPrice * 1.05 then
		begin
		WaitingForConfirm = false ;
		WaitingForPivot = true ;
		if InAChart then
			DrawPoint( 0, Color.Coral ) ;
		end
	else
		begin
		if ( BarsSincePullBack() = 0 or Close > Close[1] )
			and Close > MAValue and VolumeConfirms() then
			begin
			SignalConfirmed = true ;
			WaitingForConfirm = false ;
			if InAChart then
				DrawPoint( 0, Color.Green ) ;
			end ;
		end ;
	end ;

if SignalConfirmed then
	begin
	Buy next bar at Market ;
	SignalConfirmed = false ;
	WaitingForPivot = true ;
	end ;
A sample chart is shown in Figure 1.

FIGURE 1: TRADESTATION. Here is a sample list of TradeStation Scanner results along with an example of the indicator and strategy applied to a daily chart of ITMN.
To download the EasyLanguage code, visit our TradeStation and EasyLanguage support forum. The code from this article can be found at https://www.tradestation.com/TASC-2014. The ELD filename is “_TASC_SEP2014_GOLDENTRIANGLE.ELD.”
For more information about EasyLanguage in general, see https://www.tradestation.com/EL-FAQ.
This article is for informational purposes. No type of trading or investment recommendation, advice, or strategy is being made, given, or in any manner provided by TradeStation Securities or its affiliates.
—Doug McCrary
TradeStation Securities, Inc.
www.TradeStation.com
BACK TO LIST

eSIGNAL: SEPTEMBER 2014
For this month’s Traders’ Tip, we’ve provided the formula TheGoldenTriangleStrategy.efs based on the formula described in “Finding The Golden Triangle” by Charlotte Hudgin in this issue.
The study contains formula parameters that may be configured through the edit chart window (right-click on the chart and select “edit chart”).
To discuss this study or download a complete copy of the formula code, please visit the EFS Library Discussion Board forum under the forums link from the support menu at www.esignal.com or visit our EFS KnowledgeBase at https://www.esignal.com/support/kb/efs/. The eSignal formula script (EFS) is also available for copying & pasting below, and can be downloaded here.
/*********************************
Provided By:
    Interactive Data Corporation (Copyright -í© 2014)
    All rights reserved. This sample eSignal Formula Script (EFS)
    is for educational purposes only. Interactive Data Corporation
    reserves the right to modify and overwrite this EFS file with
    each new release.

Description:
    Finding The Golden Triangle by Charlotte Hudgin

Formula Parameters:                     Default:
Length SMA                              50
Consider Days of White Space            20
Consider Days to Compare Volume         0
Entry Position Color                    lime

Exit Position Color                     red

Version:            1.00  07/07/2014

Notes:
    The related article is copyrighted material. If you are not a subscriber
    of Stocks & Commodities, please visit www.traders.com.

**********************************/

var fpArray = new Array();

function preMain(){


    setStudyTitle("TheGoldenTriangleStrategy");
    setPriceStudy(true);


    setCursorLabelName("Moving Average", 0);

    var x = 0;

    fpArray[x] = new FunctionParameter("fpLenSMA", FunctionParameter.NUMBER);
    with(fpArray[x++]){
        setName("Length SMA");
        setLowerLimit(1);
        setDefault(50);
    }

    fpArray[x] = new FunctionParameter("fpDaysWS", FunctionParameter.NUMBER);
    with(fpArray[x++]){
        setName("Consider Days of White Space");
        setLowerLimit(1);
        setDefault(20);
    }

    fpArray[x] = new FunctionParameter("fpDaysVolume", FunctionParameter.NUMBER);
    with(fpArray[x++]){
        setName("Consider Days to Compare Volume");
        setLowerLimit(0);
        setDefault(0);
    }


    fpArray[x] = new FunctionParameter("fpEntryColor", FunctionParameter.COLOR);
    with(fpArray[x++]){
        setName("Entry Position Color");
        setDefault(Color.lime);
    }


    fpArray[x] = new FunctionParameter("fpExitColor", FunctionParameter.COLOR);
    with(fpArray[x++]){
        setName("Exit Position Color");
        setDefault(Color.red);
    }
}

var bInit = false;
var bVersion = null;

var xOpen = null;
var xHigh = null;
var xLow = null;
var xClose  = null;
var xVolume = null;


var xPriceSMA = null;
var xVolumeSMA = null;

var xHignesVol = null;


var nCurrDaysWS = 0;

var nLotSize = 0;


var bPriceConfirm = false;

var bVolumeConfirm = false;


var nPivotPrice = null;


function main(fpLenSMA, fpDaysWS, fpDaysVolume, fpEntryColor, fpExitColor){


    if (bVersion == null) bVersion = verify();
    if (bVersion == false) return;

    if (!bInit){


        xOpen = open();
        xHigh = high();
        xLow = low();
        xClose = close();

        xVolume = volume();


        if (fpDaysVolume != 0)

            xHignesVol = highest(fpDaysVolume, xVolume);

        xPriceSMA = sma(fpLenSMA);

        xVolumeSMA = sma(fpLenSMA, xVolume);


        nLotSize = Strategy.getDefaultLotSize();

        bInit = true;
    }


    if (getBarState() == BARSTATE_ALLBARS){

        bPriceConfirm = false;

        bVolumeConfirm = false;


        nCurrDaysWS = 0;

    };


    var nOpen = xOpen.getValue(0);
    var nHigh = xHigh.getValue(0);
    var nLow  = xLow.getValue(0);
    var nClose = xClose.getValue(0);

    var nPriorClose = xClose.getValue(-1);

    var nVolume = xVolume.getValue(0);


    var nPriceSMA = xPriceSMA.getValue(0);

    var nVolumeSMA = xVolumeSMA.getValue(0);


    var nHignesVol = 0;


    if (fpDaysVolume != 0)

        nHignesVol = xHignesVol.getValue(-1);


    if (nPriorClose == null || nPriceSMA == null || nVolumeSMA == null || nHignesVol == null)
        return;


    if (getCurrentBarIndex() != 0){


        if (Strategy.isInTrade() && nHigh >= nPivotPrice){


            var nExitPrice = Math.max(nOpen, nPivotPrice);


            Strategy.doSell("Exit", Strategy.LIMIT, Strategy.THISBAR, Strategy.DEFAULT, nExitPrice);
            drawShapeRelative(0, AboveBar1, Shape.DOWNTRIANGLE, null, fpExitColor, Text.PRESET, getCurrentBarIndex() + "Exit");
            drawTextRelative(0, AboveBar2, "Exit", fpExitColor, null, Text.PRESET|Text.CENTER, null, null, getCurrentBarIndex() + "Exit");
            drawTextRelative(0, AboveBar3, nLotSize + " @ " + formatPriceNumber(nExitPrice), fpExitColor, null, Text.PRESET|Text.CENTER, null, null, getCurrentBarIndex() + "ExitSettings");


            bPriceConfirm = false;

            bVolumeConfirm = false;

        };


        if (!bPriceConfirm && nCurrDaysWS >= fpDaysWS && nLow <= nPriceSMA && nClose >= nPriceSMA){


            bPriceConfirm = true;


            for (var j = 0; j > -getCurrentBarCount()-1; j--){


                nPivotPrice = xHigh.getValue(j-1);


                if (xHigh.getValue(j) > xHigh.getValue(j-1)){

                    nPivotPrice = xHigh.getValue(j);

                    break;

                }

            }


            if (nVolume > nVolumeSMA && nVolume > nHignesVol)

                bVolumeConfirm = true;

        };


        if (bPriceConfirm && !bVolumeConfirm){

            if (nVolume > nVolumeSMA && nVolume > nHignesVol && nClose > nPriceSMA && nClose > nPriorClose)

                 bVolumeConfirm = true;

        };


        if (bPriceConfirm && bVolumeConfirm && !Strategy.isInTrade()){


            var nEntryPrice = xOpen.getValue(1);


            if (nEntryPrice > nPivotPrice){

                bPriceConfirm = false;

                bVolumeConfirm = false;

            } else{

                Strategy.doLong("Entry", Strategy.MARKET, Strategy.NEXTBAR, Strategy.DEFAULT);
                drawShapeRelative(1, BelowBar1, Shape.UPTRIANGLE, null, fpEntryColor, Text.PRESET, getCurrentBarIndex() + "Entry");
                drawTextRelative(1, BelowBar2, "Entry", fpEntryColor, null, Text.PRESET|Text.CENTER, null, null, getCurrentBarIndex() + "Entry");
                drawTextRelative(1, BelowBar3, nLotSize + " @ " + formatPriceNumber(nEntryPrice), fpEntryColor, null, Text.PRESET|Text.CENTER, null, null, getCurrentBarIndex() + "EntrySettings");

            };

        };

    };


    if (nLow > nPriceSMA)

        nCurrDaysWS ++

    else

        nCurrDaysWS = 0;


    return nPriceSMA;
}

function verify(){


    var b = false;
    if (getBuildNumber() < 779){


        drawTextAbsolute(5, 35, "This study requires version 8.0 or later.",
            Color.white, Color.blue, Text.RELATIVETOBOTTOM|Text.RELATIVETOLEFT|Text.BOLD|Text.LEFT,
            null, 13, "error");
        drawTextAbsolute(5, 20, "Click HERE to upgrade.@URL=https://www.esignal.com/download/default.asp",
            Color.white, Color.blue, Text.RELATIVETOBOTTOM|Text.RELATIVETOLEFT|Text.BOLD|Text.LEFT,
            null, 13, "upgrade");
        return b;
    }
    else

        b = true;

    return b;
}
A sample chart is shown in Figure 2.
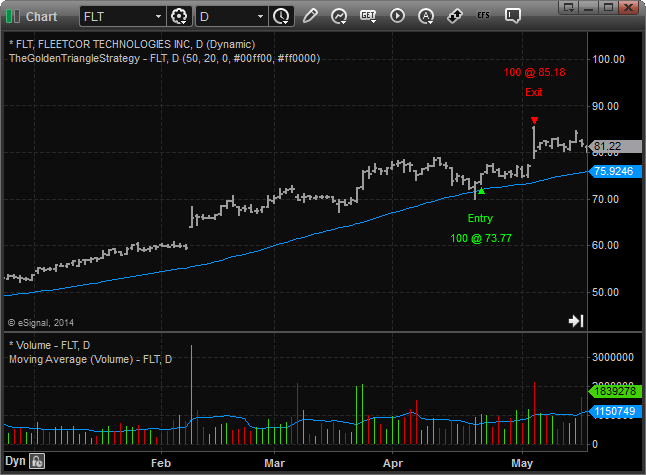
FIGURE 2: eSIGNAL. Here’s an example of the strategy on FleetCor Technologies Inc. (FLT).
—Eric Lippert
eSignal, an Interactive Data company
800 779-6555, www.eSignal.com
BACK TO LIST

THINKORSWIM: SEPTEMBER 2014
In “Finding The Golden Triangle” in this issue, author Charlotte Hudgin defines a new strategy that indicates when a stock is likely to remain in a trend. At thinkorswim, we have used our proprietary scripting language thinkScript to build a strategy for detecting trends based on this method.
For simplicity in implementing it, we are offering the custom study downloadable from https://tos.mx/l7ox0B. Choose backtest in thinkorswim, then rename the study “GoldenTriangle.” You can adjust the parameters of these within the edit studies window to fine-tune your variables.
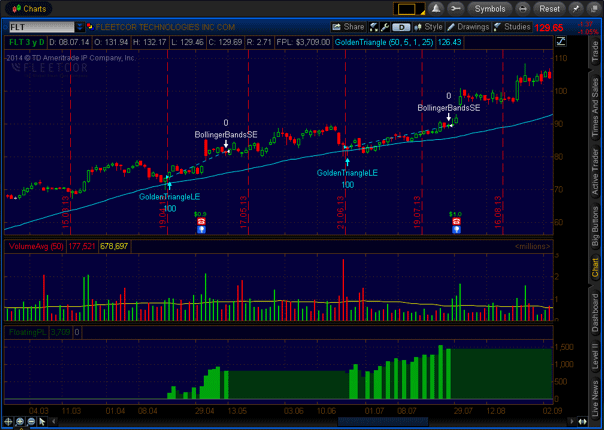
FIGURE 3: THINKORSWIM. This three-year daily chart of FleetCor Technologies Inc. (FLT) shows sample entry points for Hudgin’s described strategy. An existing Bollinger Band-based strategy is used for the exit point for demonstration purposes. The green histogram shows the strategy’s performance over time.
The chart in Figure 3 shows entry points for the strategy described in Hudgin’s article displayed on a three-year daily chart of FleetCor Technologies Inc. (FLT). You can see that this thinkorswim chart uses an existing Bollinger Band-based strategy for the exit point. The green histogram shows the strategy’s performance over time.
Happy swimming!
—thinkorswim
A division of TD Ameritrade, Inc.
www.thinkorswim.com
BACK TO LIST

WEALTH-LAB: SEPTEMBER 2014
In Charlotte Hudgin’s article in this issue (“Finding The Golden Triangle”), she presents a formalized approach to identifying dips in stocks with established trends. Despite its clarity, the abundance of included system parameters (which includes various timeouts, periods, and percentages) makes it quite picky. You might want to reduce them if you notice that it catches too few setups, or to apply it to a large watchlist (think hundreds or even thousands of stocks) if you’re an active trader.
Hudgin’s idea of using “white space” between the price and its moving average is a clever visual technique to help find consistent trends that don’t retrace too often and with higher momentum. We quantify the white space as a percentage of bars with their low price above a moving average. A potential enhancement might be an evaluation of how much the low price deviates from the SMA.
Unfortunately, as frequently happens, the article does not focus on getting out of the trade. We will leave development of a complete exit strategy to motivated traders, though a simple trailing exit that you will find in the code works pretty well. (See Figure 4.)

FIGURE 4: WEALTH-LAB. Here’s a sample Wealth-Lab 6 chart illustrating the application of the system’s rules on a daily chart of Under Armour Inc. (UA).
To execute the trading system, Wealth-Lab users may copy/paste our provided C# code shown below, or simply let Wealth-Lab do that job: in the open strategy dialog, click download to get the strategy code.
Spotting trend pullbacks is a very popular tactic. If you want more on this, Wealth-Lab offers variations of the same tune. In particular, we’d like to highlight another downloadable strategy, the “big move, pullback and continuation” system, which can be found under the pullbacks folder in the open strategy dialog (Ctrl-O). It also features great flexibility in configuring various parameters interactively through the use of “sliders.”
Wealth-Lab 6 strategy code (C#):

using System;
using System.Collections.Generic;
using System.Text;
using System.Drawing;
using WealthLab;
using WealthLab.Indicators;

namespace WealthLab.Strategies
{
	public class GoldenTriangleStrategy : WealthScript
	{
		private StrategyParameter paramRiseBars;
		private StrategyParameter paramWhiteSpace;
		private StrategyParameter paramMinRise;
		private StrategyParameter paramSMA;
		private StrategyParameter paramMom;
		private StrategyParameter paramHi;
		private StrategyParameter paramProximity;
		private StrategyParameter paramPullback;
		private StrategyParameter paramRecovery;
		private StrategyParameter paramTimeout;
		private StrategyParameter paramVolConf;
		private StrategyParameter paramMaxBuy;
		private StrategyParameter paramTrail;

		public GoldenTriangleStrategy()
		{
			paramRiseBars = CreateParameter("Rise: X bars", 50, 10, 100, 10);
			paramWhiteSpace = CreateParameter("White space %", 50, 10, 100, 10);
			paramMinRise = CreateParameter("Min. rise %", 10, 5, 200, 5);
			paramSMA = CreateParameter("SMA period", 50, 10, 200, 10);
			paramMom = CreateParameter("Momentum period", 10, 2, 30, 2);
			paramHi = CreateParameter("Highest period", 20, 10, 100, 10);
			paramProximity = CreateParameter("Within SMA %", 2, 1, 5, 1);
			paramPullback = CreateParameter("Pullback %", 2, 2, 18, 2);
			paramRecovery = CreateParameter("Approaching %", 2, 2, 6, 2);
			paramTimeout = CreateParameter("Expires after Y bars", 20, 5, 40, 5);
			paramVolConf = CreateParameter("Volume confirmation?", 0, 0, 1, 1);
			paramMaxBuy = CreateParameter("Max buy price", 5, 1, 10, 1);
			paramTrail = CreateParameter("Trailing low exit", 40, 10, 80, 10);
		}

		protected override void Execute()
		{
			bool pivot = false; int pivotBar = -1;
			bool pullback = false; int pullbackBar = -1;
			bool recovery = false; int recoveryBar = -1;
			bool volConfirm = paramVolConf.ValueInt == 1;
			double ws = paramWhiteSpace.Value / 100d;
			double within = paramProximity.Value;
			double minRise = paramMinRise.Value;
			double risePct = 0.0, pivotPrice = 0.0, dipPrice = 0.0;
			int riseBars = paramRiseBars.ValueInt, ba = 0;

			SMA sma = SMA.Series(Close,paramSMA.ValueInt);
			MomentumPct mom = MomentumPct.Series(Close,paramMom.ValueInt);
			Highest hi = Highest.Series(High,paramHi.ValueInt);
			DataSeries whiteSpace = new DataSeries(Bars,"WhiteSpace");

			Color blue = Color.FromArgb(50,Color.Blue);
			LineStyle ls = LineStyle.Solid;
			PlotSeries(PricePane,sma,Color.Red,ls,1);

			for(int bar = Math.Max(riseBars, GetTradingLoopStartBar(paramSMA.ValueInt)); bar < Bars.Count; bar++)
			{
				// "White space": percentage of bars above 50-day SMA
				for (int i = bar - riseBars; i <= bar; i++)
				{
					ba = (Low[i] > sma[i]) ? ba += 1 : 0;
					whiteSpace[bar] = ba / (double)riseBars;
				}

				if (IsLastPositionActive)
				{
					SellAtStop( bar+1, LastPosition, Lowest.Series(Low,paramTrail.ValueInt)[bar] );
				}
				else
				{
					// 1. Detecting pivot
					if( !pivot )
					{
						// Uptrend: price > SMA, momentum % > 100, "white space" at or exceeds 50%, hit new 50-day high
						if( mom[bar] >= 100 && whiteSpace[bar] > ws && High[bar] >= hi[bar] )
						{
							// Rise over X bars (default)
							risePct = (High[bar] - High[bar - riseBars]) / High[bar] * 100.0;

							// Pivot detected: price rise exceeds predefined % threshold
							if( risePct > minRise )
							{
								pivot = true; pivotBar = bar; pivotPrice = Close[pivotBar];
								SetBackgroundColor( pivotBar, blue );
							}
						}
					}

					// 2. Looking for pullback
					if( pivot )
					{
						// Pullback is valid until it times out
						if( bar <= pivotBar + paramTimeout.ValueInt )
						{
							if( !pullback )
							{
								// Pullback detected: price dove within N% of SMA
								bool priceNearSMA = Close[bar] > (sma[bar] * 1 - (within / 100d)) &&
									Close[bar] < (sma[bar] * 1 + (within / 100d));
								if( priceNearSMA )
								{
									pullback = true; pullbackBar = bar; dipPrice = Close[pullbackBar];
									SetBackgroundColor( pullbackBar, Color.FromArgb(30, Color.Red) );
								}
							}

							// 3. Looking for recovery
							if( pullback )
							{
								// Rebound is valid until it times out
								if( bar <= pullbackBar + paramTimeout.ValueInt )
								{
									if( !recovery )
									{
										// Recovery started: current price is above both the 50-day SMA and Pullback price
										// but current high is still below the Pivot price
										if( (Close[bar] > sma[bar]) && (Close[bar] > dipPrice) && (High[bar] <= High[pivotBar]) )
										{
											recovery = true; recoveryBar = bar;
											SetBackgroundColor( recoveryBar, Color.FromArgb(50, Color.Orange) );
										}
									}


									// 4. Looking to enter
									if( recovery )
									{
										// 4.a Price confirmation
										if( Close[bar] > sma[bar] )
										{
											// 4.b Volume confirmation (if enabled)
											if( !volConfirm || (volConfirm && Volume[bar] > SMA.Series(Volume,50)[bar]) )
											{
												// Enter: price below Max Buy price
												double maxBuyPrice = (1 - paramMaxBuy.Value / 100d) * High[pivotBar];
												if( Close[bar] < maxBuyPrice )
												{
													// Eugene: buy at stop half-way between the Pivot and Pullback prices (or higher)
													if( BuyAtStop( bar + 1, (dipPrice + (pivotPrice - dipPrice) / 2), Bars.FormatValue(risePct) ) != null )
													// Alternative:
													//if( BuyAtMarket( bar + 1, Bars.FormatValue(risePct) ) != null )
													{
														DrawLine( PricePane, pivotBar, pivotPrice, pullbackBar, dipPrice, blue, ls, 2 );
														DrawLine( PricePane, pullbackBar, dipPrice, bar, High[pivotBar], blue, ls, 2 );
														DrawLine( PricePane, pivotBar, High[pivotBar], bar, High[pivotBar], blue, LineStyle.Dashed, 2 );

														pivot = false; pullback = false; recovery = false;
														LastPosition.Priority = -Close[bar];
													}
													else
														// reset if setup has timed out
														recovery = bar + 1 - recoveryBar < paramTimeout.ValueInt;
												}
											}
										}
									}
								}
								else
								{
									pullback = false;
									SetBackgroundColor( pullbackBar, Color.Transparent );
								}
							}
						}
						else
						{
							pivot = false;
							SetBackgroundColor( pivotBar, Color.Transparent );
						}
					}
				}
			}
		}
	}
}
—Wealth-Lab team
MS123, LLC
www.wealth-lab.com
BACK TO LIST

NEUROSHELL TRADER: SEPTEMBER 2014
A trading system based on the setup for the Armchair Investor Golden Triangle presented by Charlotte Hudgin in her article in this issue (“Finding The Golden Triangle”) can be easily implemented in NeuroShell Trader using a few of the many indicators our program offers. Simply select “New trading strategy” from the Insert menu and enter the following in the appropriate locations of the trading strategy wizard:
Generate a buy long Market order if all of the following are true:

A>B(Lag(Max(A>B(LinTimeReg Slope(Close,50),LinTimeReg Slope(Avg(Close,50),50)),20),2),0)
     And3(Or2(And2(CrossBelow(Low,Avg(Close,50)),A>B(Close,Avg(Close,50))),And2(A>B(Max(CrossBelow(Low,Avg(Close,50)),10),0),A>B(Momentum(Close,1),0))),A>B(Volume,Avg(Volume,50)),High Channel Breakout(Volume,5))

Protective Stop:

     TrailPrice%(Trading Strategy,10)
If you have NeuroShell Trader Professional, you can also choose whether the parameters should be optimized. After backtesting the trading strategy, use the detailed analysis button to view the backtest and trade-by-trade statistics for the strategy.
Users of NeuroShell Trader can go to the STOCKS & COMMODITIES section of the NeuroShell Trader free technical support website to download a copy of this or any previous Traders’ Tips.
A sample chart is shown in Figure 5.

FIGURE 5: NEUROSHELL TRADER. This NeuroShell Trader chart displays the Armchair Investor Golden Triangle entry followed by a trailing-stop exit.
—Marge Sherald, Ward Systems Group, Inc.
301 662-7950, sales@wardsystems.com
www.neuroshell.com
BACK TO LIST

NINJATRADER: SEPTEMBER 2014
We have implemented the golden triangle strategy that is presented by Charlotte Hudgin in her article in this issue, “Finding The Golden Triangle,” and we have made it available for download at www.ninjatrader.com/SC/September2014SC.zip.
Once you have downloaded it, from within the NinjaTrader Control Center window, select the menu File → Utilities → Import NinjaScript and select the downloaded file. This file is for NinjaTrader version 7 or greater.
You can review the indicator source code by selecting the menu Tools → Edit NinjaScript → Strategy from within the NinjaTrader Control Center window and selecting the “GoldenTriangle” file.
A sample chart implementing the strategy is shown in Figure 6.
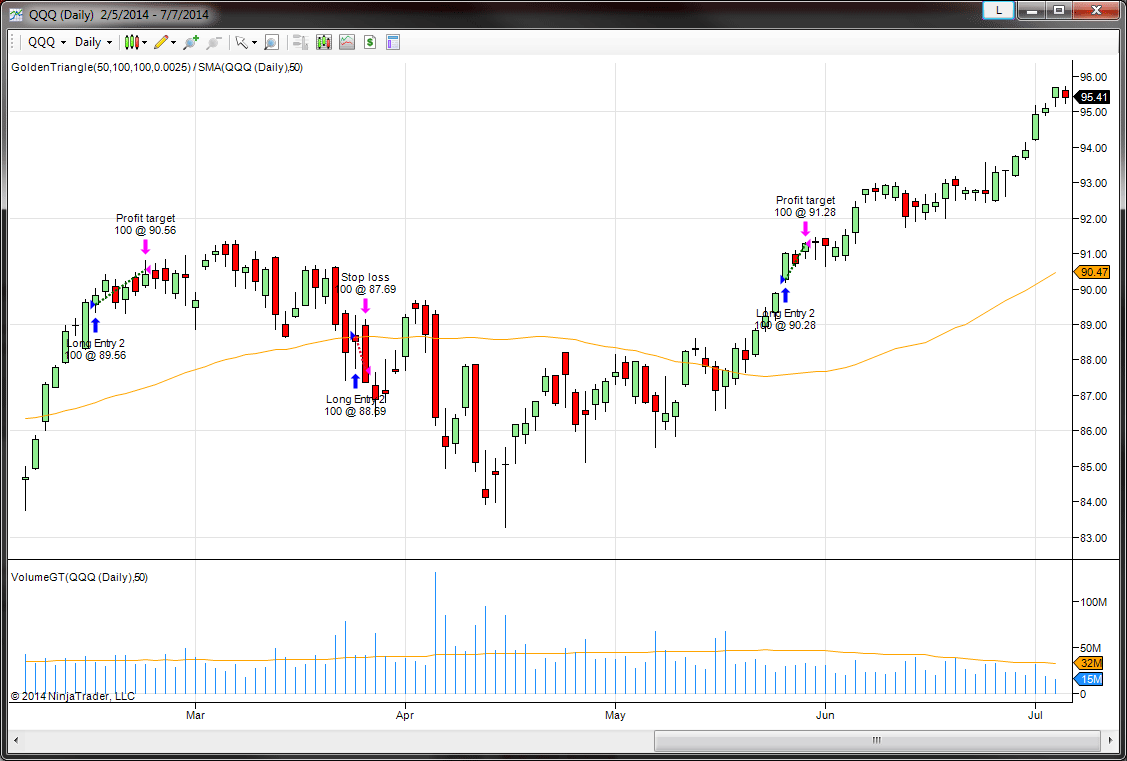
FIGURE 6: NINJATRADER. This screenshot shows the strategy applied to a daily QQQ chart in NinjaTrader.
—Raymond Deux and Cal Hueber
NinjaTrader, LLC
www.ninjatrader.com
BACK TO LIST

AIQ: SEPTEMBER 2014
The AIQ code and EDS file based on Charlotte Hudgin’s article in this issue, “Finding The Golden Triangle,” is provided at www.TradersEdgeSystems.com/traderstips.htm, and is shown below.
I created an indicator I named the clear value indicator (“ClearValueSum” and “ClearValueAvg”) that might be used to rank signals. The “ClearValueSum” indicator sums the daily percentages that the close is above the simple moving average (SMA). The summing starts at the last cross up and goes to the current bar. If the close is below the SMA, then the value of the indicator is zero. In Figure 7, I show a chart of Priceline (PCLN) with the ClearVauleSum indicator in the subgraph. In addition, I provide the code for the golden triangle setup and confirmation.
The author did not discuss exits, so I provided one based on a cross under the SMA or an exit after a maximum-bars-to-hold input (“maxBarsToHold”).

FIGURE 7: AIQ, sample trade. Here is a chart of Priceline (PCLN) with the ClearValueSum indicator and a sample trade marked with white up and down arrows.

FIGURE 8: AIQ, SAMPLE PERFORMANCE RESULTS. Here are the EDS summary results compared with varying the maxBarsToHold input trading the NASDAQ 100 list of stocks over the last six years.
I ran a short optimization on the “maxBarsToHold” input, the results of which are shown in the table in Figure 8. Most of the metrics are best at the 18-bar setting. In Figure 7, I also show a sample trade from the system from 2009 with the 18-bar setting.
!FINDING THE GOLDEN TRIANGLE
!Author: Charlotte Hudgin, TASC Sept 2014
!Coded by: Richard Denning 7/10/2014
!www.TradersEdgeSystems.com

!INPUTS:
	smaLen is 50.        !moving average length
	periods is 252.      !Total look back period
	strength is 4.       !Number of bars on each side of pivot
	maxBarsToHold is 18. !max bars to hold position

!VARIABLES:
	C is [close].
	L is [low].
	V is [volume].
	OTD is offsettodate(month(),day(),year()).

!CLEAR VALUE INDICATOR:
	SMA is simpleavg(C,smaLen).
	Xup if C>SMA and (valrule(C<=SMA,1) or countof(L<SMA,2)>=1).
	XupDte is scanany(Xup,periods).
	XupOS is scanany(Xup,periods) then OTD.
	ClearPct is (C/SMA -1) * 100.
	ClearPctSum is iff(C>SMA,sum(ClearPct,^XupOS),0).
	ClearPctAvg is iff(C>SMA and ^XupOS>1,simpleavg(ClearPct,^XupOS),iff(ClearPct>0,ClearPct,0)).

!CODE TO FIND PIVOTS:
	LowR is LoVal([low],(2*strength)+1).
	LowM is Val([low],strength).
	LS if LowR = LowM.
	HighR is HiVal([high],(2*strength)+1).
	HighM is Val([high],strength).
	HS if  HighR = HighM.

   !FIND FIRST PIVOT LOW
     	LT1 is scanany(LS,periods) then OTD .
      	LO1 is ^LT1 + Strength.
    	LO1dte is SetDate(LO1).
	LowLO1 is val([low],^LO1).

   !FIND FIRST PIVOT HIGH
     	HT1 is scanany(HS,periods,0) then OTD .
      	HO1 is ^HT1 + Strength.
	HO1dte is SetDate(HO1).
	HighHO1	is val([high],HO1).

!SYSTEM CODE:
	Xdn if [low]<SMA and valrule([low]>=SMA,1).
	XdnDte is scanany(Xdn,periods).
	XdnOS is scanany(Xdn,periods) then OTD.

	ShowValues if C > 5.
	HHVpivot if HighHO1 = hival([high],smaLen) and C > 5.
	Setup if Xdn and HHVpivot.
	PriceCnf if C>SMA.
	SetupOS is scanany(Setup,periods) then OTD.
	PriceCnfOS is scanany(PriceCnf,periods) then OTD.
	AvgV is simpleavg(V,smaLen).
	VolumeCnf if ^SetupOS<15 and SetupOS<=^PriceCnfOS and V>avgV and V=highresult(V,^PriceCnfOS).

    !BUY & EXIT RULES (LONG ONLY):
	Buy if VolumeCnf and countof(Setup,15)=1 and countof(PriceCnf,15)>=1
		and countof(C>SMA,SetupOS+1)=SetupOS+1.
	Exit if C<SMA or  {position days}>=maxBarsToHold.
—Richard Denning
info@TradersEdgeSystems.com
for AIQ Systems
BACK TO LIST

TRADERSSTUDIO: SEPTEMBER 2014
The TradersStudio code based on Charlotte Hudgin’s article in this issue, “Finding The Golden Triangle,” is provided at both of the following websites:
The following code file is provided in the download:
- System GOLDEN_TRIANGLE: A trading system described by Charlotte Hudgin using for the exit a max-bars-held input
The system has the following rules:
- Buy at the next bar at market open after the setup, price confirmation, and volume confirmation occur within 15 bars
- Exit the long position at the next bar at market open when the close crosses under the SMA
- Exit the long position on the next bar at market open when the max bars held have been reached
- As coded, this is a long-only system.
I ran the system on a sample futures portfolio using data from Pinnacle Data Corp. (www.pinnacledata.com). Figure 9 shows the equity and underwater equity curves trading one contract for each signal. The test period was from the year 2000 to 2014. The table in Figure 10 shows the session setup parameters and the list of symbols in the portfolio.
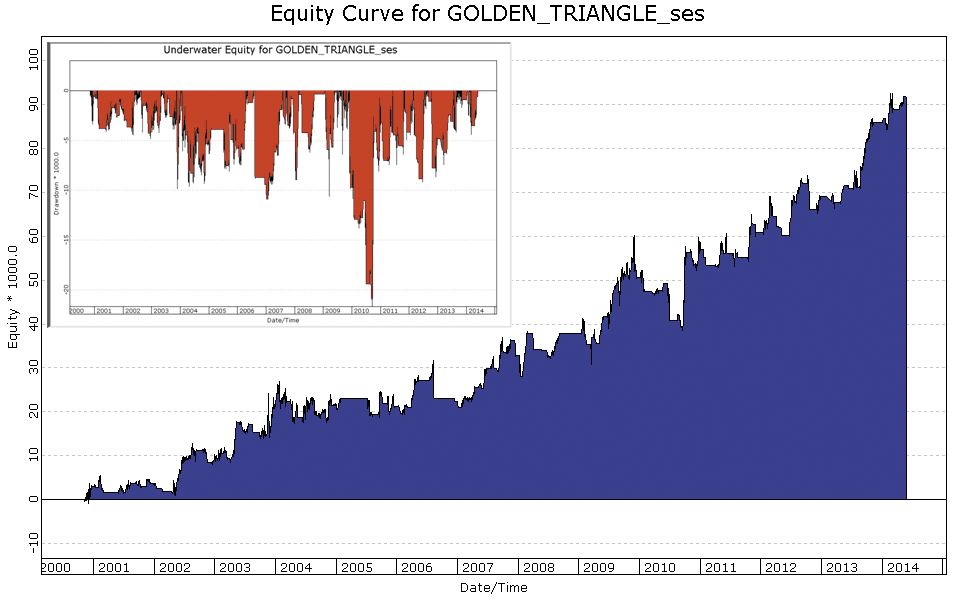
FIGURE 9: TRADERSSTUDIO, EQUITY CURVE. Here are sample equity and underwater equity curves trading one contract for each signal on a portfolio of futures contracts for the period 2000–2014.
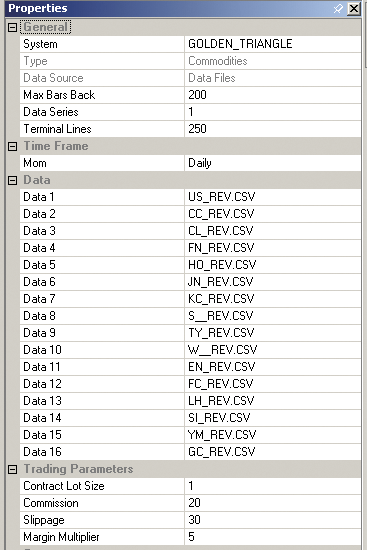
FIGURE 10: TRADERSSTUDIO. Here are the session setup parameters and the list of symbols in the portfolio used for the test run.
—Richard Denning
info@TradersEdgeSystems.com
for TradersStudio
BACK TO LIST

UPDATA: SEPTEMBER 2014
Our Traders’ Tips this month is based on the article in this issue by Charlotte Hudgin, “Finding The Golden Triangle.”
In the article, Hudgin refines the “dip-buying” concept by introducing a triangle-pattern search within the underlying data. According to this concept, fast-growing stocks can experience some pullbacks before continuing an overall uptrend. Analysis of price and volume action during the pullback tries to anticipate those instruments likely to return to an uptrend the earliest.
The Updata code based on Hudgin’s article has been added to the Updata Library and may be downloaded by clicking the custom menu and then indicator library. The code is also shown below for pasting into the Updata custom editor. A sample chart implementing the strategy is shown in Figure 11.
'Golden Triangle
DISPLAYSTYLE 4LINES
INDICATORTYPE TOOL
INDICATORTYPE3 CHART
PLOTSTYLE3 HISTOGRAM
COLOUR2 RGB(0,0,200)
COLOUR4 RGB(0,0,200)
NAME "Golden Triangle" ""
NAME3 "Mov Avg" ""
PARAMETER "Period B-C" #PeriodBC=9
PARAMETER "Period A-B" #PeriodABB=14
PARAMETER "Avg. Period" #AvgPeriod=50
@Avg=0
@DownCondition=0
@UpCondition=0
#INC=0
#i=0
#PeriodAB=0
@VolumeAvg=0

FOR #CURDATE=#AvgPeriod TO #LASTDATE
    @Avg=MAVE(#AvgPeriod)
    @VolumeAvg=SGNL(VOL,#AvgPeriod,M)
    @DownCondition=0
    @UpCondition=0
    #PeriodAB=#PeriodABB
    For #i=0 TO #PeriodAB-1
        if CLOSE(#PeriodBC+#i)<CLOSE(#PeriodBC+#i+1) AND CLOSE(#PeriodBC+#i)<CLOSE(#PeriodBC+#PeriodAB)
           @DownCondition=@DownCondition+1
        endif
        if #i<#PeriodBC
           if CLOSE(#i)>CLOSE(#i+1) AND CLOSE(#i)>CLOSE(#PeriodAB)
              @UpCondition=@UpCondition+1
           endif
        endif
        if CLOSE(#PeriodBC+#i)<CLOSE(#PeriodBC+#i+1) AND CLOSE(#PeriodBC+#i)<CLOSE(#PeriodBC+#PeriodAB) AND #i=#PeriodAB-1
           #PeriodAB=#PeriodAB+1
        endif
    Next
    If @UpCondition>0.65*#PeriodBC AND @DownCondition>0.65*#PeriodAB
       #INC=#INC+1
        DRAWLINE (#PeriodBC+#PeriodAB),CLOSE(#PeriodBC+#PeriodAB),#PeriodBC,CLOSE(#PeriodBC)
        DRAWLINE #PeriodBC,CLOSE(#PeriodBC),0,CLOSE(0)
    EndIf
    @PLOT2=@Avg
    @PLOT3=VOL
    @PLOT4=@VolumeAvg
NEXT
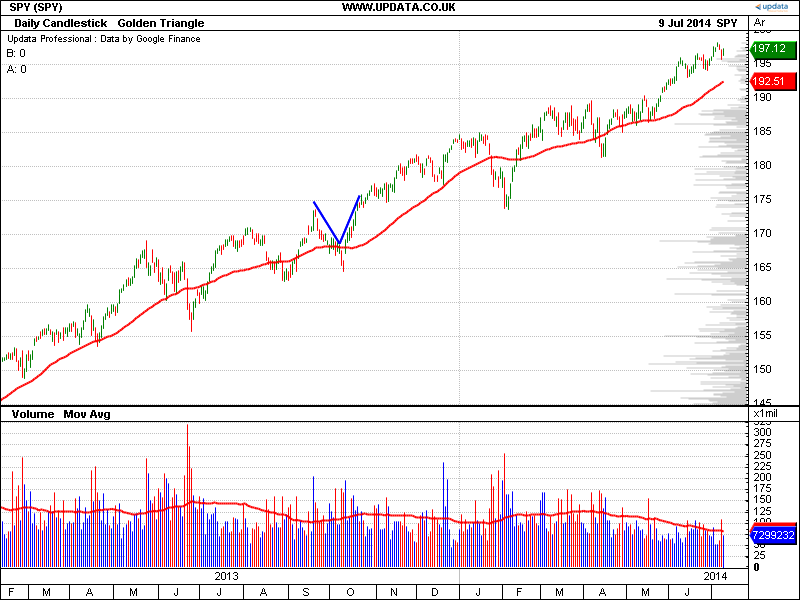
FIGURE 11: UPDATA. This sample chart shows the golden triangle as applied to the SPY ETF in daily resolution.
—Updata support team
support@updata.co.uk
www.updata.co.uk
BACK TO LIST
Originally published in the September 2014 issue of
Technical Analysis of Stocks & Commodities magazine.
All rights reserved. © Copyright 2014, Technical Analysis, Inc.


