TRADERS’ TIPS
December 2014
For this month’s Traders’ Tips, the focus is Markos Katsanos’ article in this issue, “Detecting Flags In Intraday Charts.” Here we present the December 2014 Traders’ Tips code with possible implementations in various software.
Code for TradeStation was already provided in Katsanos’ article by the author. S&C subscribers will find that code at the Subscriber Area of our website, www.traders.com. Presented here is an overview of some possible implementations for other software as well.
Traders’ Tips code is provided to help the reader implement a selected technique from an article in this issue or another recent issue. The entries here are contributed by various software developers or programmers for software that is capable of customization.

TRADESTATION: DECEMBER 2014
In “Detecting Flags In Intraday Charts” in this issue, author Markos Katsanos describes a method for identifying chart patterns known as flags on intraday charts. The author provides some TradeStation strategy code for a trading system based on his rules. Here, we are providing some additional EasyLanguage code for TradeStation for an indicator based on the same rules. The indicator can be used with a chart as well as with the TradeStation Scanner to search your symbol list of stocks.
To download this EasyLanguage code, please visit our TradeStation and EasyLanguage support forum. The code can be found here: https://www.tradestation.com/TASC-2014. The ELD filename is “_TASC_DEC2014_INTRADAYFLAGS.ELD”.
The code is also shown here:
IntradayFlags (Indicator)
{
	TASC December 2014
	Detecting Flags in Intraday Charts
	by Markos Katsanos
	Indicator
}

inputs:
	MAXFLDUR( 15 ), //Max Flag Duration
	FLAGMIN( 2.5 ), // Max ATR in lowest point in flag
	PX( 23 ), //Max Pole Duration.
	UPT1BARS( 70 ), // Bars for Uptrend leading to flag
	POLEMIN( 5.5 ), //Min ATR Height of the pole
	ATRmin( 5 ) ;// Min volatility change


variables:
	X1( 0 ),
	X2( 0 ),
	LRSX2( 0 ),
	LRSX1( 0 ),
	POLE( 0 ),
	TOP( 0 ),
	BOTTOM(  0),
	Y23( 0 ),
	FLAGBOT( 0 ),
	UPT1( 0 ),
	LF( 0 ),
	TARGETPER( 0 ) ;


// FLAG CALCULATION
//Flag duration ex pole top
X1 = HighestBar( Close, MAXFLDUR )[2] ;
//Flag duration including pole top
X2 = X1 + 1 ;
LF = Lowest( Close, X2 ) ;
TOP = Highest( Close, X2 )[2] ;
X2=Iff( LinearRegSlope( Close, X1 )[1] < 0
	and TOP - LF < flagmin * AvgTrueRange( 40 ), X1 + 1, 100 ) ;

if X2 > 2 and X2 <= MAXFLDUR then
	begin //Limits flag duration
	Y23=LowestBar( Close, PX + X2 ) ; // Pole bottom bar
	BOTTOM=Lowest( Close, PX+X2 ) ;// Pole bottom
	POLE = TOP - BOTTOM;
	IF TOP - BOTTOM > POLEMIN * AvgTrueRange( 40 )
		and Y23 > X2 then
		begin
		TOP = Highest( Close, X2 )[2] ;
		FLAGBOT = Lowest( Close, X2 ) ;
		//Uptrend leading to flag
		UPT1 = BOTTOM - Lowest( Low, UPT1BARS ) ;
		//Slope in flag
		LRSX1 = LinearRegSlope( Close, X1 ) * 100 ;
		//Slope in flag before breakout
		LRSX2 = LinearRegSlope( Close, X1-1 )[2] * 100 ;
		//Limits flag slope between 0 and -3 ATR
		Condition1 = TOP-LF < flagmin * AvgTrueRange( 40 )
			and ( LRSX1 < 0 or LRSX2 < 0 ) ;
		//Limits min pole height
		Condition2 = POLE > POLEMIN * AvgTrueRange( 40 ) ;
		//Uptrend leading to flag
		Condition3 = UPT1 > 0 ;
		//Volatility
		Condition5 = ( AvgTrueRange( 40 ) /
			AvgTrueRange( 40 )[Y23] - 1 ) * 100 > ATRmin ;
		If Condition1 and Condition2 and Condition3
			and Condition5 then
			begin
			Plot1( High, "Flag" ) ;
			Alert ;
			end ;
		end ;
	end ;


IntradayFlags (Strategy)
{
	TASC December 2014
	Detecting Flags in Intraday Charts
	by Markos Katsanos
	Strategy
}

inputs:
	MAXFLDUR( 15 ), //Max Flag Duration
	FLAGMIN( 2.5 ), // Max ATR in lowest point in flag
	PX( 23 ), //Max Pole Duration.
	UPT1BARS( 70 ), // Bars for Uptrend leading to flag
	POLEMIN( 5.5 ), //Min ATR Height of the pole
	LBF( 50 ), // Min distance between flags
	ATRmin( 5 ),// Min volatility change
	K( 1.2 ), //Profit Target constant
	timeexit( 100 ), //Time exit bars
	ATRLL( 3 ),
	BSEMIN( 5 ), // Stop loss below flag
	ATRTRAIL( 3 ),
	TRAILBARS( 5 ), // Trailing stop parameters
	BSEINACT( 70 ),
	ATRINACT( 4 ) ; // Inactivity exit parameter

variables:
	X1( 0 ),
	X2( 0 ),
	LRSX2( 0 ),
	LRSX1( 0 ),
	POLE( 0 ),
	ptarget( 0 ),
	BSE( 0 ),
	TOP( 0 ),
	BOTTOM(  0),
	X3( 0 ),
	L3( 0 ),
	Y23( 0 ),
	FLAGBOT( 0 ),
	UPT1( 0 ),
	LF( 0 ),
	TARGETPER( 0 ),
	MP( 0 ) ;

MP = MarketPosition ;
BSE = BarsSinceEntry ;

if MP <> 0 and MP[1] <> MP then
	BSE = 0
else if MP <> 0 then
	BSE += 1
else if MP = 0 then
	BSE = 0 ;

// FLAG CALCULATION
//Flag duration ex pole top
X1 = HighestBar( Close, MAXFLDUR )[2] ;
//Flag duration including pole top
X2 = X1 + 1 ;
LF = Lowest( Close, X2 ) ;
TOP = Highest( Close, X2 )[2] ;
X2=Iff( LinearRegSlope( Close, X1 )[1] < 0
	and TOP - LF < flagmin * AvgTrueRange( 40 ), X1 + 1, 100 ) ;

if X2 > 2 and X2 <= MAXFLDUR then
	begin //Limits flag duration
	Y23=LowestBar( Close, PX + X2 ) ; // Pole bottom bar
	BOTTOM=Lowest( Close, PX+X2 ) ;// Pole bottom
	POLE = TOP - BOTTOM;
	IF TOP - BOTTOM > POLEMIN * AvgTrueRange( 40 )
		and Y23 > X2 then
		begin
		TOP = Highest( Close, X2 )[2] ;
		FLAGBOT = Lowest( Close, X2 ) ;
		//Uptrend leading to flag
		UPT1 = BOTTOM - Lowest( Low, UPT1BARS ) ;
		//Slope in flag
		LRSX1 = LinearRegSlope( Close, X1 ) * 100 ;
		//Slope in flag before breakout
		LRSX2 = LinearRegSlope( Close, X1-1 )[2] * 100 ;
		//Limits flag slope between 0 and -3 ATR
		Condition1 = TOP-LF < flagmin * AvgTrueRange( 40 )
			and ( LRSX1 < 0 or LRSX2 < 0 ) ;
		//Limits min pole height
		Condition2 = POLE > POLEMIN * AvgTrueRange( 40 ) ;
		//Uptrend leading to flag
		Condition3 = UPT1 > 0 ;
		//Limits distance between successive flags
		Condition4 = (BarsSinceExit( 1 ) = 0
			or barssinceexit( 1 ) > LBF ) ;
		//Volatility
		Condition5 = ( AvgTrueRange( 40 ) /
			AvgTrueRange( 40 )[Y23] - 1 ) * 100 > ATRmin ;
		If MP = 0 and Condition1 and Condition2 and Condition3
			and Condition4 and Condition5 then
			begin
			Buy( "Flag" ) next bar at Highest( Close, X1 ) Stop  ;
			end ;
		end ;
	end ;

{EXIT CONDITIONS}
if MP = 1 then
	begin
	X3 = HighestBar( Close, MAXFLDUR )[BSE + 2] - BSE + 1 ;
	TOP = Highest( Close, X3 )[BSE + 1] ;
	BOTTOM = Lowest( Close, ( PX + X3 ) )[BSE + 1];
	POLE = ( TOP - BOTTOM ) / ( BOTTOM + .0001 ) * 100 ;
	targetPER = K * POLE ;
	ptarget = ( 1 + TARGETPER / 100 ) * EntryPrice ;
	L3 = Lowest( Low, X3 )[BSE] ;
	//Profit target
	if Close >= ptarget then
		Sell ( "pTARGET" ) this bar on Close;
	//Stop
	if BSE > BSEMIN then
		Sell ( "UNDER FLAG" ) next bar at
			L3 - ATRLL * AvgTrueRange( 40 ) Stop ;
	//Trailing stop
	if Close < Highest( Close, TRAILBARS )
		- ATRTRAIL * AvgTrueRange( 40 )then
		Sell ( "TRAIL" ) next bar at Market ;
	//Inactivity exit
	if BSE > BSEINACT and Close <
		EntryPrice + ATRINACT * AvgTrueRange( 40 ) then
		Sell ( "INACTIVITY" ) next bar at Market ;
	end ;

//Time exit
if BSE > timeexit then
	Sell ( "TIME" ) next bar at Market ;
For more information about EasyLanguage coding in general, please see https://www.tradestation.com/EL-FAQ.
A sample chart is shown in Figure 1.

FIGURE 1: TRADESTATION, SAMPLE SCANNER RESULTS. Here is a list of some sample results from the TradeStation Scanner along with the indicator and strategy based on Katsanos’ article, applied to an intraday chart of Cantel Medical Corp. (CMN).
This article is for informational purposes. No type of trading or investment recommendation, advice, or strategy is being made, given, or in any manner provided by TradeStation Securities or its affiliates.
—Doug McCrary
TradeStation Securities, Inc.
www.TradeStation.com
BACK TO LIST

eSIGNAL: DECEMBER 2014
For this month’s Traders’ Tip, we’ve provided the formula IntradayFlagStrategy.efs based on the formula given in Markos Katsanos’ article in this issue, “Detecting Flags In Intraday Charts.”
The study contains formula parameters that may be configured through the edit chart window (right-click on the chart and select “edit chart”). A sample chart is shown in Figure 2.

FIGURE 2: eSIGNAL. Here is an example of the flag study based on Markos Katsanos’ article in this issue implemented on a chart of Priceline Group (PCLN).
To discuss this study or download a complete copy of the formula code, please visit the EFS Library Discussion Board forum under the forums link from the support menu at www.esignal.com or visit our EFS KnowledgeBase at https://www.esignal.com/support/kb/efs/. The eSignal formula script (EFS) is also available for copying & pasting below, or downloading here.
/*********************************

Provided By:

    Interactive Data Corporation (Copyright © 2014)

    All rights reserved. This sample eSignal Formula Script (EFS)

    is for educational purposes only. Interactive Data Corporation

    reserves the right to modify and overwrite this EFS file with

    each new release.


Description:

    Detecting Flags In Intraday Charts by Markos Katsanos


Version:            1.00  10/07/2014


Notes:

    The related article is copyrighted material. If you are not a subscriber

    of Stocks & Commodities, please visit www.traders.com.


**********************************/


var fpArray = new Array();


function preMain(){


    setStudyTitle("IntradayFlagStrategy");

    setPriceStudy(true);


    var x = 0;


    fpArray[x] = new FunctionParameter("fpMaxFlDur", FunctionParameter.NUMBER);

    with(fpArray[x++]){


        setName("Max Flag Duration");

        setDefault(15);

    };


    fpArray[x] = new FunctionParameter("fpFlagMin", FunctionParameter.NUMBER);

    with(fpArray[x++]){


        setName("Max ATR in lowest point in flag");

        setDefault(2.5);

    };


    fpArray[x] = new FunctionParameter("fpPX", FunctionParameter.NUMBER);

    with(fpArray[x++]){


        setName("Max Pole Duration");

        setDefault(23);

    };


    fpArray[x] = new FunctionParameter("fpUptBars", FunctionParameter.NUMBER);

    with(fpArray[x++]){


        setName("Bars for Uptrend leading to flag");

        setDefault(70);

    };


    fpArray[x] = new FunctionParameter("fpPoleMin", FunctionParameter.NUMBER);

    with(fpArray[x++]){


        setName("Min ATR Height of the pole");

        setDefault(5.5);

    };


    fpArray[x] = new FunctionParameter("fpDistBFlags", FunctionParameter.NUMBER);

    with(fpArray[x++]){


        setName("Min distance between flags");

        setDefault(50);

    };


    fpArray[x] = new FunctionParameter("fpATRMin", FunctionParameter.NUMBER);

    with(fpArray[x++]){


        setName("Min volatility change");

        setDefault(5);

    };


    fpArray[x] = new FunctionParameter("fpK", FunctionParameter.NUMBER);

    with(fpArray[x++]){


        setName("Profit Target constant (K)");

        setDefault(1.2);

    };


    fpArray[x] = new FunctionParameter("fpTimeExit", FunctionParameter.NUMBER);

    with(fpArray[x++]){


        setName("Time exit bars");

        setDefault(100);

    };


    fpArray[x] = new FunctionParameter("fpCap1", FunctionParameter.STRING);

    with(fpArray[x++]){


        setName("Stop loss below flag parameters:");

    };


    fpArray[x] = new FunctionParameter("fpATRLL", FunctionParameter.NUMBER);

    with(fpArray[x++]){


        setName("    ATRLL");

        setDefault(3);

    };


    fpArray[x] = new FunctionParameter("fpBSEMIN", FunctionParameter.NUMBER);

    with(fpArray[x++]){


        setName("    BSEMIN");

        setDefault(5);

    };


    fpArray[x] = new FunctionParameter("fpCap2", FunctionParameter.STRING);

    with(fpArray[x++]){


        setName("Trailing stop parameters:");

    };


    fpArray[x] = new FunctionParameter("fpATRTRAIL", FunctionParameter.NUMBER);

    with(fpArray[x++]){


        setName("   ATRTRAIL");

        setDefault(3);

    };


    fpArray[x] = new FunctionParameter("fpTRAILBARS", FunctionParameter.NUMBER);

    with(fpArray[x++]){


        setName("    TRAILBARS");

        setDefault(5);

    };


    fpArray[x] = new FunctionParameter("fpCap3", FunctionParameter.STRING);

    with(fpArray[x++]){


        setName("Inactivity exit parameter:");

    };


    fpArray[x] = new FunctionParameter("fpBSEINACT", FunctionParameter.NUMBER);

    with(fpArray[x++]){


        setName("    BSEINACT");

        setDefault(70);

    };


    fpArray[x] = new FunctionParameter("fpATRINACT", FunctionParameter.NUMBER);

    with(fpArray[x++]){


        setName("    ATRINACT");

        setDefault(4);

    };


    fpArray[x] = new FunctionParameter("fpLongColor", FunctionParameter.COLOR);

    with(fpArray[x++]){


        setName("Enter Position Color");

        setDefault(Color.lime);

    };


    fpArray[x] = new FunctionParameter("fpShortColor", FunctionParameter.COLOR);

    with(fpArray[x++]){


        setName("Exit Position Color");

        setDefault(Color.red);

    };

}


setComputeOnClose();

var bInit = false;

var bVersion = null;


var xClose = null;

var xLow = null;

var xHighestIndexBar = null;

var xTrueRange = null;

var xATR = null;

var xLowestUPT = null;

var xHighestTrail = null;


var BarSinseEntry = null;

var BarSinceExit = 0;

var EntryPrice = null;


var prLinearRegSlopeX2 = null;


function main(fpMaxFlDur, fpFlagMin, fpPX, fpUptBars, fpPoleMin,

              fpDistBFlags, fpATRMin, fpK, fpTimeExit,

              fpATRLL, fpBSEMIN, fpATRTRAIL, fpTRAILBARS,

              fpBSEINACT, fpATRINACT, fpLongColor, fpShortColor){


    if (bVersion == null) bVersion = verify();

    if (bVersion == false) return;


    var nX1 = null;

    var nX2 = null;

    var nOffset = -2;

    var nBottom = null;

    var nPole = null;


    if (getBarState() == BARSTATE_ALLBARS){

        BarSinseEntry = null;

        BarSinceExit = 0;

        EntryPrice = null;

        prLinearRegSlopeX2 = null;

    }


    if (!bInit){


    	xClose = close();

    	xLow = low();

        xOpen = open();


        xHighestIndexBar = efsInternal("Calc_HighestBar", xClose, fpMaxFlDur);

        xTrueRange = efsInternal("Calc_TrueRange");

        xATR = sma(40, xTrueRange);

        xLowestUPT = lowest(fpUptBars, xLow);

        xHighestTrail = highest(fpTRAILBARS);


        bInit = true;

    };


    var nClose = xClose.getValue(0);

    var nNextOpen = xOpen.getValue(1);

    var nHighestTrail = xHighestTrail.getValue(0);


    nX1 =  xHighestIndexBar.getValue(nOffset);


    if (nX1 == null)

    	return;


    nX1 = nX1 + -nOffset


    nX2 =  nX1 + 1;


    var nLF = lowest(nX2).getValue(0);

    var nTop = highest(nX2).getValue(-2);


    var xLinearRegSlopeX1 = efsInternal("Calc_LinearRegression_Slope", xClose, nX1);


    var nPrLinearRegSlope = xLinearRegSlopeX1.getValue(-1);

    var nATR = xATR.getValue(0);


    if (nLF == null || nTop == null || nPrLinearRegSlope == null || nATR == null || nHighestTrail == null)

    	return;


    if (nPrLinearRegSlope < 0 && (nTop - nLF) < fpFlagMin * nATR)

    	nX2 = nX1 + 1;

    else

    	nX2 = 100;


    if (nX2 > 2 && nX2 <= fpMaxFlDur){


    	var xLowestIndexBar = efsInternal("Calc_LowestBar", xClose, fpPX + nX2)

    	var nY23 = xLowestIndexBar.getValue(0);


        nBottom = lowest(fpPX + nX2).getValue(0);


    	if (nY23 == null || nBottom == null)

    		return;


    	nPole = nTop - nBottom;


    	if (nPole > fpPoleMin * nATR && nY23 > nX2){


                nTop = highest(nX2).getValue(-2);

    		var nFlagBot = lowest(nX2).getValue(0);

    		var nLowestUPT = xLowestUPT.getValue(0);


    		var nLinearRegSlopeX1 = xLinearRegSlopeX1.getValue(0);


    		var xLinearRegSlopeX2 = efsInternal("Calc_LinearRegression_Slope", xClose, nX1 - 1);

    		var nLinearRegSlopeX2 = xLinearRegSlopeX2.getValue(-2);


                if (nLinearRegSlopeX2 != null)

                    prLinearRegSlopeX2 = nLinearRegSlopeX2;


                if (nLinearRegSlopeX2 == null)

                    nLinearRegSlopeX2 = prLinearRegSlopeX2;


    		var nATR_Y23 = xATR.getValue(-nY23)


    		if (nTop == null || nLowestUPT == null || nATR_Y23 == null){

                    return;

                }


    		var nUPT1 = nBottom - nLowestUPT;


    		var nLRSX1 = nLinearRegSlopeX1 * 100;

    		var nLRSX2 = nLinearRegSlopeX2 * 100;


    		if (getCurrentBarIndex() != 0){


                    if ((!Strategy.isInTrade()) &&

                        (nTop - nLF < fpFlagMin * nATR && (nLRSX1 < 0 || nLRSX2 < 0)) &&

                        (nPole > fpPoleMin * nATR) &&

                        (nUPT1 > 0) &&

                        ( (BarSinceExit == 0) || ( (getCurrentBarCount() - BarSinceExit) > fpDistBFlags) )&&

                        (nATR / nATR_Y23 - 1) * 100 > fpATRMin) {


                            nPrice = highest(nX1).getValue(0);

                            if (nPrice == null)

                                return;


                            nPrice = Math.max(nNextOpen, nPrice);


                            Strategy.doLong("Flag", Strategy.STOP, Strategy.NEXTBAR, Strategy.DEFAULT, nPrice)

                            if (Strategy.isInTrade()){

    			    drawShapeRelative(1, BelowBar1, Shape.UPTRIANGLE, null, fpLongColor, Text.PRESET, getCurrentBarCount()+"Flag");

                            drawTextRelative(1, BelowBar2, "Flag", fpLongColor, null, Text.PRESET|Text.CENTER, null, null, getCurrentBarCount()+"Flag_Text");

                            EntryPrice = nPrice;

    			    BarSinseEntry = getCurrentBarCount()+1;

                            return;

                            }


                }

    	    }

    	}

    }


    if (Strategy.isInTrade()){

    		var nBSE = getCurrentBarCount() - BarSinseEntry;

    		var nX3 = (xHighestIndexBar.getValue(-(nBSE + 2))) - nBSE + 1;

                nX3 = nX3 + nBSE + 2;

    		nTop = highest(nX3).getValue(-(nBSE + 1));

    		nBottom = lowest(fpPX + nX3).getValue(-(nBSE + 1));

    		nPole = (nTop - nBottom)/(nBottom + 0.0001) * 100;

    		var nTargetPer = fpK * nPole;

    		var nPrTarget = (1 + nTargetPer / 100) * EntryPrice;

    		var nL3 = lowest( nX3, low()).getValue(-nBSE);


                if (nClose >= nPrTarget){

    			Strategy.doSell("pTARGET", Strategy.CLOSE, Strategy.THISBAR);

    			drawShapeRelative(0, AboveBar1, Shape.DOWNTRIANGLE, null, fpShortColor, Text.PRESET, getCurrentBarIndex()+"XLall_t");

                        drawTextRelative(0, AboveBar2, "pTARGET", fpShortColor, null, Text.PRESET|Text.CENTER, null, null, getCurrentBarIndex()+"XLall_ts");

    			BarSinceExit = getCurrentBarCount();

    			return;

    		}


    		if (nBSE > fpBSEMIN){

    			var nSell = nL3 - fpATRLL * nATR;


                        nSell = Math.min(nNextOpen, nSell);


    			Strategy.doSell("UNDER FLAG", Strategy.STOP, Strategy.NEXTBAR, Strategy.DEFAULT, nSell)

                        if (!Strategy.isInTrade()){

    		        drawShapeRelative(1, AboveBar1, Shape.DOWNTRIANGLE, null, fpShortColor, Text.PRESET, getCurrentBarIndex()+"XLall_u");

                        drawTextRelative(1, AboveBar2, "UNDER FLAG", fpShortColor, null, Text.PRESET|Text.CENTER, null, null, getCurrentBarIndex()+"XLall_ut");

    			BarSinceExit = getCurrentBarCount();

    			return;

                        }

    		}


    		if (nClose < nHighestTrail - fpATRTRAIL * nATR){

                        Strategy.doSell("TRAIL", Strategy.MARKET, Strategy.NEXTBAR)

    			drawShapeRelative(1, AboveBar1, Shape.DOWNTRIANGLE, null, fpShortColor, Text.PRESET, getCurrentBarIndex()+"XLall_tr");

                        drawTextRelative(1, AboveBar2, "TRAIL", fpShortColor, null, Text.PRESET|Text.CENTER, null, null, getCurrentBarIndex()+"XLall_trt");

    			BarSinceExit = getCurrentBarCount() + 1;

    			return;

    		}


    		if (nBSE > fpBSEINACT && nClose < EntryPrice + fpATRINACT*nATR){

    			Strategy.doSell("INACTIVITY", Strategy.MARKET, Strategy.NEXTBAR)

    			drawShapeRelative(1, AboveBar1, Shape.DOWNTRIANGLE, null, fpShortColor, Text.PRESET, getCurrentBarIndex()+"XLall_i");

                        drawTextRelative(1, AboveBar2, "INACTIVITY", fpShortColor, null, Text.PRESET|Text.CENTER, null, null, getCurrentBarIndex()+"XLall_it");

                        BarSinceExit = getCurrentBarCount();

    			return;

    		}


    		if (nBSE > fpTimeExit){

    			Strategy.doSell("TIME", Strategy.MARKET, Strategy.NEXTBAR)

    			drawShapeRelative(1, AboveBar1, Shape.DOWNTRIANGLE, null, fpShortColor, Text.PRESET, getCurrentBarIndex()+"XLall_m");

                        drawTextRelative(1, AboveBar2, "TIME", fpShortColor, null, Text.PRESET|Text.CENTER, null, null, getCurrentBarIndex()+"XLall_mt");

    			BarSinceExit = getCurrentBarCount();

    			return;

    		}


    }

    return;

}


function Calc_HighestBar(xSource, nLength){


    var nBarNumber = 0;

    var nBarValue = xSource.getValue(0);


    for (i = 1; i <= nLength - 1; i++){

    	var nSource = xSource.getValue(-i);

        if (nSource == null)

            return;

    	if (nSource > nBarValue){

    		nBarValue = nSource;

    		nBarNumber = i;

        }

    }


    return nBarNumber;

}


function Calc_LowestBar(xSource, nLength){


    var nBarNumber = 0;

    var nBarValue = xSource.getValue(0);


    for (i = 1; i <= nLength - 1; i++){

    	var nSource = xSource.getValue(-i);

        if (nSource == null)

            return;

    	if (nSource < nBarValue){

    		nBarValue = nSource;

    		nBarNumber = i;

    	}

    }


    return nBarNumber;

}


function Calc_LinearRegression_Slope(xSourse, nPeriod)

{

    if (getCurrentBarCount() < nPeriod)

        return;


    var nPer = 1;

    var nTime = 0;

    var nTSq = 0;

    var nPrice = 0;

    var nTimePrice = 0;

    var nVal = 0;

    var nSlope = 0;


    for (var i = 0; i < nPeriod; i++)

    {

       nTime += nPer;

       nVal = xSourse.getValue(-(nPeriod - 1) + i);

       nPrice += nVal;

       nTimePrice += (nVal * nPer);

       nTSq += (nPer * nPer);

       nPer++;

    }


    nPer--;


    nSlope = ((nPer * nTimePrice) - (nTime * nPrice)) / ((nPer * nTSq) - (nTime * nTime));


    return nSlope;

}


var xClose = null;

var xHigh = null;

var xLow = null;


function Calc_TrueRange(){


    if (getBarState() == BARSTATE_ALLBARS)

    {

        xClose = close();

        xHigh = high();

        xLow = low();

    }


    var nPrClose = xClose.getValue(-1);


    if (nPrClose == null)

    	return;


    var nHigh = xHigh.getValue(0);

    var nLow = xLow.getValue(0);


    var nTrueHigh = null;

    var nTrueLow = null;


    if (nPrClose > nHigh)

    	nTrueHigh = nPrClose

    else

    	nTrueHigh = nHigh;


    if (nPrClose < nLow)

    	nTrueLow = nPrClose

    else

    	nTrueLow = nLow;


    var nReturnValue = nTrueHigh - nTrueLow;


    return nReturnValue;

}


function verify(){


    var b = false;

    if (getBuildNumber() < 779){


        drawTextAbsolute(5, 35, "This study requires version 8.0 or later.",

            Color.white, Color.blue, Text.RELATIVETOBOTTOM|Text.RELATIVETOLEFT|Text.BOLD|Text.LEFT,

            null, 13, "error");

        drawTextAbsolute(5, 20, "Click HERE to upgrade.@URL=https://www.esignal.com/download/default.asp",

            Color.white, Color.blue, Text.RELATIVETOBOTTOM|Text.RELATIVETOLEFT|Text.BOLD|Text.LEFT,

            null, 13, "upgrade");

        return b;

    }

    else

        b = true;


    return b;

}
—Eric Lippert
eSignal, an Interactive Data company
800 779-6555, www.eSignal.com
BACK TO LIST

THINKORSWIM: DECEMBER 2014
Just in time for the holidays, technician Markos Katsanos has delivered us a fantastic gift in the form of his article in this issue, “Detecting Flags In Intraday Charts.” In the article, Katsanos demonstrates that even the most classic of flag patterns can be used with intraday data.
At thinkorswim, we’ve used our proprietary scripting language thinkScript to build a strategy for detecting trends using this method. We’ve made the loading process extremely easy — simply click on the link https://tos.mx/TQSAVh and choose Backtest in thinkorswim, then choose to rename your study to “IntradayFlagFormation.” You can adjust the parameters of these within the edit studies window to fine-tune your variables.
You can see from the chart in Figure 3 that the strategy on thinkorswim charts will give you entry points — shown as the two blue arrows — when a flag is beginning and when the point forms. You will also see that the peak of the pole is the indicator with the exit point. To see how this Strategy performed simply right click on the exit point and choose Show report. For a detailed description see the article in Technical Analysis of STOCKS & COMMODITIES. Happy swimming!

FIGURE 3: THINKORSWIM. The two blue arrows show entry points for the strategy when a flag is beginning and when the point forms. The peak of the pole is the indicator with the exit point.
—thinkorswim
A division of TD Ameritrade, Inc.
www.thinkorswim.com
BACK TO LIST

WEALTH-LAB: DECEMBER 2014
Detecting chart patterns is always a special joy to code if the provided rules are well-thought-out and fully mechanical. Such is the clear definition of flag patterns given by author Markos Katsanos in his article in this issue, “Detecting Flags In Intraday Charts.”
We’ve used the following simplified set of rules to detect flags:
- A steep pole of A times the average true range (ATR) in B bars
- A flag breaking out in C bars or less from the pole top and sloping horizontally
- Flag depth not more than D times the ATR measured from the highest to the lowest point in the flag
- An uptrend during the last E bars leading up to the pole.
See Figure 4 for a sample chart.
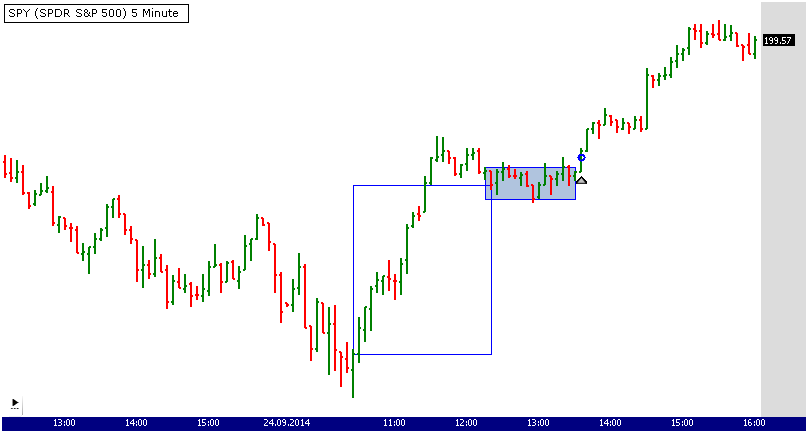
FIGURE 4: WEALTH-LAB, FLAG PATTERN. This sample Wealth-Lab 6 chart illustrates the detection of the flag pattern on a five-minute chart of the SPY (S&P 500 SPDR).
With minimal tweaks to the system’s parameters, this set of rules can be applied to charts of different time frames (such as end-of-day, Figure 5).
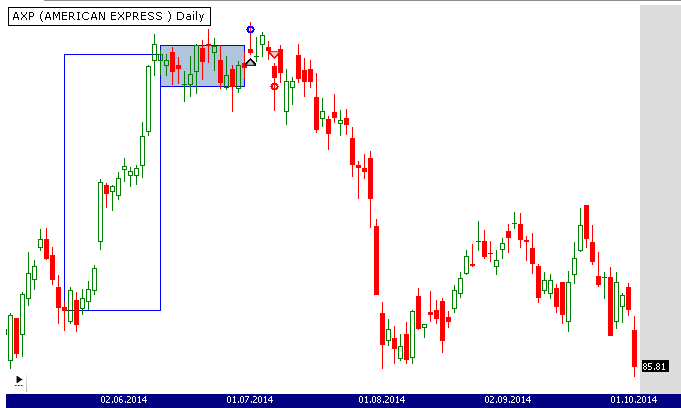
FIGURE 5: WEALTH-LAB, FAILED FLAG. This shows a failed flag on the daily chart of American Express (AXP) in Wealth-Lab 6.
Yet there’s room for improvement: Consider adding a filter against erratic price movement; phase out the less probable trades against the medium-term (daily) trend; and play around with the exits. (To our taste, the initial stop at the flag bottom may result in premature exits; for example, subtracting an ATR from that level could be a more robust approach.)
In addition, we already offer a similar system that looks for tight consolidation ranges, and it is available to Wealth-Lab users along with other related systems that mechanically identify chart patterns. To download it, first download all publicly available strategies (that is, click download in the open strategy dialog). Then look for the strategy named “Rectangle Trading System (Acme R)” in the chart patterns folder.
using System;
using System.Collections.Generic;
using System.Text;
using System.Drawing;
using WealthLab;
using WealthLab.Indicators;

namespace WealthLab.Strategies
{
	public class Katsanos201412 : WealthScript
	{
		private StrategyParameter paramPoleTimeout;
		private StrategyParameter paramFlagTimeout;
		private StrategyParameter paramUptrendBeforePole;
		private StrategyParameter paramMinFlagDuration;
		private StrategyParameter paramMaxFlagDuration;
		private StrategyParameter paramSMAPeriod;
		private StrategyParameter paramInactivityStop;
		private StrategyParameter paramTimeout;

		private StrategyParameter paramPoleHeight;
		private StrategyParameter paramFlagHeight;
		private StrategyParameter paramProfitTarget;

		void DrawRectangle(int b1, int b2, double p1, double p2, Color c)
		{
			double[] rect = { b1, p1, b1, p2, b2, p2, b2, p1 };
			DrawPolygon( PricePane, Color.Blue, c, LineStyle.Solid, 1, true, rect );
		}

		public Katsanos201412()
		{
			paramPoleTimeout = CreateParameter("Pole Timeout", 23, 10, 50, 1);
			paramPoleHeight = CreateParameter("Pole Height", 5.5, 1.0, 10, 0.5);
			paramUptrendBeforePole = CreateParameter("Uptrend Before Pole", 70, 10, 100, 10);
			paramSMAPeriod = CreateParameter("SMA Period", 50, 10, 100, 5);

			paramFlagHeight = CreateParameter("Flag Height", 2.5, 0.5, 5.0, 0.5);
			paramFlagTimeout = CreateParameter("Flag Timeout", 15, 3, 30, 1);
			paramMinFlagDuration = CreateParameter("Min Flag Duration", 3, 3, 30, 1);

			paramInactivityStop = CreateParameter("Inactivity Stop", 70, 10, 100, 10);
			paramTimeout = CreateParameter("Timeout", 100, 10, 100, 10);
			paramProfitTarget = CreateParameter("Profit Target ATR", 1.2, 0.2, 3.0, 0.2);
		}

		protected override void Execute()
		{
			int PoleTimeout = paramPoleTimeout.ValueInt,
				FlagTimeout = paramFlagTimeout.ValueInt,
				UptrendLeadingToPole = paramUptrendBeforePole.ValueInt,
				MinFlagDuration = paramMinFlagDuration.ValueInt,
				smaPeriod = paramSMAPeriod.ValueInt,
				inactivityStop = paramInactivityStop.ValueInt,
				timeout = paramTimeout.ValueInt,
				PoleBar = 0, FlagBar = 0, ba = 0;

			double poleHeight = paramPoleHeight.Value,
				flagHeight = paramFlagHeight.Value,
				currPoleHeight = 0,
				ProfitTarget = paramProfitTarget.Value,
				InitialStop = 0, ws =  0.5, flagTop = 0, flagBottom = 0;
			bool PoleValid = false, FlagValid = false;

			SMA sma = SMA.Series( Close,smaPeriod );
			LinearRegSlope lrs = LinearRegSlope.Series( Close, FlagTimeout );
			HideVolume();

			for(int bar = GetTradingLoopStartBar(100); bar < Bars.Count; bar++)
			{
				if (IsLastPositionActive)
				{
					// Exits
					Position p = LastPosition;
					double atr = ATR.Series( Bars, 40 )[bar];
					double high = p.HighestHighAsOfBar(bar);
					double chandelier = high - atr * 3;
					double inactivity = atr * 4;

					if( ( bar+1 - p.EntryBar >= inactivityStop ) && ( p.MFEAsOfBar( bar ) < inactivity ) )
						SellAtMarket( bar+1, p, "Inactivity+MFE" );
						else
						if( bar+1 - p.EntryBar >= timeout )
							SellAtMarket( bar+1, p, "Time exit" );
					else
					if( !SellAtStop( bar+1, p, p.RiskStopLevel, "Stop loss" ) )
						if( !SellAtStop( bar+1, p, chandelier, "Trailing (Chandelier)" ) )
							SellAtLimit( bar+1, p, p.AutoProfitLevel, "Profit Target" );
				}
				else
				{

					if( !PoleValid )
					{
						//Uptrend during the last 70 bars leading to the pole.

						if(Lowest.Value( bar, Close, PoleTimeout ) > Lowest.Value( bar, Close, UptrendLeadingToPole ))
						{
							//A steep pole of 5.5 times the average true range (ATR) or more, in 23 bars or less.

							currPoleHeight = Close[PoleBar] - Close[bar - PoleTimeout];
							double atr = ATR.Value(bar, Bars, 40);
							PoleBar = bar;
							PoleValid = currPoleHeight >= atr * poleHeight ? true: false;
						}
					}

					if( PoleValid )
					{
						if( !FlagValid )
						{
							//A flag breaking out in 15 bars or less from the pole top and sloping horizontally or slightly down.

							if( bar <= PoleBar + FlagTimeout && bar >= PoleBar + MinFlagDuration ) // To avoid premature triggering
							{
								flagTop = Highest.Value( bar, Close, FlagTimeout );
								flagBottom = Lowest.Value( bar, Close, FlagTimeout );
								InitialStop = flagBottom;
								double flagRange = flagTop - flagBottom;
								double atr = ATR.Value(bar, Bars, 40);
								double slope = lrs[bar];
								bool isSlopeOK = slope > -0.04 && slope <= 0.01;

								//Flag depth not more than 2.5 times the ATR measured from the highest to the lowest point in the flag.

								if( flagRange <= atr * flagHeight && isSlopeOK )
								{
									FlagValid = true; FlagBar = bar;
								}
							}
							else
								PoleValid = bar + 1 - PoleBar < PoleTimeout;	// reset if Setup has timed out
						}

						if( FlagValid )
						{
							if( BuyAtStop( bar + 1, Highest.Value(bar, High, FlagTimeout) ) != null )
							{
								// Draw flag and pole
								DrawRectangle( FlagBar, FlagBar-FlagTimeout, flagTop, flagBottom, Color.LightSteelBlue );
								DrawRectangle( PoleBar, PoleBar-PoleTimeout, Close[PoleBar], Close[PoleBar-PoleTimeout], Color.Transparent );

								// Assign initial stop and profit target levels
								LastPosition.AutoProfitLevel = LastPosition.EntryPrice + currPoleHeight * ProfitTarget;
								LastPosition.RiskStopLevel = InitialStop;

								PoleValid = false; FlagValid = false;	// reset Setup variables
							}
							else
								// reset if Setup has timed out
							{
								PoleValid = bar + 1 - PoleBar < PoleTimeout;
								FlagValid = false;
								flagTop = 0;
								flagBottom = 0;
							}
						}
					}
				}
			}
		}
	}
}
To sum up, the proposed technique is useful to recognize brief retreats in steep trends.
—Eugene, Wealth-Lab team
MS123, LLC
www.wealth-lab.com
BACK TO LIST

NEUROSHELL TRADER: DECEMBER 2014
The strategy presented in Markos Katsanos’ article in this issue for flag detection (“Detecting Flags In Intraday Charts”) can be easily implemented in NeuroShell Trader using NeuroShell Trader’s ability to call external programs. The programs may be written in C, C++, Power Basic, or Delphi.
After moving the EasyLanguage code given in Katsanos’ article to your preferred compiler and creating a dynamic link library (DLL), you can insert the resulting entry and profit target indicators as follows:
- Select “New indicator...” from the Insert menu.
- Choose the external program & library calls category.
- Select the appropriate external DLL call indicator.
- Setup the parameters to match your DLL.
- Select the finished button.
To recreate the intraday flag trading system, select “New trading strategy” from the Insert menu and enter the following in the appropriate locations of the trading strategy wizard:
BUY LONG CONDITIONS:
	Intraday Flag Entry Signal( High, Low, Close)

BUY STOP PRICE:
	Intraday Flag Entry Stop( High, Low, Close)

LONG TRAILING STOP PRICES:
	TrailPriceATR(Trading Strategy, 40, 3)

SELL LONG CONDITIONS: [1 of which must be true]
	Intraday Flag Profit Target Signal( High, Low, Close)
	Inactivity%(Trading Strategy, 10, 15)
If you have NeuroShell Trader Professional, you can also choose whether the parameters should be optimized. After backtesting the trading strategy, use the detailed analysis button to view the backtest and trade-by-trade statistics for the strategy.
Users of NeuroShell Trader can go to the Stocks & Commodities section of the NeuroShell Trader free technical support website to download a copy of this or any previous Traders’ Tips.
A sample chart is shown in Figure 6.

FIGURE 6: NEUROSHELL TRADER, intraday flag strategy. This NeuroShell Trader chart displays the intraday flag trading strategy.
—Marge Sherald, Ward Systems Group, Inc.
301 662-7950, sales@wardsystems.com
www.neuroshell.com
BACK TO LIST

AMIBROKER: DECEMBER 2014
In “Detecting Flags In Intraday Charts” in this issue, author Markos Katsanos proposes using flag chart formations as a entry signal for 15-minute chart trading. Chart formations are highly subjective and difficult to express in strict mathematical rules. What is “clearly visible” to the eye is not that clear when mathematical rules are applied. In the article, Katsanos has made an attempt to code flag formation detection and provides EasyLanguage code for his technique. The formula we are presenting is more or less a direct translation of his code into AmiBroker Formula Language (AFL).
The AFL code is shown below, as well as at the AmiBroker site.
LISTING 1.
maxfldur = 15; // max flag duration
flagmin = 2.5; // max atr in lowest point in flag
px = 23; //Max Pole Duration.
upt1bars = 70; // Bars for Uptrend leading to flag
polemin = 5.5; //Min ATR Height of the pole
lbf = 50; // Min distance between flags
ATRmin = 5;// Min volatility change
K = 1.2; //Profit Target constant
timeexit = 100; //Time exit bars
atrLL = 3; // max loss distance in ATR units
atrTrail = 3; // trail distance in ATR uints

// FLAG CALCULATION
X1 = Ref( HHVBars( C, maxfldur ), -2 );//Flag duration ex pole top
X2 = X1 + 1; //Flag duration including pole top
LF = LLV( C, X2 );
TOP = Ref( HHV( C, X2 ), -2 );
X2 = IIF( Ref( LinRegSlope( C, X1 ), -1 ) < 0 AND TOP - LF < flagmin * ATR( 40 ), X1 + 1, 100 );

PreCond1 = X2 > 2 AND X2 <= maxfldur; //Limits flag duration
Y23 = LLVBars( C, PX + X2 ); // Pole bottom bar
BOTTOM = LLV( C, ( PX + X2 ) );// Pole bottom
POLE = TOP - BOTTOM;
PreCond2 = TOP - BOTTOM > polemin * ATR( 40 ) AND Y23 > X2;
TOP = Ref( HHV( C, X2 ), -2 );
FLAGBOT = LLV( C, X2 );
UPT1 = BOTTOM - LLV( L, upt1bars ); //Uptrend leading to flag
LRSX1 = LinRegSlope( C, X1 ) * 100; //Slope in flag
LRSX2 = Ref( LinRegSlope( C, X1 - 1 ), -2 ) * 100; //Slope in flag before breakout
Condition1 = TOP - LF < flagmin * ATR( 40 ) AND ( LRSX1 < 0 OR LRSX2 < 0 ); //Limits flag slope between 0 and -3 ATR
Condition2 = POLE > polemin * ATR( 40 ); //Limits min pole height
Condition3 = UPT1 > 0; //Uptrend leading to flag
Condition4 = ( ATR( 40 ) / Ref( ATR( 40 ), Y23 ) - 1 ) * 100 > ATRmin; //Volatility

TriggerPrice = HHV( C, X1 );

Buy = PreCond1 AND PreCond2 AND Condition1 AND Condition2 AND Condition3 and Condition4 AND H > TriggerPrice;
BuyPrice = TriggerPrice;

Sell = 0; // all exits using stops

ApplyStop( stopTypeNBar, stopModeBars, timeexit ); // time exit
ApplyStop( stopTypeProfit, stopModePoint, k * pole, True ); // profit target
ApplyStop( stopTypeTrailing, stopModePoint, atrTrail * ATR( 40 ), True, True ); // trailing
ApplyStop( stopTypeLoss, stopModePoint, atrLL * ATR( 40 ), True );

Equity( 1 ); // evaluate stops

Plot( C, "Price", colorDefault, styleBar | styleThick );
PlotShapes( IIf( Buy, shapeUpArrow, 0 ), colorGreen, 0, Low );
PlotShapes( IIf( Sell, shapeDownArrow, 0 ), colorRed, 0, High );

Title = Name() + " " + Date() + " Price = " + Close + " Signal : " + WriteIf( Buy, "Entry",
         WriteIf( Sell == 2, "Max loss",
         WriteIf( Sell == 3, "Profit target",
         WriteIf( Sell == 4, "Trailing stop",
         WriteIf( Sell == 5, "Time stop", "None" ) ) ) ) );
A sample chart demonstrating flag detection based on Katsanos’ approach is shown in Figure 7.
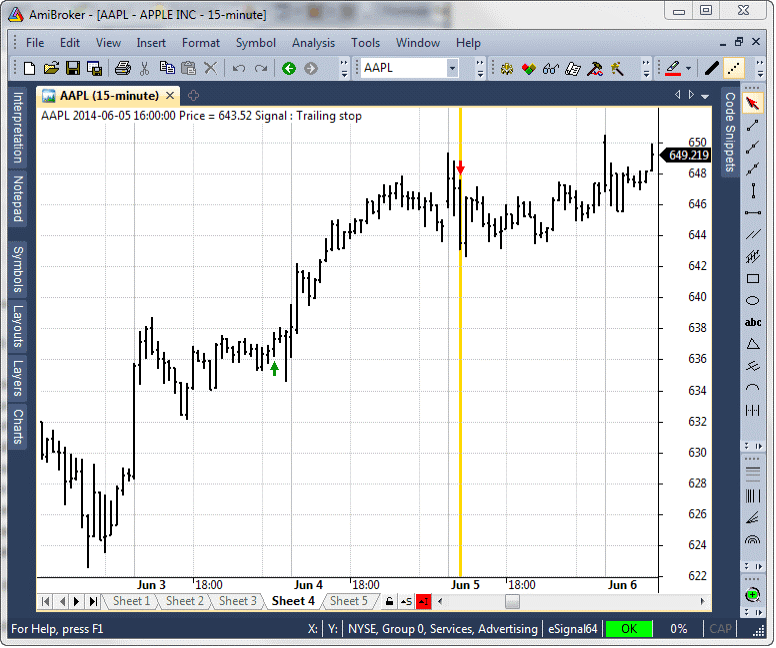
FIGURE 7: AMIBROKER, FLAG. Here is an example of a detected flag formation on a 15-minute chart of AAPL. The buy signal is represented by the green arrow and a trailing stop is represented by the red arrow.
—Tomasz Janeczko, AmiBroker.com
www.amibroker.com
BACK TO LIST

NINJATRADER: DECEMBER 2014
The intraday flag strategy presented in “Detecting Flags In Intraday Charts” by Markos Katsanos in this issue has been made available for download at www.ninjatrader.com/SC/December2014SC.zip.
Once you have it downloaded, from within the NinjaTrader Control Center window, select the menu File → Utilities → Import NinjaScript and select the downloaded file. This file is for NinjaTrader version 7 or greater.
You can review the strategy source code by selecting the menu Tools → Edit NinjaScript → Strategy from within the NinjaTrader Control Center window and selecting the “IntradayFlags” file.
A sample chart implementing the strategy is shown in Figure 8.
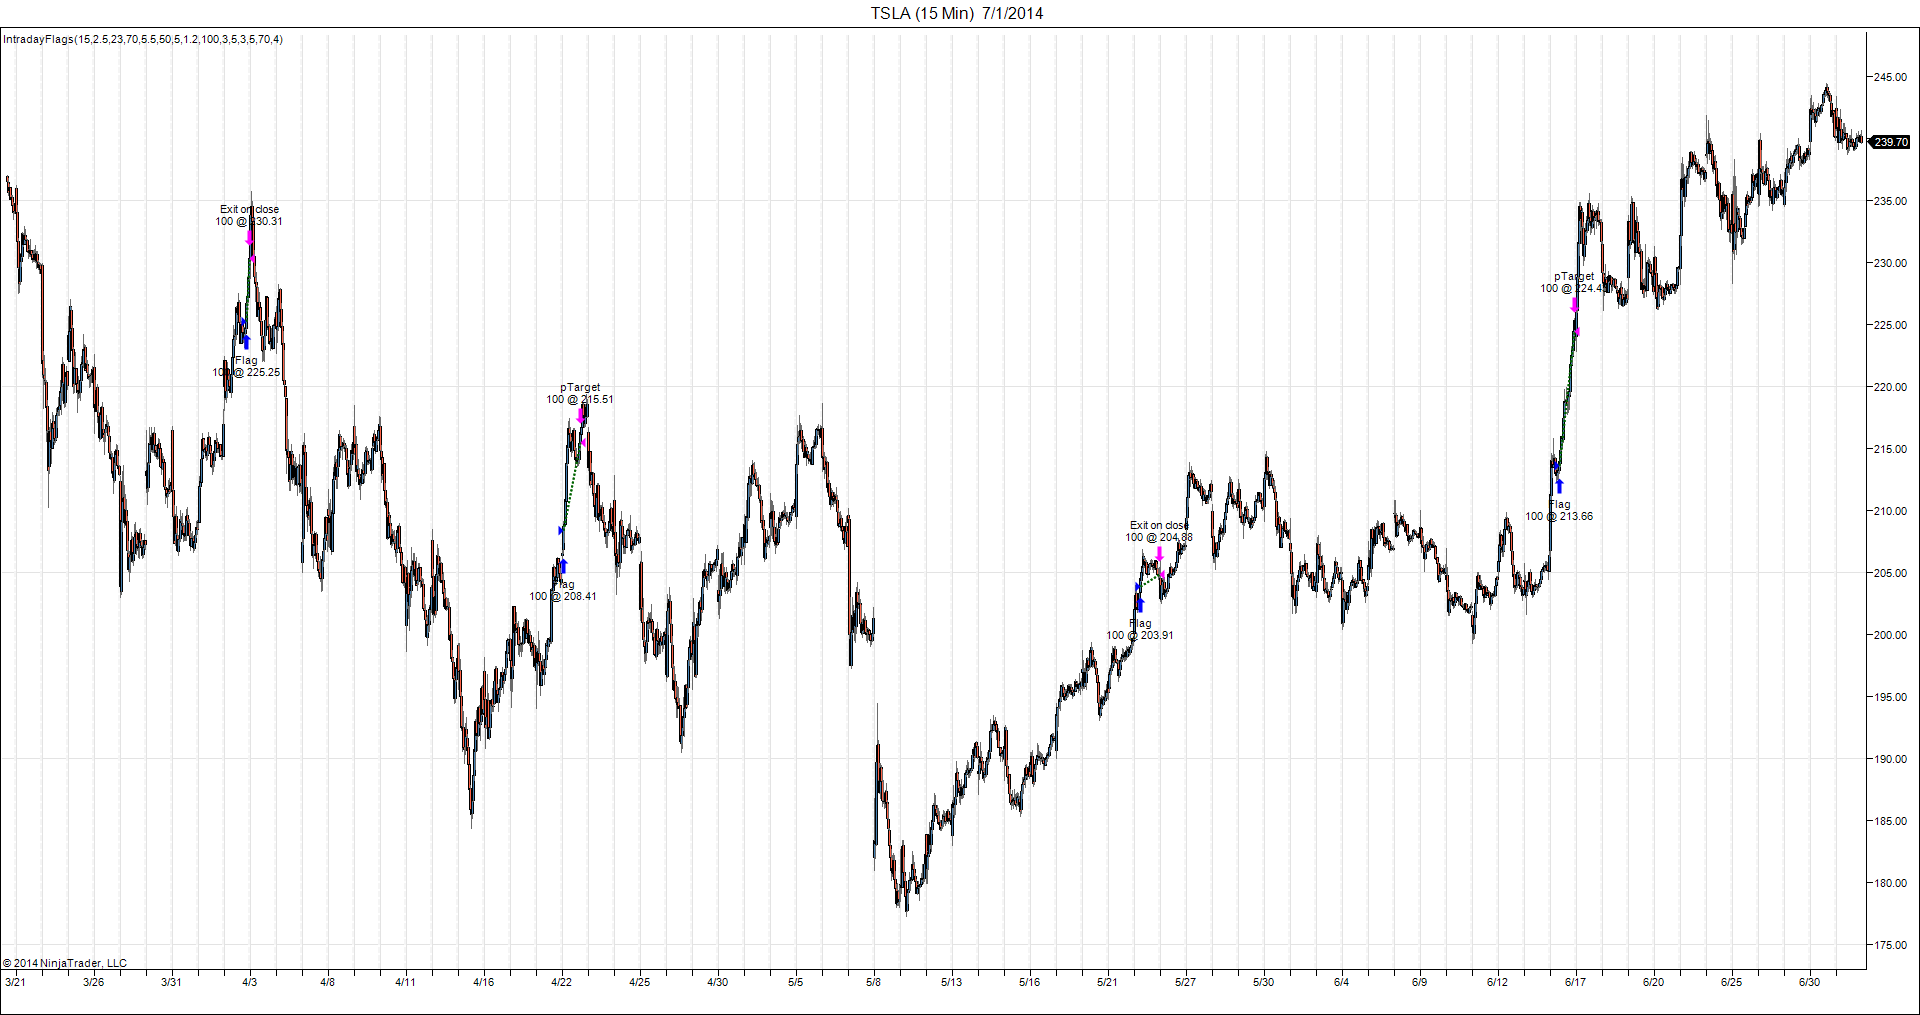
FIGURE 8: NINJATRADER. The screenshot shows the IntradayFlags strategy applied to a 15-minute chart of Tesla Motors (TSLA) in NinjaTrader.
—Raymond Deux & Paul Hunt
NinjaTrader, LLC
www.ninjatrader.com
BACK TO LIST

UPDATA: DECEMBER 2014
Our Traders’ Tip for this month is based on “Detecting Flags In Intraday Charts” by Markos Katsanos in this issue.
In the article, the author proposes a set of rules to find flag continuation patterns in intraday financial data. Flags are defined according to five key criteria or conditions, mostly relating to some minimum height and width requirements of the flag, as measured by average true range (ATR). Once you are in a trade, there are five types of time-based or price-based exit strategies you can use.
We have added some custom Updata code based on Katsanos’ article to the Updata library, which may be downloaded by clicking the custom menu and then system library. Those who cannot access the library due to a firewall may copy the code shown below and paste it into the Updata custom editor and save it. See Figure 9 for a sample chart.
'Intraday Flag Strategy
PARAMETER "Max Flag Duration" #MAXFLDUR=15
PARAMETER "Max ATR @ Flag Low" @FLAGMIN=2.5
PARAMETER "Max Pole Duration" #PX=23
PARAMETER "Bars Up To Flag" #UPTIBARS=70
PARAMETER "Min ATR Pole Height" @POLEMIN=5.5
PARAMETER "Min Flag Distance" #LBF=50
PARAMETER "Min Volatility Change" #ATRMin=5
PARAMETER "Profit Target Const." @K=1.2
PARAMETER "Time Exit Bars" #TIMEEXIT=100
PARAMETER "Below Flag StopLoss" #ATRLL=3
PARAMETER "Trailing Stop ATR" @ATRTRAIL=3
PARAMETER "Trailing Stop Bars" #TRAILBARS=5
PARAMETER "Entry Inactivity Bars" #BSEINACT=70
PARAMETER "Entry Inactivity ATR" #ATRINACT=4

@X1=0
@X2=0
@X3=0
@LF=0
@TOP=0
@Y23=0
@BOTTOM=0
@POLE=0
@FLAGBOT=0
@UPT1=0
@LRSX1=0
@LRSX2=0
@CONDITION1=0
@CONDITION2=0
@CONDITION3=0
@CONDITION4=0
@CONDITION5=0
#BARSSINCEEXIT=0
#BUYORDER=0
@BUYENTRYLEVEL=0
@ENTRYPRICE=0
@targetPER=0
@targetPRICE=0
@L3=0
@TRAILINGSTOP=100000
@STOP=0
FOR #CURDATE=0 TO #LASTDATE
   'FLAG CALCULATION
   @X1=PHIGH(CLOSE,#MAXFLDUR)
   @X2=@X1+1
   @LF=PLOW(CLOSE,@X2)
   @TOP=PHIGH(CLOSE,@X2)
   IF (LSR(CLOSE,@X2,0,0)-LSR(CLOSE,@X2,0,@X2))<0 AND (@TOP-@LF)<@FLAGMIN*ATR(40)
      @X2=@X1+1
   ELSE
     @X2=100
   ENDIF
   IF @X2>2 AND @X2<#MAXFLDUR
      @Y23=PLOW(CLOSE,#PX+@X2)
      @BOTTOM=PLOW(CLOSE,#PX+@X2)
      @POLE=@TOP-@BOTTOM
   ENDIF
   IF @POLE>@POLEMIN*ATR(40) AND @Y23>@X2
      @TOP=PHIGH(CLOSE,@X2)
      @FLAGBOT=PLOW(CLOSE,@X2)
      @UPT1=@BOTTOM-PLOW(LOW,#UPTIBARS)
   ENDIF
   @LRSX1=(LSR(CLOSE,@X1,0,0)-LSR(CLOSE,@X1,0,@X1))*(100/@X1)
   @LRSX2=(LSR(CLOSE,@X1-1,0,0)-LSR(CLOSE,@X1-1,0,@X1-1))*(100/(@X1-1))
   @CONDITION1=(@TOP-@LF)<@FLAGMIN*ATR(40) AND (@LRSX1<0 OR @LRSX2<0)
   @CONDITION2=@POLE>@POLEMIN*ATR(40)
   @CONDITION3=@UPT1>0
   @CONDITION4=(#BARSSINCEEXIT=0) OR (#BARSSINCEEXIT>#LBF)
   @CONDITION5=ATR(40)/HIST(ATR(40),@Y23-1)*100>#ATRMin
   IF #BUYORDER=TRUE AND HIGH>@BUYENTRYLEVEL
      BUY @BUYENTRYLEVEL
      #BUYORDER=FALSE
      @ENTRYPRICE=@BUYENTRYLEVEL
   ENDIF
   IF @CONDITION1=@CONDITION2=@CONDITION3=@CONDITION4=@CONDITION5=1
      #BUYORDER=TRUE
      @BUYENTRYLEVEL=PHIGH(CLOSE,@X1)
   ENDIF
   'EXIT CONDITIONS
   IF ORDERISOPEN=1
      @X3=PHIGH(CLOSE,ORDEROPENFOR+#MAXFLDUR)
      @TOP=PHIGH(CLOSE,@X3+ORDEROPENFOR)
      @BOTTOM=PLOW(CLOSE,#PX+@X3)
      @POLE=100*(@TOP-@BOTTOM)/(@BOTTOM+0.0001)
      @targetPER=@K*@POLE
      @targetPRICE=(1+@targetPER/100)*@ENTRYPRICE
      @L3=PLOW(LOW,@X3+ORDEROPENFOR)
   ENDIF
   'PROFIT TARGET
   IF CLOSE>@targetPRICE
      SELL @targetPRICE
   ENDIF
   'STOP
   IF ORDEROPENFOR>#BSEINACT
      @STOP=@L3-#ATRLL*ATR(40)
      If CLOSE<@STOP
         SELL @STOP
       EndIf
   ENDIF
   'TRAILING STOP
   IF HIST(CLOSE<PHIGH(CLOSE,#TRAILBARS)-@ATRTRAIL*ATR(40),1)
      SELL CLOSE
   ENDIF
   'INACTIVITY EXIT
   IF ORDEROPENFOR>#BSEINACT AND HIST(CLOSE<@ENTRYPRICE+#ATRINACT*ATR(40),1)
      SELL CLOSE
   ENDIF
   'TIME EXIT
   IF HIST(ORDEROPENFOR>#TIMEEXIT,1)
      SELL CLOSE
   ENDIF
NEXT
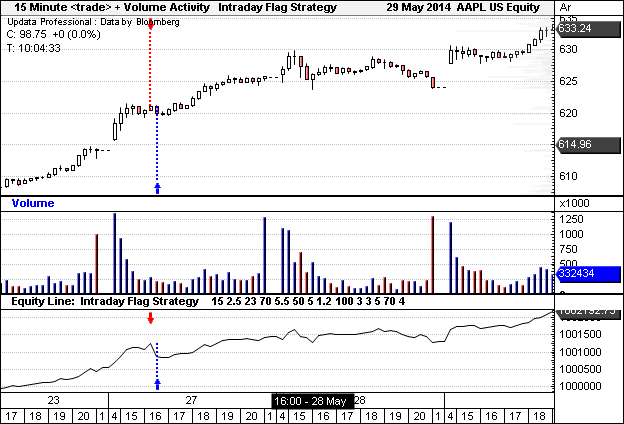
FIGURE 9: UPDATA. Here is an example of the intraday flag strategy applied to a chart of Apple Inc. (AAPL) in 15-minute resolution.
—Updata support team
support@updata.co.uk
www.updata.co.uk
BACK TO LIST

AIQ: DECEMBER 2014
The AIQ code based on Markos Katsanos’ article in this issue, “Detecting Flags In Intraday Charts,” is provided at www.TradersEdgeSystems.com/traderstips.htm, and is also shown here:
!DETECTING FLAGS IN INTRADAY CHARTS

!Author: Markos Katsanos, TASC December 2014

!Coded by: Richard Denning 10/18/14


!USER DEFINED FUNCTIONS:

C is [close].

Name is description().


!COMPLETED FLAG PATTERN:

FLAG is [Flag].

FLAG_breakoutup if FLAG > 0.

FLAG_breakoutdn if FLAG < 0.


!EMERGING FLAG PATTERN:

e_FLAG is [eFLAG].

e_FLAGup if e_FLAG > 0.

e_FLAGdn if e_FLAG < 0.


!REPORTS TO LIST ALL FLAG PATTERS:

ShowAllCompleted if C>0 and FLAG <> 0.

ShowAllEmerging if C>0 and e_FLAG <>0.
The AIQ program has a chart-pattern recognition module that operates only in daily mode. I am providing code to find both completed flag patterns and also emerging flag patterns.
In Figure 10, I show a chart of G-III Apparel Group Ltd., which shows a flag pattern completed on June 25, 2014 (green up arrow), when the price broke above the down-sloping flag top. Although the volume was above average on the breakout, the followthrough was lacking.

FIGURE 10: AIQ. This sample chart shows G-III Apparel Group Ltd. (GIII) with a completed flag pattern (indicated by the green up arrow).
Note that I did not code exits for the pattern, as the built-in exits can be used to experiment with the flag pattern entry. Note also that the AIQ version of flags does not match exactly the intraday flags that are defined by Katsanos in his article.
—Richard Denning
info@TradersEdgeSystems.com
for AIQ Systems
BACK TO LIST

TRADERSSTUDIO: DECEMBER 2014
The TradersStudio code based on Markos Katsanos’ article in this issue, “Detecting Flags In Intraday Charts,” is provided at the following websites:
The following code files are provided in the download:
- Function POLE: Returns a “1” if, based on the inputs, a sharp runup has occurred, otherwise returns a zero
- Function FLAG: Returns a “1” if, based on the inputs, a flag has formed, otherwise returns a zero
- Function FLAG_BREAKUP: Returns a “1” if, based on the inputs, a breakout from a flag has occurred on the current bar, otherwise returns a zero
- System HIGH_FLAG_sys: Long-only buy next bar at market after flag breakout, then exit using one of three exits (time, profit target, or stop-loss)
The code is also shown here:
'DETECTING FLAGS IN INTRADAY CHARTS
'Author: Markos Katsanos, TASC December 2014
'Coded by: Richard Denning 10/18/14
'www.adersEdgeSystems.com

Function POLE(atrPoleHeight,flagPoleLen,atrLen,ByRef poleHeight)
'atrPoleHeight=5.5,flagPoleLen,atrLen
poleHeight = Highest(H,flagPoleLen)-Lowest(L,flagPoleLen)
If poleHeight/avgtruerange(atrLen)>atrPoleHeight Then
    POLE = 1
Else POLE = 0
End If
End Function
'-----------------------------------------------------------------------------------------------
Function FLAG(maxFlagLen,minFlagLen,maxFlagDepth,atrLen)
Dim poleHigh
Dim barsToHigh
poleHigh = Highest(H,maxFlagLen)
barsToHigh = MRO(H=poleHigh,maxFlagLen,1)
If countof(H > poleHigh,barsToHigh,0)=0 And barsToHigh >= minFlagLen Then
    If (Highest(H,maxFlagLen) - Lowest(L,maxFlagLen))/avgtruerange(atrLen) <= maxFlagDepth Then
        FLAG = 1
    End If
Else
    FLAG = 0
End If
End Function
'------------------------------------------------------------------------------------------------
Function FLAG_BREAKUP(maxFlagLen,minFlagLen,maxFlagDepth,flagPoleLen,atrLen)
'maxFlagLen=15,minFlagLen=5,maxFlagDepth=2.5,flagPoleLen=23,atrLen=50
If Highest(H,maxFlagLen+flagPoleLen,1)=Highest(H,flagPoleLen,1) Then
    If H > Highest(H,maxFlagLen,1) And FLAG(maxFlagLen,minFlagLen,maxFlagDepth,atrLen) Then
        FLAG_BREAKUP = 1
    End If
Else
    FLAG_BREAKUP = 0
End If
End Function
'-------------------------------------------------------------------------------------------------
'COUNTOF Function
'returns how many times a rule is true in the lookback length
'coded by Richard Denning 01/04/08

Function COUNTOF(rule As BarArray, countLen As Integer, offset As Integer)
Dim count As Integer
Dim counter As Integer
    For counter = 0 + offset To countLen + offset - 1
        If rule[counter] Then
            count = count + 1
        End If
    Next
COUNTOF = count
End Function
'------------------------------------------------------------------------------------------------------------------------
Sub HIGH_FLAG_sys(atrPoleHeight,flagPoleLen,atrLen,maxFlagLen,minFlagLen,maxFlagDepth,trendLen,maxBars,profitTargetMult)
'atrPoleHeight=5.5,flagPoleLen=23,atrLen=50,maxFlagLen=15,minFlagLen=5,maxFlagDepth=2.5,maxBars=20,profitTargetMult=1.2
Dim isPOLE As BarArray
Dim isFlagBU As BarArray
Dim isUpTrend As BarArray
Dim higherVola As BarArray
Dim poleHeight As BarArray
isPOLE = POLE(atrPoleHeight,flagPoleLen,atrLen,poleHeight)
isFlagBU = FLAG_BREAKUP(maxFlagLen,minFlagLen,maxFlagDepth,flagPoleLen,atrLen)
isUpTrend = IIF(C>Average(C,trendLen),1,0)
higherVola = avgtruerange(atrLen) < Avgtruerange(maxFlagLen)
If isPOLE And isFlagBU And isUpTrend Then Buy("LE",1,0,Market,Day)
If BarsSinceEntry > maxBars Then ExitLong("LX_time","",1,0,Market,Day)
If C >= EntryPrice + poleHeight[BarsSinceEntry] Then ExitLong("LX_pt","",1,0,Market,Day)
If C < Lowest(L,flagPoleLen,BarsSinceEntry) Then ExitLong("LX_sl","",1,0,Market,Day)
End Sub
'--------------------------------------------------------------------------------------------------------------------------
Note that the parameters were taken from the author’s intraday testing and may not be the desired ones for daily bar trading. Note also that this system cannot be used to trade intraday, as TradersStudio does not as yet have a real-time module, although historical intraday testing can be done on saved intraday data.
In Figure 11, I show a chart of Autodesk (ADSK) with a flag breakout trade that exited at the profit target.

FIGURE 11: TRADERSSTUDIO. Here is an example flag breakout trade that reached the profit target on Autodesk (ADSK).
—Richard Denning
info@TradersEdgeSystems.com
for TradersStudio
BACK TO LIST
MICROSOFT EXCEL: DECEMBER 2014
The techniques presented in Markos Katsanos’ article in this issue, “Detecting Flags In Intraday Charts, can be applied at tick, end-of-day, weekly, and longer bar-size intervals. For ease of data access, I have used American Airlines (AAL) end-of-day data for this example (Figure 12).
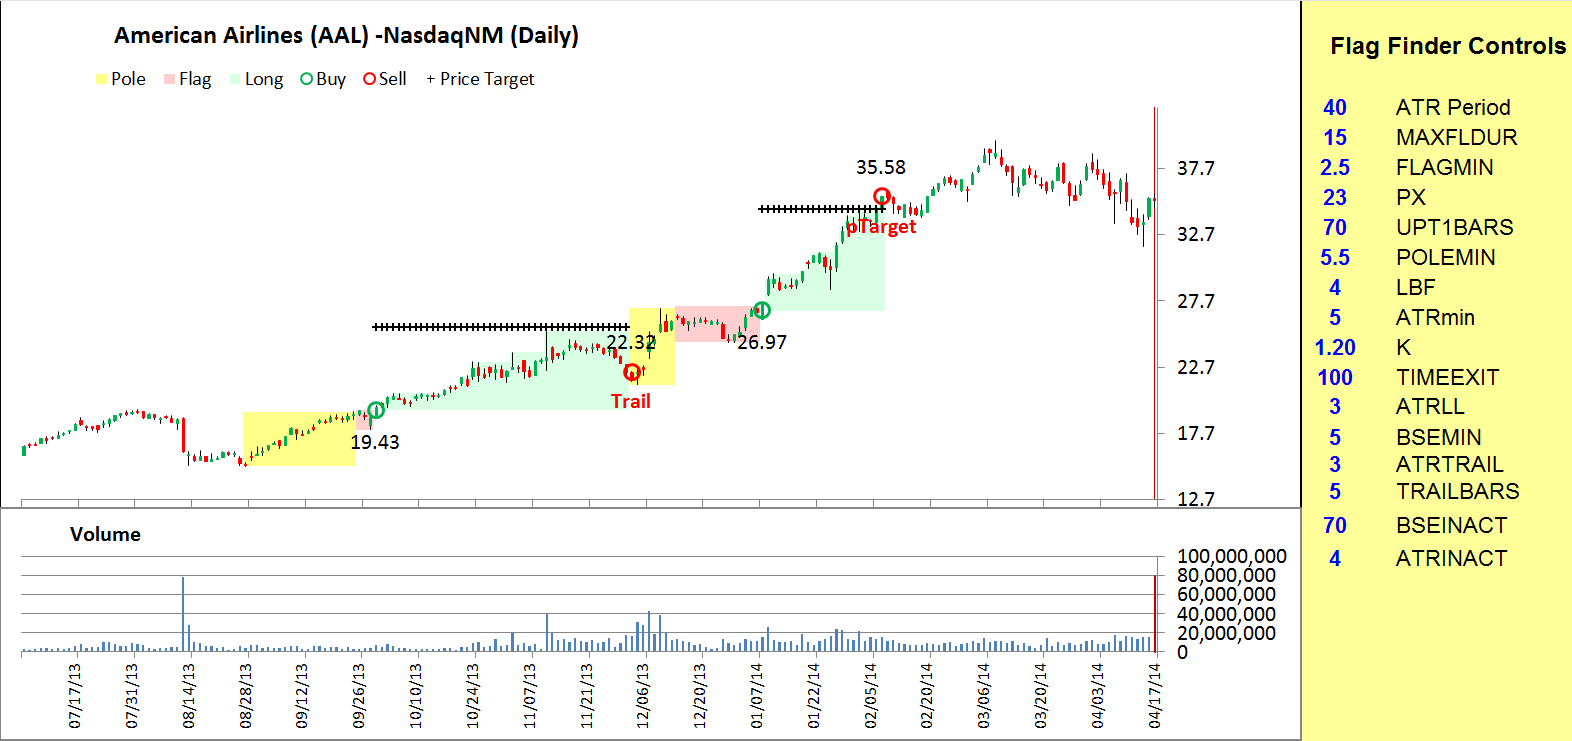
FIGURE 12: EXCEL, TRADE COMBINATIONS. Price chart with two pole, flag, and trade combinations. A short LBF falue found these.
The 16 user control values used in the article provide a lot of opportunities for exploration. For example, here, an LBF of 4 finds two adjacent profitable flags. LBF=50 as shown in the article only finds one of these.
K, the pole multiplier used to set the price target, also can have significant impact on trades and the location of additional examples.
As built, this spreadsheet will not highlight pole and flag combinations that do not lead to a breakout and trade initiation.
Also, as built, the high of a bar may exceed the target price, but the trade may not exit. The logic provided in the article requires that the close of the bar must exceed the target price to initiate a price target close.
The spreadsheet file for this Traders’ Tip can be downloaded below. To successfully download it, follow these steps:
—Ron McAllister
Excel and VBA programmer
rpmac_xltt@sprynet.com
BACK TO LIST
Originally published in the December 2014 issue of
Technical Analysis of Stocks & Commodities magazine.
All rights reserved. © Copyright 2014, Technical Analysis, Inc.


