TRADERS’ TIPS
February 2015
For this month’s Traders’ Tips, the focus is Dave Cline’s article in this issue, “Candlesticks, Condensed.” Here, we present the February 2015 Traders’ Tips code with possible implementations in various software.
Code in the Python language is already provided by Cline, which S&C subscribers will find in the Subscriber Area of our website here.
The Traders’ Tips section is provided to help the reader implement a selected technique from an article in this issue or another recent issue. The entries here are contributed by software developers or programmers for software that is capable of customization.

TRADESTATION: FEBRUARY 2015
In “Candlesticks, Condensed” in this issue, author Dave Cline describes a process for condensing every candle on a chart into three numbers: HO (high-open), HC (high-close) and OL (open-low). Each number is a fraction of the average daily range. The three numbers together (HO:HC:OL) make up the bar’s signature. We are providing two indicators based on this process. The first calculates the signature and reproduces Cline’s statistical summary. The code demonstrates the use of vectors and forms. The second locates bars with a desired input signature on the chart under study.
To download the EasyLanguage code, please visit our TradeStation and EasyLanguage support forum. The code from this article can be found here: https://www.tradestation.com/TASC-2015. The ELD filename is “_TASC_CondensedCandlesticks.ELD.”
For more information about EasyLanguage in general, please see: https://www.tradestation.com/EL-FAQ.
A sample chart demonstrating these two indicators is shown in Figure 1.

FIGURE 1: TRADESTATION. This depicts the indicator CondensedCandlesticks running on a monthly chart of SPY that starts with the February 1993 bar. The indicator generates the above info-grid displaying the most common CondensedCandlesticks. The signature column displays HO:HC:OL values. To display the bars with a specific signature, the indicator CondensedCandlestickLocator is provided. In this case, we are displaying the signature 4:1:1. The desired signature bars are noted with a cyan dot.n
This article is for informational purposes. No type of trading or investment recommendation, advice, or strategy is being made, given, or in any manner provided by TradeStation Securities or its affiliates.
_TASC_CONDENSEDCANDLES.ELD
_CondensedCandles91 (Indicator)
{
CondensedCandles is based upon the Article "Candlesticks, Condensed" by David Cline
appearing in the February 2015 issue of Technical Analysis of Stocks & Commodities

This indicator is designed to output the grid shown in Figure 6 of the article.

Intrabar Ticks should be TURNED OFF on the Indicator
}

using elsystem ;
using elsystem.collections ;
using elsystem.windows ;
using elsystem.windows.forms ;

inputs:
	iAvgRngLen( 12 ),
	iSegmentCount( 5 ),
	iMos2MosCount( 4 ) ;

variables:
	{ BarsData is a dictionary with the key being the BarNumber.ToString and the
	  value being BarData vector corresponding to that bar }
	Dictionary BarsData( NULL ),

	{
	The BarData vector simulates a class to hold specific data about a bar
	in specific elements using the bv... constants as indices.  There is a
	BarData vector in the BarsData dictionary for each bar we process
	}
	Vector BarData( NULL ),
	Vector PatternBarData( NULL ),
	Vector SortVector( NULL ),
	{
	Patterns is a dictionary with the key being the signature and the value
	being a dictionary with specific named items to hold all the needed
	calculated values for the signature.

		The Names slots include:
		Signature		- Repeats signature
		Count			- Count of number of bars with the signature
		PctCount<n>		- Count of number of occurences of <n>-month
		PctUpCount<n>	- Count of number of Up occurences of <n>-month
		AvgCumm<n>		- n-month cummulative gain/loss
	}
	Dictionary Patterns( NULL ),

	{ Dictionary of actual pattern data - used for current pattern }
	Dictionary PatternData( NULL ),

	SegmentDivisor( 0.0 ),
	AverageRange( 0.0 ),
	CandleRange( 0.0 ),
	RangeMultiplier( 0.0 ),
	HO( 0.0 ),
	HC( 0.0 ),
	OL( 0.0 ),
	CandleSignature( "" ),
	int M2MBack( 0 ),
	M2MBackStr( "" ),
	intrabarpersist int PatternsCount( 0 ),
	PatternBarNo( 0 ),
	PatternBarNoStr( "" ),
	int PatternIndex( 0 ) ;

variables:
	form FGrid( NULL ),
	Panel Pnl( NULL ),
	DataGridView Grd( NULL ),
	DataGridViewColumn Col( NULL ),
	DataGridViewRow Row( NULL ) ;

constants:
	bsOpening( 0 ),
	bsWithin( 1 ),
	bsClosing( 2 ),

	{ BarData Element Indices }
	bvNumber( 0 ),
	bvOpen( 1 ),
	bvHigh( 2 ),
	bvLow( 3 ),
	bvClose( 4 ),
	bvAvgRange( 5 ),
	bvSignature( 6 ),
	bvLast( 6 ) ;


{ Initialize - Create Dictionaries, check input parameters and initialize any
  other variables }
method void AnalysisTechnique_Initialized( Object sender,
 InitializedEventArgs args )
	begin
	try
		Patterns = Dictionary.Create() ;
		BarsData = Dictionary.Create() ;
		SortVector = Vector.Create() ;

		if iAvgRngLen < 6 then
			begin
			Alert( "iAvgRngLen less than 6" ) ;
			Abort ;
			end ;

		if iSegmentCount < 3 then
			begin
			Alert( "iSegmentCount less than 3" ) ;
			Abort ;
			end ;

		if iMos2MosCount < 1 or iMos2MosCount > 12 then
			begin
			Alert( "iMos2MosCount is not between 1 and 12, inclusive" ) ;
			Abort ;
			end ;

		SegmentDivisor = 100.0 / iSegmentCount ;

		{ Build form and Grid in form to show results }
		FGrid = form.Create( "Condensed Candlesticks", 800, 800 ) ;

		Grd = DataGridView.Create() ;
		Grd.AllowUserToAddRows = false ;
		Grd.Location( 0, 0 ) ;
		Grd.Dock = DockStyle.Fill ;
		FGrid.AddControl( Grd ) ;

		{ add columns }
		Grd.Columns.Add( "Signature" ) ;
		Grd.columns[0].Width = 75 ;

		Grd.Columns.Add( "Coumt" ) ;
		Grd.columns[1].Width = 45 ;

		for M2MBack = 1 TO iMos2MosCount
			begin
			Col = DataGridViewColumn.Create( "Pct" +
			 NumToStr( M2MBack, 0 ) + "P" ) ;
			Col.Width = 50 ;

			Grd.columns.Add( Col ) ;
			end ;

		for M2MBack = 1 TO iMos2MosCount
			begin
			Col = DataGridViewColumn.Create( "Avg" +
			 NumToStr( M2MBack, 0 ) + "P" ) ;
			Col.Width = 50 ;
			Grd.columns.Add( Col ) ;
			end ;

		{ show form }
		FGrid.Show() ;

	catch ( Exception ex )
		Print( Name, " AnalysisTechnique_Initialized - ErrMsg= ", ex.Message ) ;
	end ;
	end ;

method void SortIntoVector()
variables:
	int VectorIndex,
	int ToAddCount,
	Dictionary VectorPatternData,
	bool Added ;

	begin
	SortVector.clear();
	for PatternIndex = 0 TO Patterns.Count - 1
		begin
		PatternData = Patterns.Values[PatternIndex] astype Dictionary ;
		ToAddCount = PatternData["Count"] astype int ;
		Added = false;

		for VectorIndex = 0 TO SortVector.Count - 1
			begin
			VectorPatternData = SortVector[VectorIndex] astype Dictionary ;

			if VectorPatternData["Count"] astype int < ToAddCount then
				begin
				SortVector.insert( VectorIndex, PatternData ) ;
				Added = true ;
				break ;
				end ;


			end ;
		{ add to end of vector if not added }
		if not Added then
			begin
			SortVector.push_back( PatternData ) ;
			end ;
		end ;

	end ;

{ main Loop through bars }
try
	{ only process after a number of bars to cover M2M size }
	if BarStatus( DataNum + 1 ) = bsClosing then
		begin

		AverageRange = Average(Range, iAvgRngLen);
		BarData = Vector.Create();

		{ We are using the vector like a class, with specific values stored at
		  specific  indices as defined by the bv... constants }
		for Value1 = 0 to bvLast
			begin
			BarData.push_back( 0 ) ;
			end ;

		BarData[bvNumber] = BarNumber ;
		BarData[bvOpen] = Open ;
		BarData[bvHigh] = High ;
		BarData[bvLow] = Low ;
		BarData[bvClose] = Close ;
		Bardata[bvAvgRange] = AverageRange ;

		{ categorize bar pattern }
		CandleRange = Range ;
		{ force to 1 if > 1 }
		RangeMultiplier = MinList( 1, CandleRange / AverageRange ) ;
		CandleRange = CandleRange / 100.0 ;

		HO = Round( ( ( ( High - Open ) / CandleRange ) * RangeMultiplier ) /
		 SegmentDivisor, 0 ) ;
		HC = Round( ( ( ( High - Close ) / CandleRange ) * RangeMultiplier ) /
		 SegmentDivisor, 0 ) ;
		OL = Round( ( ( ( Open - Low ) / CandleRange ) * RangeMultiplier ) /
		 SegmentDivisor, 0 ) ;

		CandleSignature = NumToStr( HO, 0 ) + "-" + NumToStr( HC, 0 ) + "-" +
		 NumToStr( OL, 0 ) ;
		Bardata[bvSignature] = CandleSignature ;
		BarsData.Add( BarNumber.tostring(), BarData ) ;

		{ create patterns dictionary entry }
		if NOT Patterns.Contains( CandleSignature ) then
			begin
			PatternData = Dictionary.Create() ;
			PatternData.Add( "Signature", CandleSignature ) ;
			PatternData.Add( "Count", 0 ) ;

			for M2MBack = 1 TO iMos2MosCount
				begin
				PatternData.Add( "PctCount" + NumToStr( M2MBack, 0 ), 0 ) ;
				PatternData.Add( "PctUpCount" + NumToStr( M2MBack, 0 ), 0 ) ;
				PatternData.Add( "AvgCumm" + NumToStr( M2MBack, 0 ), 0.0 ) ;
				end ;

			Patterns.Add( CandleSignature, PatternData ) ;
			PatternsCount = Patterns.Count ;
			end ;

		{ record that this pattern was found in a bar }
		PatternData = Patterns[CandleSignature] astype Dictionary ;
		PatternData["Count"] = PatternData["Count"] astype int + 1 ;

		{
		As each new bar is encountered, this code accumulates the month-to-month
		data for each of the patterns in the prior bars convered by the
		iMos2MosCount parameter.  We must ensure that we do not step back before
		first bar
		}
		for M2MBack = 1 To iMos2MosCount
			begin
			M2MBackStr = NumToStr(M2MBack,0);

			{ Only process backwards to BarNumber 1 }
			if CurrentBar - M2MBack >= 1 then
				begin

				{ Get BarData for M2MBack from current bar }
				PatternBarNo = CurrentBar - M2MBack ;
				PatternBarNoStr = NumToStr( PatternBarNo, 0 ) ;
				PatternBarData = BarsData[PatternBarNoStr] astype Vector ;

				{ Get Patterns PatternData Dictionary }
				PatternData = Patterns[PatternBarData[bvSignature] astype string]
				 astype Dictionary ;

				{	Update PctCount, PctUpCount, AvgCumm }
				PatternData["PctCount" + M2MBackStr] =
				 PatternData["PctCount" + M2MBackStr] astype Int + 1 ;

				if BarData[bvClose] astype Double > PatternBarData[bvClose]
				 astype Double then
				 	PatternData["PctUpCount" + M2MBackStr] =
				 	 PatternData["PctUpCount" + M2MBackStr] astype Int + 1 ;

				Patterndata["AvgCumm" + M2MBackStr] = Patterndata["AvgCumm" +
				 M2MBackStr] astype Double + ( BarData[bvClose] astype Double -
				 PatternBarData[bvClose] astype Double ) /
				 PatternBarData[bvClose] astype Double ;

				end ;
			end ;

		end ;
catch ( Exception ex )
	print( Name, " MAIN - Error=", ex.Message ) ;
	print( Name, " MAIN - Source=", ex.Source ) ;
	print( Name, " MAIN - Target=", ex.TargetSite ) ;
end;

#region - Display Data in Grid in form -

if LastBarOnChartEx then
	begin
	try
		Grd.Rows.Clear() ;
		SortIntoVector() ;

		for PatternIndex = 0 to SortVector.Count - 1
			begin
			Row = DataGridViewRow.Create("");
			Grd.Rows.Add(Row);

			PatternData = SortVector[PatternIndex] astype Dictionary;
			Row.Cells[0].Text = PatternData["Signature"] astype string;

			Row.Cells[1].Text = (PatternData["Count"] astype Int).ToString();

			for M2MBack = 1 to iMos2MosCount
				begin
				{ Calculate Pct<n>P = WinCount / Count }
				Value1 = PatternData["PctUpCount" + NumToStr( M2MBack, 0 )]
				 astype int ;
				Value2 = PatternData["PctCount" + NumToStr( M2MBack, 0)]
				 astype int ;
				Row.Cells[1 + M2MBack].Text =
				 NumToStr( ( Value1 / Value2 ) * 100, 0 ) + "%" ;
				end ;

			for M2MBack = 1 to iMos2MosCount
				begin
				Value1 = PatternData["AvgCumm" + NumToStr( M2MBack, 0 )]
				 astype Double ;
				Row.Cells[1 + iMos2MosCount + M2MBack].Text =
				 NumToStr( Round( Value1 * 100 / Value2, 2 ), 2 ) ;
				end ;

			end ;

	catch ( Exception ex )
		print( Name, " MAIN - Error=", ex.Message ) ;
		print( Name, " MAIN - Source=", ex.Source ) ;
		print( Name, " MAIN - Target=", ex.TargetSite ) ;
	end ;

	#endregion

	end ;
_CondensedCandlestickLocator (Indicator)

inputs:
	TargetHO( 4 ),
	TargetHC( 1 ),
	TargetOL( 1 ),
	AvgRangeLength( 10 ) ;

variables:
	SegmentDivisor( 0 ),
	AverageRange( 0 ),
	CandleRange( 0 ),
	RangeMultiplier( 0 ),
	CandleRangeSegmented( 0 ),
	HO( 0 ),
	HC( 0 ),
	OL( 0 ),
	Segments( 100 ),
	SegmentCount( 5 ) ;

{ signal calculation }
CandleRange = High - Low ;
SegmentDivisor = Segments/SegmentCount ;
AverageRange = Average( CandleRange, AvgRangeLength ) ;

if AverageRange[1] > 0 then
	begin
	RangeMultiplier = CandleRange/AverageRange[1] ;
	CandleRangeSegmented = CandleRange/Segments ;
	RangeMultiplier =  IFF( RangeMultiplier > 1, 1, RangeMultiplier ) ;

	HO = Round( ( ( ( High - Open ) / CandleRangeSegmented ) * RangeMultiplier ) /
	 SegmentDivisor, 0 ) ;
	HC = Round( ( ( ( High - Close ) / CandleRangeSegmented ) * RangeMultiplier ) /
	 SegmentDivisor, 0 ) ;
	OL = Round( ( ( ( Open - Low ) / CandleRangeSegmented ) * RangeMultiplier ) /
	 SegmentDivisor, 0 ) ;

	if HO = TargetHO and HC = TargetHC and OL = TargetOL then
		Plot1( Close ) ;
	end ;
— Christopher Davy and Mark Mills
TradeStation Securities, Inc.
www.TradeStation.com
BACK TO LIST

eSIGNAL: FEBRUARY 2015
For this month’s Traders’ Tip, we’ve provided a CondensedCandles.efs study based on the formula described in Dave Cline’s article in this issue, “Candlesticks, Condensed.”
The data generated by the formula will be found in the Candle.csv file located in the My Documents/Interactive Data/FormulaOutput folder. This data can then be used to do the probability analysis based on candle patterns described in the article.
The study contains formula parameters that may be configured through the edit chart window (right-click on the chart and select “edit chart”). A sample chart is shown in Figure 2.
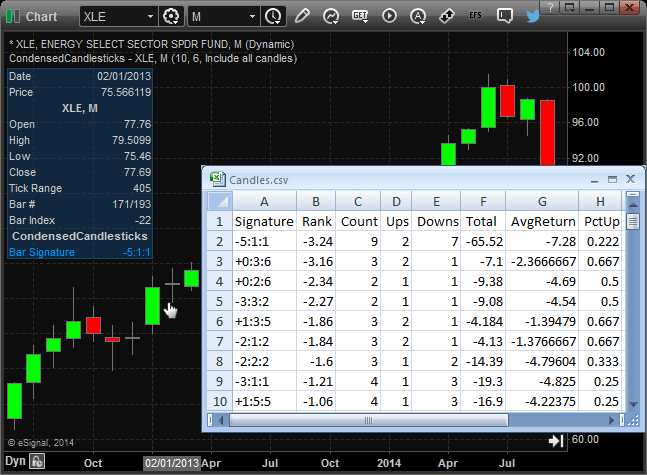
FIGURE 2: eSIGNAL. Here is an example of the study implemented on a chart of XLE (Energy Select Sector SPDR).
To discuss this study or download a complete copy of the formula code, please visit the EFS Library Discussion Board forum under the forums link from the support menu at www.esignal.com or visit our EFS KnowledgeBase at https://www.esignal.com/support/kb/efs/. The eSignal formula script (EFS) is also available for downloading here and copying & pasting from below.
/*********************************
Provided By:
    Interactive Data Corporation (Copyright © 2014)
    All rights reserved. This sample eSignal Formula Script (EFS)
    is for educational purposes only. Interactive Data Corporation
    reserves the right to modify and overwrite this EFS file with
    each new release.

Description:
    Candlesticks, Condensed by David Cline

Formula Parameters:                     Default:
Weight Periods                          50
Segment Count                           20
Report Mode                             Include all candles

Version:            1.00  12/08/2014

Notes:
    The related article is copyrighted material. If you are not a subscriber
    of Stocks & Commodities, please visit www.traders.com.

**********************************/

var fpArray = new Array();

function preMain(){

    setStudyTitle("CondensedCandlesticks");
    setPriceStudy(true);

    setCursorLabelName("Bar Signature", 0);
    setComputeOnClose(true);

    var x = 0;

    fpArray[x] = new FunctionParameter("fpPeriods", FunctionParameter.NUMBER);
    with(fpArray[x++]){
        setName("Weight Periods");
        setLowerLimit(1);
        setDefault(10);
    }

    fpArray[x] = new FunctionParameter("fpSegCount", FunctionParameter.NUMBER);
    with(fpArray[x++]){
        setName("Segment Count");
        setLowerLimit(1);
        setDefault(6);
    }

    fpArray[x] = new FunctionParameter("fpRepMode", FunctionParameter.STRING);
    with(fpArray[x++]){
        setName("Report Mode");
        addOption("Include all candles");
        addOption("Include the top and bottom 10 candles");
        setDefault("Include all candles");
    }
}

var bInit = false;
var bVersion = null;

var xOpen = null;
var xHigh = null;
var xLow = null;
var xClose  = null;

var candlePatterns = {};
var nSegmentDivisor = null;

var fCandles = new File("Candles.csv");

//The Script outputs the results of the analysis of Candles signatures
//to the file "C:\Users\User_name\Documents\Interactive Data\FormulaOutput\Candles.csv"

function main(fpPeriods, fpSegCount, fpRepMode){

    if (bVersion == null) bVersion = verify();
    if (bVersion == false) return;

    nSegmentDivisor = 100.0 / fpSegCount;

    if (!bInit){

        xOpen = open();
        xHigh = high();
        xLow = low();
        xClose = close();

        xRange = efsInternal('calc_Range', xHigh, xLow);
        xAverageRange = sma(fpPeriods, xRange);

        bInit = true;
    }

    if (getBarState() == BARSTATE_ALLBARS){

        candlePatterns = {};

        fCandles.open("wt");
        fCandles.writeln("Signature, Rank, Count, Ups, Downs, Total, AvgReturn, PctUp");
        fCandles.close();
    }

    var nCandleRange = xRange.getValue(-1);
    var nAverageRange = xAverageRange.getValue(0);

    if (nAverageRange == null || nCandleRange == null)
        return;

    var nRangeMultiplier = nCandleRange / nAverageRange;
    if (nRangeMultiplier > 1) nRangeMultiplier = 1;
    var nCandleRange = nCandleRange / 100;

    var nPrOpen = xOpen.getValue(-1);
    var nPrHigh = xHigh.getValue(-1);
    var nPrLow = xLow.getValue(-1);
    var nPrClose = xClose.getValue(-1);

    var nClose = xClose.getValue(0);
    var nStartClose = xClose.getValue(-fpPeriods + 1);

    if (nPrOpen == null || nPrHigh == null ||
        nPrLow == null || nPrClose == null ||
        nStartClose == null)
        return;

    var nHO = Math.round((((nPrHigh - nPrOpen) / nCandleRange) * nRangeMultiplier ) / nSegmentDivisor);
    var nHC = Math.round((((nPrHigh - nPrClose) / nCandleRange) * nRangeMultiplier ) / nSegmentDivisor);
    var nOL = Math.round((((nPrOpen - nPrLow) / nCandleRange) * nRangeMultiplier ) / nSegmentDivisor);

    var stSign = null;

    if (nPrOpen > nClose) stSign = '+'
    else stSign = '-';

    var stCandleSignature = stSign + nHO + ':' + nHC + ':' + nOL;

    var nCandleReturn = nStartClose - nClose;

    if  (candlePatterns.hasOwnProperty(stCandleSignature)){

        if (nCandleReturn > 0) candlePatterns[stCandleSignature]['Ups'] += 1
        else candlePatterns[stCandleSignature]['Ups'] += 0;

        if (nCandleReturn <= 0) candlePatterns[stCandleSignature]['Downs'] += 1
        else candlePatterns[stCandleSignature]['Downs'] += 0;

        candlePatterns[stCandleSignature]['Total'] += nCandleReturn;
        candlePatterns[stCandleSignature]['Count'] += 1;
    }
    else{

        candlePatterns[stCandleSignature] = {};

        if (nCandleReturn > 0) candlePatterns[stCandleSignature]['Ups'] = 1
        else candlePatterns[stCandleSignature]['Ups'] = 0;

        if (nCandleReturn <= 0) candlePatterns[stCandleSignature]['Downs'] = 1
        else candlePatterns[stCandleSignature]['Downs'] = 0;

        candlePatterns[stCandleSignature]['Total'] = nCandleReturn;
        candlePatterns[stCandleSignature]['Count'] = 1;
    }

    if (getCurrentBarIndex() == -1)
        processCandleReturns(fpRepMode);

    return stCandleSignature;
}

function calc_Range(xHigh, xLow){

    return xHigh.getValue(0) - xLow.getValue(0);
}

function processCandleReturns(stRepMode){

    var arrCandlePatterns = [];

    for (candle in candlePatterns){
        candleMetric = candlePatterns[candle];
        candleMetric['PctUp'] = candleMetric['Ups'] / candleMetric['Count'];
        candleMetric['AvgReturn'] = candleMetric['Total'] / candleMetric['Count'];
        candleMetric['Rank'] = candleMetric['PctUp'] * candleMetric['Ups'] * candleMetric['AvgReturn'];

        arrCandlePatterns.push([candle, candlePatterns[candle]]);
    }

    arrCandlePatterns.sort(function(a, b){
        return a[1]['Rank'] - b[1]['Rank'];
    });

    fCandles.open("at");
    if (stRepMode == "Include the top and bottom 10 candles" && arrCandlePatterns.length > 20){
        for (i = 0; i < 10; i++){
            fCandles.writeln(arrCandlePatterns[i][0] + ", " +
                             arrCandlePatterns[i][1]['Rank'] + ", " +
                             arrCandlePatterns[i][1]['Count'] + ", " +
                             arrCandlePatterns[i][1]['Ups'] + ", " +
                             arrCandlePatterns[i][1]['Downs'] + ", " +
                             arrCandlePatterns[i][1]['Total'] + ", " +
                             arrCandlePatterns[i][1]['AvgReturn'] + ", " +
                             arrCandlePatterns[i][1]['PctUp']);
        }
        for (i = arrCandlePatterns.length - 10; i < arrCandlePatterns.length; i++){
            fCandles.writeln(arrCandlePatterns[i][0] + ", " +
                             arrCandlePatterns[i][1]['Rank'] + ", " +
                             arrCandlePatterns[i][1]['Count'] + ", " +
                             arrCandlePatterns[i][1]['Ups'] + ", " +
                             arrCandlePatterns[i][1]['Downs'] + ", " +
                             arrCandlePatterns[i][1]['Total'] + ", " +
                             arrCandlePatterns[i][1]['AvgReturn'] + ", " +
                             arrCandlePatterns[i][1]['PctUp']);
        }
    }
    else
        for (i = 0; i < arrCandlePatterns.length; i++)
            fCandles.writeln(arrCandlePatterns[i][0] + ", " +
                             arrCandlePatterns[i][1]['Rank'] + ", " +
                             arrCandlePatterns[i][1]['Count'] + ", " +
                             arrCandlePatterns[i][1]['Ups'] + ", " +
                             arrCandlePatterns[i][1]['Downs'] + ", " +
                             arrCandlePatterns[i][1]['Total'] + ", " +
                             arrCandlePatterns[i][1]['AvgReturn'] + ", " +
                             arrCandlePatterns[i][1]['PctUp']);
    fCandles.close();
}

function verify(){

    var b = false;
    if (getBuildNumber() < 779){

        drawTextAbsolute(5, 35, "This study requires version 8.0 or later.",
            Color.white, Color.blue, Text.RELATIVETOBOTTOM|Text.RELATIVETOLEFT|Text.BOLD|Text.LEFT,
            null, 13, "error");
        drawTextAbsolute(5, 20, "Click HERE to upgrade.@URL=https://www.esignal.com/download/default.asp",
            Color.white, Color.blue, Text.RELATIVETOBOTTOM|Text.RELATIVETOLEFT|Text.BOLD|Text.LEFT,
            null, 13, "upgrade");
        return b;
    }
    else
        b = true;

    return b;
}
—Eric Lippert
eSignal, an Interactive Data company
800 779-6555, www.eSignal.com
BACK TO LIST

WEALTH-LAB: FEBRUARY 2015
To seasoned readers, the article in this issue by Dave Cline, “Candlesticks, Condensed,” may remind them of a loosely related idea featured in the March 2001 and September 2001 issues of STOCKS & COMMODITIES by Viktor Likhovidov, who also offered a candlestick coding technique. His quantitative approach, which he called CandleCode, expresses a candlestick value as a binary number, coding the body and shadows in different “bits” of the number.
The idea behind the “candlesticktistics” introduced in Cline’s article in this issue is to make candlesticks a sort of binary, simplified, consistent instrument with which to identify patterns. By turning them into a fixed number of patterns, the author’s automatic pattern-search method performs statistical analysis in order to gauge their predictive capability. Our preliminary testing suggests that it delivers quite interesting results.
The C# code we’re presenting this month based on Cline’s article splits the backtest range into two equal parts: in-sample and out-of-sample periods. At first, it discovers the most popular HO:HC:OL signatures across the in-sample range. Leaving the actual candlestick probability programming to motivated users, we enter quick trades using the knowledge gained on in-sample data. The number of signatures is configurable; the more the Top-N consists of, the more trades will there be and vice versa. For example, if you choose to trade only the Top-1 pattern, the resulting system will be very selective. The percentage of price change following a pattern is also interactively configurable through a parameter slider at the bottom of the screen. By default, each trade lasts for a single bar only and is exited at the close of the entry bar.
On a closing note, our code is powered by LINQ, which is a C# / .NET way of producing flexible SQL-like statements on any data contained in arrays, lists, databases and so on. Advanced users can leverage the benefits of LINQ to perform statistical analysis on candlestick patterns in terse, compact, and almost natural language form.
using System;
using System.Collections.Generic;
using System.Text;
using System.Drawing;
using WealthLab;
using WealthLab.Indicators;
using System.Linq;

namespace WealthLab.Strategies
{
	public class Signature
	{
		public int Bar;
		public string Sig;
		public double ROC;

		public Signature( int Bar, string Sig, double ROC ){ this.Bar = Bar; this.Sig = Sig; this.ROC = ROC;}
	}

	public class TASC201502 : WealthScript
	{
		private StrategyParameter paramTop;
		private StrategyParameter paramRoc;

		public TASC201502()
		{
			paramTop = CreateParameter("Top N",10,1,10,1);
			paramRoc = CreateParameter("ROC period",1,1,10,1);
		}

		protected override void Execute()
		{
			int roc = paramRoc.ValueInt;
			const char tab = '\u0009';
			int halfData = Bars.Count / 2; // For in-sample and out-of-sample
			int oosBar = Bars.Count - halfData;
			int segmentCount = 5;
			double segmentDivisor = 100d / (double)segmentCount;
			List<Signature> lstSig1 = new List<Signature>();

			if (Bars.Count < roc )
			{
				DrawLabel(PricePane, "Insufficient data");
				Abort();
			}

			for(int bar = GetTradingLoopStartBar(10); bar < Bars.Count; bar++)
			{
				List<string> lstSig = new List<string>();
				double open = Open[bar], high = High[bar], low = Low[bar], close = Close[bar];

				double averageRange = ATR.Series(Bars,10)[bar];
				double candleRange = high - low;
				double rangeMultiplier = candleRange / averageRange;
				candleRange = candleRange /= 100d;
				rangeMultiplier = rangeMultiplier > 1 ? 1.0 : rangeMultiplier;

				double HO = Math.Round((((high - open) / candleRange) * rangeMultiplier) / segmentDivisor);
				double HC = Math.Round((((high - close) / candleRange) * rangeMultiplier) / segmentDivisor);
				double OL = Math.Round((((open - low) / candleRange) * rangeMultiplier) / segmentDivisor);

				//Candle signature = HO-HC-OL
				var sig = HO+":"+HC+":"+OL;
				if( bar < oosBar )
					lstSig1.Add(new Signature(bar,sig,ROC.Series(Close,roc)[bar+1]));
				else
				{
					if (IsLastPositionActive)
					{
						SellAtClose(bar,LastPosition);
					}
					else
					{
						var listSignaturesOOS = lstSig1.OrderBy(p => p.ROC).Reverse().Take(paramTop.ValueInt).ToList();
						foreach(var s in listSignaturesOOS )
						{
							if( sig == s.Sig )
							{
								int count = lstSig1.Count( t => t.Sig == sig );
								AnnotateBar(s.Sig,bar,true,Color.Blue);
								BuyAtClose(bar);
								break;
							}
						}
					}
				}
			}

			var listSignaturesIS = lstSig1.OrderBy(p => p.ROC).Reverse().Take(paramTop.ValueInt).ToList();

			DrawLabel(PricePane, "Most frequent signatures from in-sample period containing 50% data: " + "\n\r");
			DrawLabel(PricePane, "Signature:" + tab + "Count:" + tab + "% Change next bar:");
			foreach(var s in listSignaturesIS )
			{
				int count = lstSig1.Count( t => t.Sig == s.Sig );
				DrawLabel(PricePane, s.Sig + tab + tab + count + tab + Bars.FormatValue(s.ROC));
				AnnotateBar(s.Sig,s.Bar,true,Color.Black);
			}

			AnnotateBar("Out of sample starts",oosBar,true,Color.Red);
			for( int bar = 0; bar < oosBar; bar++ )
				SetBackgroundColor(bar,Color.FromArgb(30,Color.Blue));
		}
	}
}
A sample chart is shown in Figure 3.

FIGURE 3: WEALTH-LAB. Here is a sample Wealth-Lab 6 chart illustrating the application of top-3 candlestick patterns on out-of-sample data using a daily chart of a continuous contract of crude oil futures (brent).
—Eugene, Wealth-Lab team
MS123, LLC
www.wealth-lab.com
BACK TO LIST

AMIBROKER: FEBRUARY 2015
In “Candlesticks, Condensed” in this issue, author Dave Cline presents a way to condense candlestick chart information so that statistics about candlestick patterns can be derived. The AmiBroker code provided here presents an AmiBroker Formula Language (AFL) formula that produces condensed candlestick pattern statistics similar to those presented in Cline’s article.
LISTING 1.

SegmentCount = 5;
SegmentDivisor = 100 / SegmentCount;
CandleRange = High - Low;
AvgRange = MA( CandleRange, 6 );
RangeMultiplier = CandleRange / AvgRange;
CandleRange /= 100;

RangeMultiplier = Min( RangeMultiplier, 1 );

HO = round( ( RangeMultiplier * ( High - Open ) / CandleRange ) / SegmentDivisor );
HC = round( ( RangeMultiplier * ( High - Close ) / CandleRange ) / SegmentDivisor );
OL = round( ( RangeMultiplier * ( Open - Low ) / CandleRange ) / SegmentDivisor );

DigitMult = SegmentCount + 1;

// signature is encoded to fit into integer
CandleSignature = DigitMult * DigitMult * HO + DigitMult * HC + OL;

Title = Name() + " " + Date() + " " + StrFormat( "Signature %.0f:%.0f:%.0f", HO, HC, OL );
Plot( C, "Close", colorDefault, styleCandle );

Filter = False;

// statistics
Pct1P = Pct2P = Pct3P = Pct4P = 0;
Avg1P = Avg2P = Avg3P = Avg4P = 0;

// count of occurrence of patterns
Cnt = 0;

MaxSegment = SegmentCount * DigitMult * DigitMult + SegmentCount * DigitMult + SegmentCount;

if( BarCount > MaxSegment )
{
   // changes over 1..4 periods
   // you can change it to Close - Ref( Close, -1 )
   // to get dollar gains instead of percent changes

   Chg1P = ROC( Close, 1 );
   Chg2P = ROC( Close, 2 );
   Chg3P = ROC( Close, 3 );
   Chg4P = ROC( Close, 4 );

   // number of times given pattern is followed by UP movement
   Up1P = Up2P = Up3P = Up4P = 0;
   // gain
   Gain1P = Gain2P = Gain3P = Gain4P = 0;

   for( i = 0; i < BarCount - 4; i++ )
   {
       sig = CandleSignature[ i ];

       if( sig >= 0 && sig <= MaxSegment )
       {
         Cnt[ sig ]++; // increase occurrence counter for given sig

         // if change > 0 increase UP counter
	   Up1P[ sig ] += Chg1P[ i + 1 ] > 0;
	   // add change to total gain
         Gain1P[ sig ] += Chg1P[ i + 1 ];

         Up2P[ sig ] += Chg1P[ i + 2 ] > 0;
         Gain2P[ sig ] += Chg1P[ i + 2 ];

         Up3P[ sig ] += Chg1P[ i + 3 ] > 0;
         Gain3P[ sig ] += Chg1P[ i + 3 ];
         Up4P[ sig ] += Chg4P[ i + 1 ] > 0;
         Gain4P[ sig ] += Chg4P[ i + 1 ];
      }
    }


    for( sig = 0; sig <= MaxSegment; sig++ )
    {
       // if any patterns of given signature were found
      if( Cnt[ sig ] )
      {
          qty = Cnt[ sig ];
          Pct1P[ sig ] = Up1P[ sig ] / qty;
          Pct2P[ sig ] = Up2P[ sig ] / qty;
          Pct3P[ sig ] = Up3P[ sig ] / qty;
          Pct4P[ sig ] = Up4P[ sig ] / qty;

          Avg1P[ sig ] = Gain1P[ sig ] / qty;
          Avg2P[ sig ] = Gain2P[ sig ] / qty;
          Avg3P[ sig ] = Gain3P[ sig ] / qty;
          Avg4P[ sig ] = Gain4P[ sig ] / qty;
       }
    }

    Filter = Cnt;
}
else
{
    PopupWindow("Not enough bars in " + Name() + " Please select symbols that have more than " +
                MaxSegment + " bars", "Problem" );
}

// multiply factors by 100 to get percents
Pct1P *= 100;
Pct2P *= 100;
Pct3P *= 100;
Pct4P *= 100;

bi = BarIndex();
Sig1 = bi % DigitMult;
Sig2 = floor( bi / DigitMult ) % DigitMult;
Sig3 = floor( bi / ( DigitMult * DigitMult ) );

Signature = 100 * Sig3 + 10 * Sig2 + Sig1;

SetOption("NoDefaultColumns", True );
AddTextColumn( Name(), "Symbol" );
AddColumn( Signature, "Signature", 3.0 );
AddColumn( Cnt, "Count", 1.0 );
AddColumn( Pct1P, "Pct1P%", 1.1 );
AddColumn( Pct2P, "Pct2P%", 1.1 );
AddColumn( Pct3P, "Pct3P%", 1.1 );
AddColumn( Pct4P, "Pct4P%", 1.1 );
AddColumn( Avg1P, "Avg1P%", 1.1 );
AddColumn( Avg2P, "Avg2P%", 1.1 );
AddColumn( Avg3P, "Avg3P%", 1.1 );
AddColumn( Avg4P, "Avg4P%", 1.1 );
When used in AmiBroker’s Exploration mode, it produces a table showing the number of occurrences of a given pattern along with its profitability within the subsequent one to four periods. When used in indicator mode, it shows the current pattern code in the title string of the chart.
To use the formula, enter the code into the formula editor and press the apply indicator button to use it as a chart or the send to analysis button to perform an exploration.
A sample chart is shown in Figure 4.
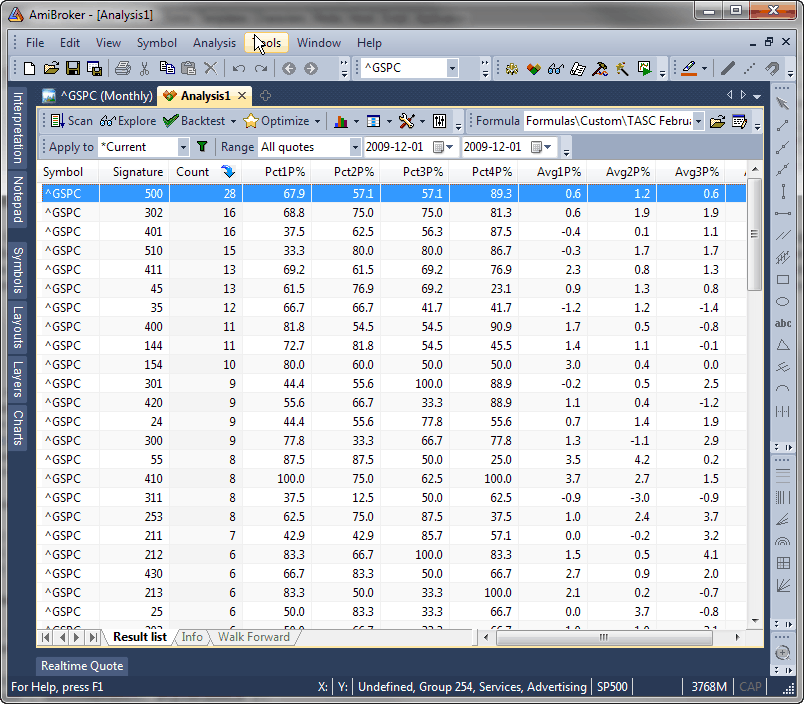
FIGURE 4: AMIBROKER. Here are sample exploration results showing the monthly pattern statistics for the S&P 500 index for the years 1990–2014.
—Tomasz Janeczko, AmiBroker.com
www.amibroker.com
BACK TO LIST

NEUROSHELL TRADER: FEBRUARY 2015
The technique described by Dave Cline in his article in this issue, “Candlesticks, Condensed” can be easily implemented with a few of NeuroShell Trader’s 800+ indicators plus the Advanced Indicator Set #2. Simply select new indicator from the insert menu and use the indicator wizard to recreate the following indicators:
RangeMultiplier: Min2(1,Avg Ratio (Sub(High,Low), 10))
HO: Round(Multiply3(Divide(Sub(High,Open),Sub(High,Low)), RangeMultiplier, SegmentCount))
HC: Round(Multiply3(Divide(Sub(High,Close),Sub(High,Low)), RangeMultiplier, SegmentCount))
HL: Round(Multiply3(Divide(Sub(Open,Low),Sub(High,Low)), RangeMultiplier, SegmentCount))
Candle Signature: Add3( HO, HC, HL)
Neural networks can provide a more robust analysis of historical patterns than the segmented statistical analysis described in Cline’s article, so we chose to use the condensed candlesticks as inputs to a neural network. To create a neural network that analyzes and trades based on the past three condensed candlestick HO, HC and HL values, simply select new prediction from the insert menu and use the prediction wizard to create the following prediction inputs:
Non-rounded HO
Non-rounded HC
Non-rounded HL
Lag(Non-rounded HO,1)
Lag(Non-rounded HC,1)
Lag(Non-rounded HL,1)
Lag(Non-rounded HO,2)
Lag(Non-rounded HC,2)
Lag(Non-rounded HL,2)
Since neural network analysis also does not require grouping into integers as does the segmented statistical analysis, nonrounded versions of the indicators were used as inputs. Using six years of monthly bars for training and holding out an additional six years for out-of-sample evaluation, a quickly constructed nonoptimized prediction gave an average yearly return of 13.5% over the out-of-sample period for AAPL, ADBE, and ADP.
NeuroShell Trader also allows you to choose whether the parameters should be optimized. After backtesting the prediction, use the prediction analysis button to view the backtest and trade-by-trade statistics for the strategy.
Users of NeuroShell Trader can go to the STOCKS & COMMODITIES section of the NeuroShell Trader free technical support website to download a copy of this or any previous Traders’ Tips.
A sample chart is shown in Figure 5.

FIGURE 5: NEUROSHELL TRADER. Here is a NeuroShell Trader chart showing sample condensed candlestick neural network trading results.
—Marge Sherald, Ward Systems Group, Inc.
301 662-7950, sales@wardsystems.com
www.neuroshell.com
BACK TO LIST

NINJATRADER: FEBRUARY 2015
The CondensedCandles indicator introduced in “Candlesticks, Condensed” by Dave Cline in this issue has been made available for download at www.ninjatrader.com/SC/February2015SC.zip.
Once it has been downloaded, from within the NinjaTrader Control Center window, select the menu File → Utilities → Import NinjaScript and select the downloaded file. This file is for NinjaTrader version 7 or greater.
You can review the indicator source code by selecting the menu Tools → Edit NinjaScript → Indicator from within the NinjaTrader Control Center window and selecting the CondensedCandles file.
A sample chart implementation is shown in Figure 6.
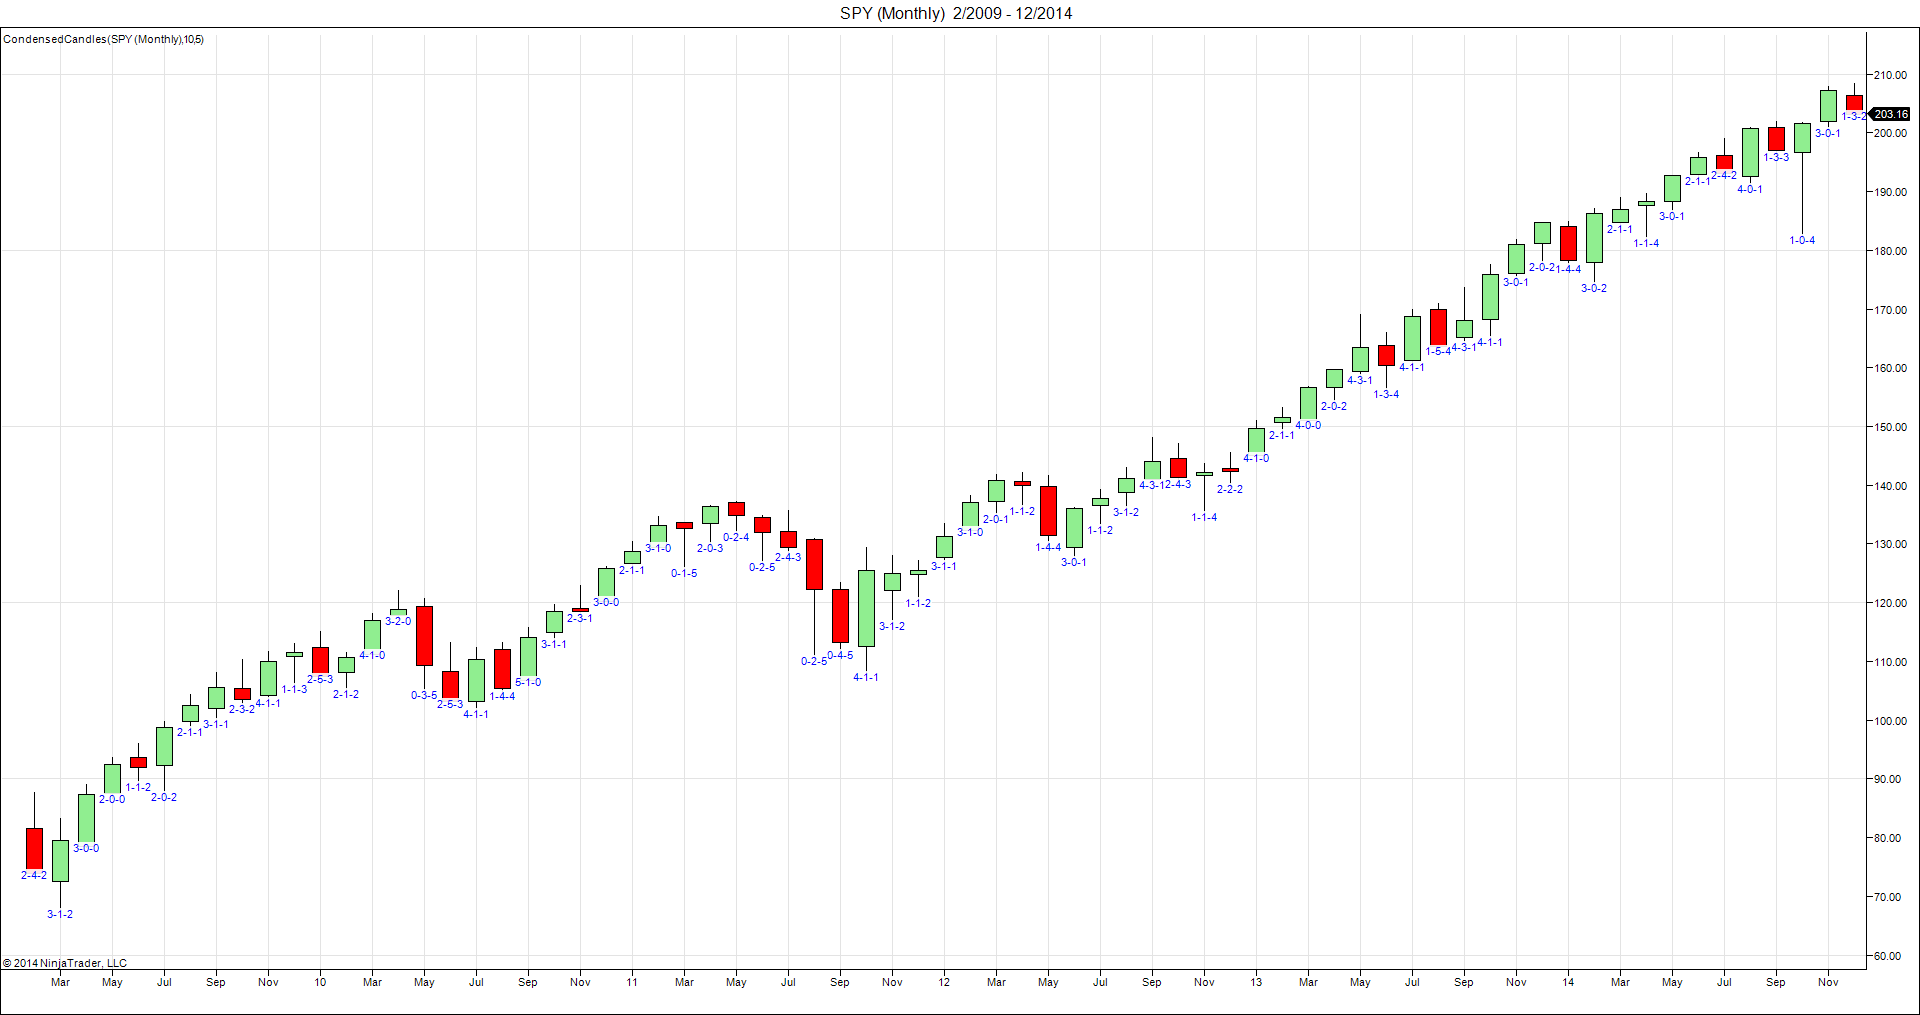
FIGURE 6: NINJATRADER. This screenshot shows the indicator applied to a monthly SPY ETF chart in NinjaTrader.
—Raymond Deux and Chelsea Bell
NinjaTrader, LLC, www.ninjatrader.com
BACK TO LIST

AIQ: FEBRUARY 2015
The AIQ code based on Dave Cline’s article in this issue, “Candlesticks, Condensed,” is provided at www.TradersEdgeSystems.com/traderstips.htm, and shown below.
In preparing the coding in AIQ for the candle signatures, I used the weekly mode, since AIQ has a daily mode and a weekly mode but no monthly mode in the EDS module. I created a series of reports that show the candle signatures for the date entered into the report date box. The first report, named “ListAll,” lists all stocks with closes greater than $5.00 in the database and the report shows the signature for the current week and also for the prior weekly bar. I also created reports for all of the signatures that are listed in the author’s Figure 6. These additional reports all have the same format as the “ListAll” report. The “S411” report shows all stocks with prices greater than $5.00 that also have a current weekly signature of 4:1:1. These reports also list whatever the signature was for the prior week. Candle patterns can be constructed using multiple bars of signatures. For illustrative purposes only, I am providing the following format for a three-bar pattern:
S3_411 if S411 and valrule(S411,1) and valrule(S411,2)
This report lists only those stocks that had a 4:1:1 signature for the current bar and the prior two bars.
In Figure 7, I show a chart of eHealth (EHTH) as of January 10, 2014. On this date, it appeared on the S3_411 report. Buying on the next weekly open and selling at the following weekly open resulted in a 9.35% return.

FIGURE 7: AIQ. Here is a weekly chart of eHealth (EHTH) as of 1/10/2014 showing white up arrows on the signal date for the S3_411 three-bar report pattern.
Note that I did not code exits for the patterns, as the built-in exits can be used to experiment with the candle signatures.
!CANDLESTICKS, CONDENSED
!Author: David Cline, TASC February 2015
!Coded by: Richard Denning, 12/10/2014
!www.TradersEdgeSystems.com

! NOTE: DESIGNED TO RUN IN WEEKLY MODE ONLY
!	SET PROPERTIES TO WEEKLY
!	RUN ON LAST DAY OF WEEK

! PARAMETERS:
AvgRngLen is 10.     !Length for range average
SegCt     is 5.      !Range = 3 to 6

! ABBREVIATIONS:
C is [close].
H is [high].
L is [low].
O is [open].
PD is {position days}.
PEP is {position entry price}.

! CONDENSED CANDLE CODE:
Range	is H - L.
AvgRng	is simpleavg(Range,AvgRngLen).
RngMult is Range / AvgRng.
SegDiv is 100 / SegCt.
CndlRng is Range / 100.
RngMult2 is iff(RngMult > 1,1,RngMult).
HO1 is H - O.
HC1 is H - C.
OL1 is O - L.
HO is round(((HO1/CndlRng)*RngMult2)/SegDiv).
HC is round(((HC1/CndlRng)*RngMult2)/SegDiv).
OL is round(((OL1/CndlRng)*RngMult2)/SegDiv).
HO_1 is valresult(HO,1).
HC_1 is valresult(HC,1).
OL_1 is valresult(OL,1).
HO_2 is valresult(HO,2).
HC_2 is valresult(HC,2).
OL_2 is valresult(OL,2).

!REPORTS:
ListAll if C>5.
S411 if HO = 4 and HC = 1 and OL = 1 and C>5.
S144 if HO = 1 and HC = 4 and OL = 4 and C>5.
S124 if HO = 1 and HC = 2 and OL = 4 and C>5.
S510 if HO = 5 and HC = 1 and OL = 0 and C>5.
S302 if HO = 3 and HC = 0 and OL = 2 and C>5.
S025 if HO = 0 and HC = 2 and OL = 5 and C>5.
S035 if HO = 0 and HC = 3 and OL = 5 and C>5.
S421 if HO = 4 and HC = 2 and OL = 1 and C>5.
S410 if HO = 4 and HC = 1 and OL = 0 and C>5.
S312 if HO = 3 and HC = 1 and OL = 2 and C>5.
!Example of how to construct a three bar pattern:
S3_411 if S411 and valrule(S411,1) and valrule(S411,2).
—Richard Denning
info@TradersEdgeSystems.com
for AIQ Systems
BACK TO LIST

TRADERSSTUDIO: FEBRUARY 2015
The TradersStudio code based on Dave Cline’s article in this issue, “Candlesticks, Condensed,” is provided at the following websites (and is shown below):
The following code files are provided in the download:
- Function: CANDLE_SIG. Returns 1 if the candle signature could be computed and also by reference it sets the values for HO, HC & OL (the candle signature); returns zero if the signature could not be computed and sets each of HO, HC, & OL to -1.
- System: CANDLE_COND. A long-only system that uses weekly data and a single bar candle signature to enter at the next weekly open and exits as soon as the entered candle signature is other than the one input.
The system provided allows the user to explore the candle signatures using daily, weekly, or monthly data. I used weekly data on the full-sized S&P 500 futures contract (using data from Pinnacle Data Corp.) and optimized for the various signatures. One of the better ones was the 3:4:2 weekly candle signature (see Figure 8). I then added other index futures (DJ, DX, MD, ND, and RL) and ran the backtest with the 3:4:2 parameters, which resulted in the curves shown in Figure 9. The results shown in Figures 8 & 9 do not include slippage & commissions. Over the 15-year test period, there were only 50 trades for this index portfolio. Much more work is needed, but the candle signature provides a useful tool for researching candle patterns.
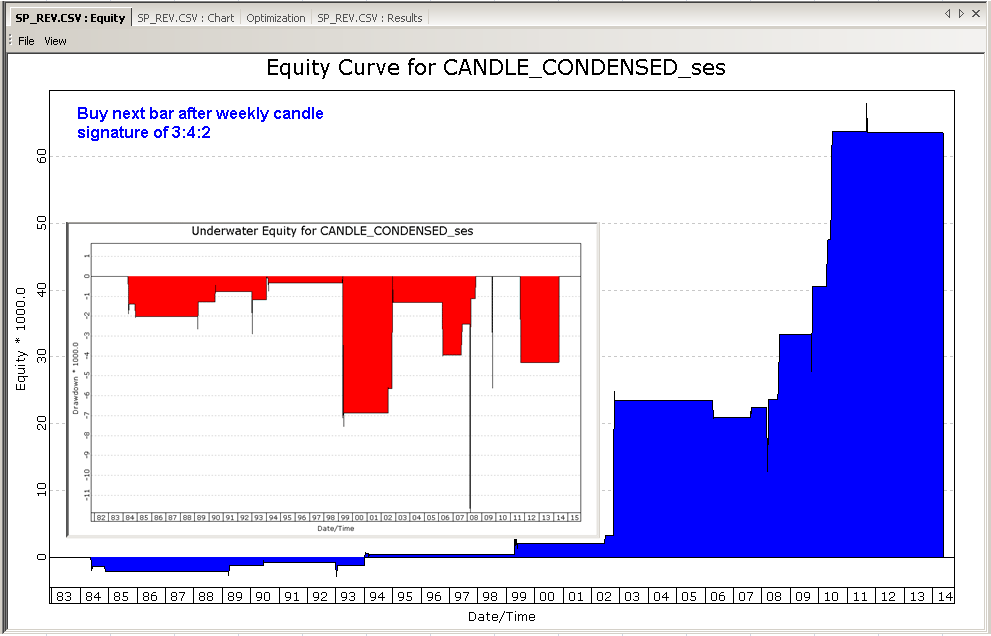
FIGURE 8: TRADERSSTUDIO, SAMPLE EQUITY CURVES FOR SYSTEM ON S&P CONTRACT. Here are sample equity and underwater equity curves for the CANDLE_CONDENSED system trading one contract per signal on the S&P 500 (SP) futures contract with parameters 3:4:2 from 1999 to 2014.
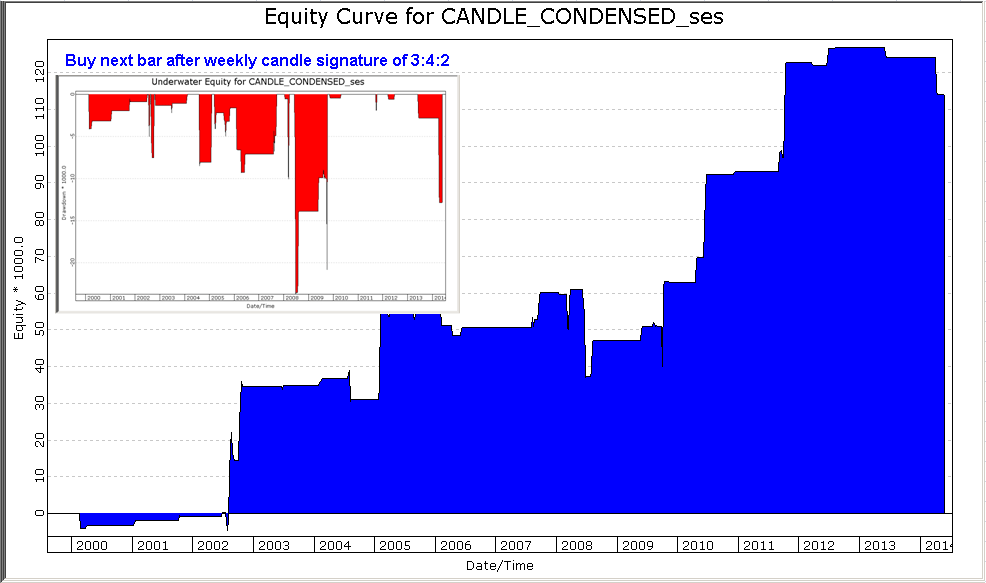
FIGURE 9: TRADERSSTUDIO, SAMPLE EQUITY CURVES FOR SYSTEM ON INDEX FUTURES PORTFOLIO OF SIX CONTRACTS. Here are sample equity and underwater equity curves for the CANDLE_CONDENSED system trading one contract per signal on the index futures portfolio of six contracts with parameters 3:4:2 from 1999 to 2014.
'CANDLESTICKS, CONDENSED
'Author: David Cline, TASC February 2015
'Coded by: Richard Denning, 12/10/2014
'www.TradersEdgeSystems.com

Function CANDLE_SIG(avgRngLen,SegCt,ByRef HO,ByRef HC,ByRef OL)
Dim avgRng As BarArray
avgRng = Average(H-L,avgRngLen)
Dim rngMult As BarArray
If avgRng <> 0 Then rngMult = (H-L)/avgRng
Dim segDiv
If SegCt <> 0 Then segDiv = 100/SegCt
Dim cndlRng
cndlRng = (H-L)/100
Dim rngMult2
rngMult2 = IIF(rngMult>1,1,rngMult)
If SegCt <> 0 And cndlRng <> 0 And segDiv <> 0 Then
    HO = Round((((H-O)/cndlRng)*rngMult2)/segDiv,0)
    HC = Round((((H-C)/cndlRng)*rngMult2)/segDiv,0)
    OL = Round((((O-L)/cndlRng)*rngMult2)/segDiv,0)
    CANDLE_SIG = 1
    Else
       HO=-1
       HC=-1
       OL=-1
       CANDLE_SIG = 0
End If
End Function
'------------------------------------------------------------------
'SYSTEM TO TEST CANDLE SIGNATURE PATTERS:
Sub CANDLE_COND(hoS,hcS,olS,avgRngLen,SegCt)
Dim HO As BarArray
Dim HC As BarArray
Dim OL As BarArray
Dim CandleSigOK As BarArray
If BarNumber = FirstBar Then
    HO = -1
    HC = -1
    OL = -1
    CandleSigOK = 0
End If
CandleSigOK = CANDLE_SIG(avgRngLen,SegCt,HO,HC,OL)
If CandleSigOK=1 And HO=hoS And HC=hcS And OL=olS Then
    'Print FormatDateTime(Date)," ",GETACTIVESYMBOL(0)," ",HO,":",HC,":",OL
    Buy("LE",1,0,market,day)
End If
If CandleSigOK=1 And HO<>hoS And HC<>hcS And OL<>olS Then
    ExitLong("LX","",1,0,Market,Day)
End If
End Sub
'----------------------------------------------------------------------------
—Richard Denning
info@TradersEdgeSystems.com
for TradersStudio
BACK TO LIST

UPDATA: FEBRUARY 2015
Our Traders’ Tip for this month is based on “Candlesticks, Condensed” by Dave Cline in this issue.
In the article, Cline assigns a signature three-number classification system to traditional OHLC candlesticks, in order to better parameterize their OHLC distance ratios. He then uses the output as a predictor for future behavior.
The Updata code based on Cline’s article can be found in the Updata library and may be downloaded by clicking the custom menu and indicator library. Those who cannot access the library due to a firewall may paste the code below into the Updata custom editor and save it.
'CandlesCondensed
PARAMETER "Avg. Period" #PERIOD=20
PARAMETER "Segment Count" #SEGMENTCOUNT=5
DISPLAYSTYLE LINE
INDICATORTYPE TOOL
NAME CANDLES CONDENSED
@SEGMENTDIVISOR=0
@RANGE=0
@RANGEMULT=0
@HO=0
@HC=0
@OL=0
@CANDLESIGNATURE=0
FOR #CURDATE=#PERIOD TO #LASTDATE
   @SEGMENTDIVISOR=100/#SEGMENTCOUNT
   @RANGEMULT=MIN(HIGH-LOW/SGNL(HIGH-LOW,#PERIOD,M),1)
   @RANGE=(HIGH-LOW)/100
   @HO=INT((@RANGEMULT/@SEGMENTDIVISOR)*((HIGH-OPEN)/@RANGE))
   @HC=INT((@RANGEMULT/@SEGMENTDIVISOR)*((HIGH-CLOSE)/@RANGE))
   @OL=INT((@RANGEMULT/@SEGMENTDIVISOR)*((OPEN-LOW)/@RANGE))
   DRAWTEXT LOW BELOW @HO ":" @HC ":" @OL
NEXT
A sample chart implementation is in Figure 10.
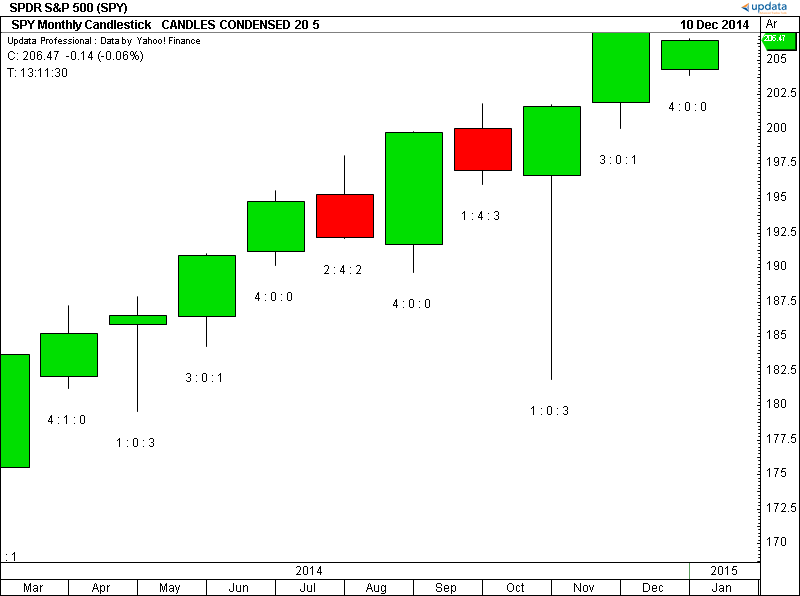
FIGURE 10: UPDATA. Here is the condensed candlestick technique as applied to the monthly SPY ETF. The number classification is displayed beneath the candlesticks, as opposed to a grid.
—Updata support team
support@updata.co.uk
www.updata.co.uk
BACK TO LIST
MICROSOFT EXCEL: FEBRUARY 2015
In “Candlesticks, Condensed” in this issue, author Dave Cline presents a way to construct candle signatures. He then suggests that you can use a database of these signatures to perform a statistical analysis of their predictive power as to market movements one, two, three, four, or more bars into the future.
Cline then suggests that the user might also combine a sequence of two or more consecutive candle signatures into a single key and perhaps gain a more deterministic probability output.
Cline’s work in his article represents a step into the broader realm of time series data mining. A simple Google search on the words “time series meaningful pattern discovery” (or some variation thereof) will pull up quite a number of research papers that propose methods of data mining number or letter series to discover subsequences (words?) of various lengths that may have predictive power.
Cline’s candle signature method creates a financial time series “alphabet” where the possible number of “letters” in this alphabet can be determined by user-defined resolution settings.
As Cline, and the literature, suggest, you will need a significant amount of storage and computing power to fully exploit the possibilities of finding “words” with statistical predictive value. Perhaps one day someone will figure out how to spell “approaching strong uptrend” with this alphabet! What an interesting way to start trying!
The Excel spreadsheet for this month uses the logic described in Cline’s article and fleshed out in Cline’s Python code to create the bar signatures. (Cline’s Python code can be found at the S&C website from the article code link at www.traders.com.) Cline’s code accumulates an output database of unique candle signatures found by cycling through bars for 10 different sector ETFs.
The spreadsheet I am providing here will allow you to use Cline’s ETF list or any other set of symbols with historical data on Yahoo! Finance. You may use as many symbols as you have the patience to process.
Figure 11 shows the controls for building the signature database. You set the items that are bolded in blue to your tastes and click the button.

FIGURE 11: EXCEL, BUILDING THE SIGNATURE DATABASE
After plenty of screen flashing for a minute or so, we will have built our signature statistics “database” on the CondensedCandleStats tab (Figure 12). We also have our signature database sorted by rank at the various look-forward periods on the RankedCandleStats tab (Figure 13).

FIGURE 12: EXCEL, SIGNATURE DATABASE WITH PERTINENT STATISTICS FOR FOUR LOOK-FORWARD BAR COUNTS

FIGURE 13: EXCEL, RANKED SIGNATURES BY LOOK-FORWARD BAR COUNT
To put the signature database to use, the CalculationsAndCharts tab (Figure 14) calculates the bar signatures for the symbol shown on the chart. The signature for the bar at the cursor is used to look up and display values from the signature data at the bottom of the chart.
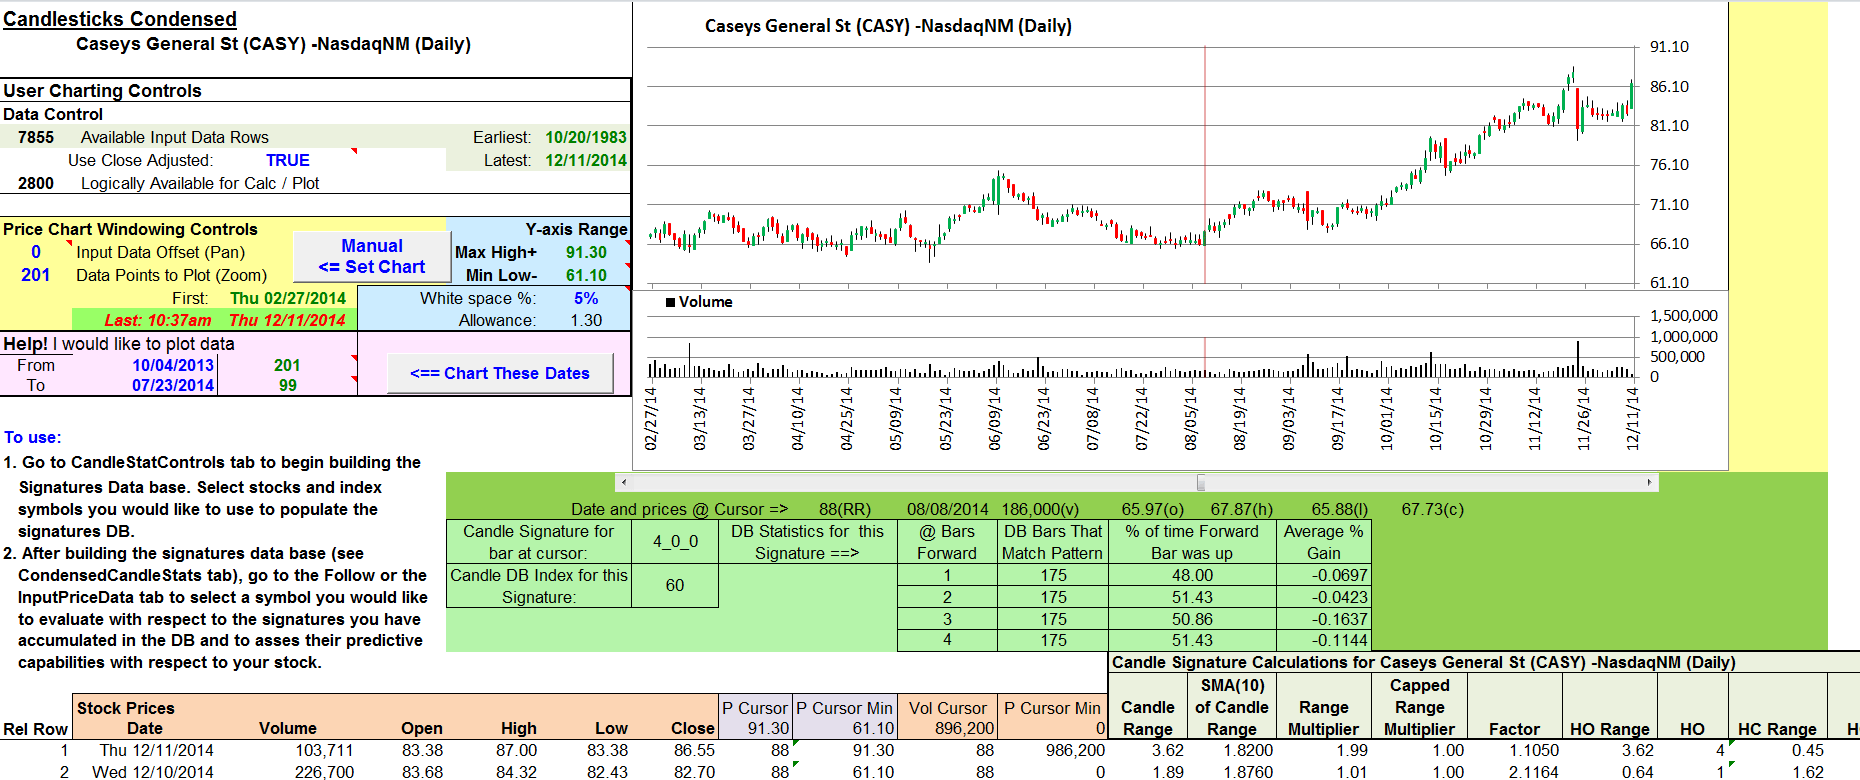
FIGURE 14: EXCEL, SIGNATURE. What does the signature database have to say about the bar under the cursor?
The spreadsheet file for this Traders’ Tip can be downloaded below. To successfully download it, follow these steps:
- Right-click on the Excel file link, then
- Select “save as” (or “save target as”) to place a copy of the spreadsheet file on your hard drive.
Note: Dave Cline’s Python code provided with his article appears to have been written to run on the Quantopian website platform. I am providing a link to that site for reference only: https://www.quantopian.com/home.
—Ron McAllister
Excel and VBA programmer
rpmac_xltt@sprynet.com
BACK TO LIST
Originally published in the February 2015 issue of
Technical Analysis of STOCKS & COMMODITIES magazine.
All rights reserved. © Copyright 2015, Technical Analysis, Inc.


