TRADERS’ TIPS
September 2015
For this month’s Traders’ Tips, the focus is John Ehlers’ article
in this issue, “Decyclers.” Here, we present the September 2015
Traders’ Tips code with possible implementations in various software.
The Traders’ Tips section is provided to help the reader implement
a selected technique from an article in this issue or another recent issue.
The entries here are contributed by software developers or programmers for
software that is capable of customization.

TRADESTATION: SEPTEMBER 2015
In “Decyclers” in this issue, author John Ehlers describes a method
for constructing an oscillator that can help traders detect trend reversals
with almost no lag. Ehlers calls this new oscillator a decycler. The
author begins the process by isolating the high-frequency components present
in the input data. He then subtracts these from the input data leaving only
the lower-frequency components representing the trend.
For convenience, we are providing some EasyLanguage code for the simple decycler
and decycler oscillator indicators based on Ehlers’ concepts. In addition,
we are providing code for a TradeStation function to calculate the decycler
oscillator, and a strategy that demonstrates the function’s usage.
Indicator: Simple Decycler

// TASC Sep 2015
// Decyclers - John F. Ehlers
// Simple Decyclers

inputs:
	HPPeriod( 125 ) ;

variables:
	alpha1( 0 ),
	HP( 0 ),
	Decycle( 0 ) ;

// High Pass Filter
alpha1 = ( Cosine ( 0.707 * 360 / HPPeriod ) +
Sine( 0.707 * 360 / HPPeriod ) - 1 )
/ Cosine( .707 * 360 / HPPeriod ) ;

HP = ( 1 - alpha1 / 2 ) * ( 1 - alpha1 / 2 ) *
( Close - 2 * Close[1] + Close[2] ) + 2 *
( 1 - alpha1 ) * HP[1] - ( 1 - Alpha1 ) *
( 1 - alpha1 ) * HP[2] ;

Decycle = Close - HP ;

Plot1( Decycle, "DeCycle" ) ;
Plot2( 1.005 * Decycle, "UpperBand" ) ;
Plot3( 0.995 * Decycle, "LowerBand" ) ;


Indicator: Decycler Oscillator

// TASC Sep 2015
// Decyclers - John F. Ehlers
// Decycler Oscillator

inputs:
	HPPeriod( 125 ),
	K( 1 ) ;

variables:
	alpha1( 0 ),
	alpha2( 0 ),
	HP( 0 ),
	Decycle( 0 ),
	DecycleOsc( 0 ) ;


alpha1 = ( Cosine ( 0.707 * 360 / HPPeriod ) +
Sine( 0.707 * 360 / HPPeriod ) - 1 )
/ Cosine( .707 * 360 / HPPeriod ) ;

HP = ( 1 - alpha1 / 2 ) * ( 1 - alpha1 / 2 ) *
( Close - 2 * Close[1] + Close[2] ) + 2 *
( 1 - alpha1 ) * HP[1] - ( 1 - Alpha1 ) *
( 1 - alpha1 ) * HP[2] ;

Decycle = Close - HP ;


alpha2 = ( Cosine( 0.707 * 360 / ( 0.5 * HPPeriod ) )
+ Sine( 0.707 * 360 / ( 0.5 * HPPeriod ) ) - 1) /
 Cosine( 0.707 * 360 / ( 0.5 * HPPeriod ) ) ;

DecycleOsc = ( 1 - alpha2 / 2 ) * ( 1 - alpha2 / 2 ) *
( Decycle - 2 * Decycle[1] + Decycle[2] ) + 2 *
( 1 - alpha2 ) * DecycleOsc[1] - ( 1 - alpha2 ) *
( 1 - alpha2 ) * DecycleOsc[2] ;


Plot1( 100 * K * DecycleOsc / Close, "DecycleOsc" ) ;
Plot2( 0, "ZeroLine" ) ;


Function: DecyclerOscillator

// TASC Sep 2015
// Decyclers - John F. Ehlers
// Decycler Oscillator Function

inputs:
	Price( NumericSeries ),
	HPPeriod( NumericSimple ),
	K( NumericSimple ) ;

variables:
	alpha1( 0 ),
	alpha2( 0 ),
	HP( 0 ),
	Decycle( 0 ),
	DecycleOsc( 0 ) ;

// High Pass Filter
alpha1 = ( Cosine ( 0.707 * 360 / HPPeriod ) +
Sine( 0.707 * 360 / HPPeriod ) - 1 ) /
Cosine( .707 * 360 / HPPeriod ) ;

HP = ( 1 - alpha1 / 2 ) * ( 1 - alpha1 / 2 ) *
( Price - 2 * Price[1] + Price[2] ) + 2 *
( 1 - alpha1 ) * HP[1] - ( 1 - Alpha1 ) *
( 1 - alpha1 ) * HP[2] ;

Decycle = Price - HP ;

alpha2 = ( Cosine( 0.707 * 360 / ( 0.5 * HPPeriod ) )
+ Sine( 0.707 * 360 / ( 0.5 * HPPeriod ) ) - 1) /
Cosine( 0.707 * 360 / ( 0.5 * HPPeriod ) ) ;

DecycleOsc = ( 1 - alpha2 / 2 ) * ( 1 - alpha2 / 2 ) *
( Decycle - 2 * Decycle[1] + Decycle[2] ) + 2 *
( 1 - alpha2 ) * DecycleOsc[1] - ( 1 - alpha2 ) *
( 1 - alpha2 ) * DecycleOsc[2] ;

DecyclerOscillator = 100 * K * DecycleOsc / Price ;


Strategy: Decycler Oscillator

// TASC Sep 2015
// Decyclers - John F. Ehlers
// Decycler Oscillator Strategy

inputs:
	Price( Close ),
	Fast_HPPeriod( 100 ),
	Fast_K( 1.2 ),
	Slow_HPPeriod( 125 ),
	Slow_K( 1 ) ;

variables:
	Fast_Val( 0 ),
	Slow_Val( 0 ) ;

Fast_Val =
DecyclerOscillator( Price, Fast_HPPeriod, Fast_K ) ;

Slow_Val =
DecyclerOscillator( Price, Slow_HPPeriod, Slow_K ) ;

if Fast_Val crosses over Slow_Val then
	Buy next bar at Market
else if Slow_Val crosses over Fast_Val then
	SellShort next bar at Market ;
To download the EasyLanguage code, please visit our TradeStation and EasyLanguage
support forum. The code for this article can be found here: https://www.tradestation.com/TASC-2015.
The ELD filename is “TASC_SEP2015.ELD.” For more information about
EasyLanguage in general, please see https://www.tradestation.com/EL-FAQ.
A sample chart is shown in Figure 1.
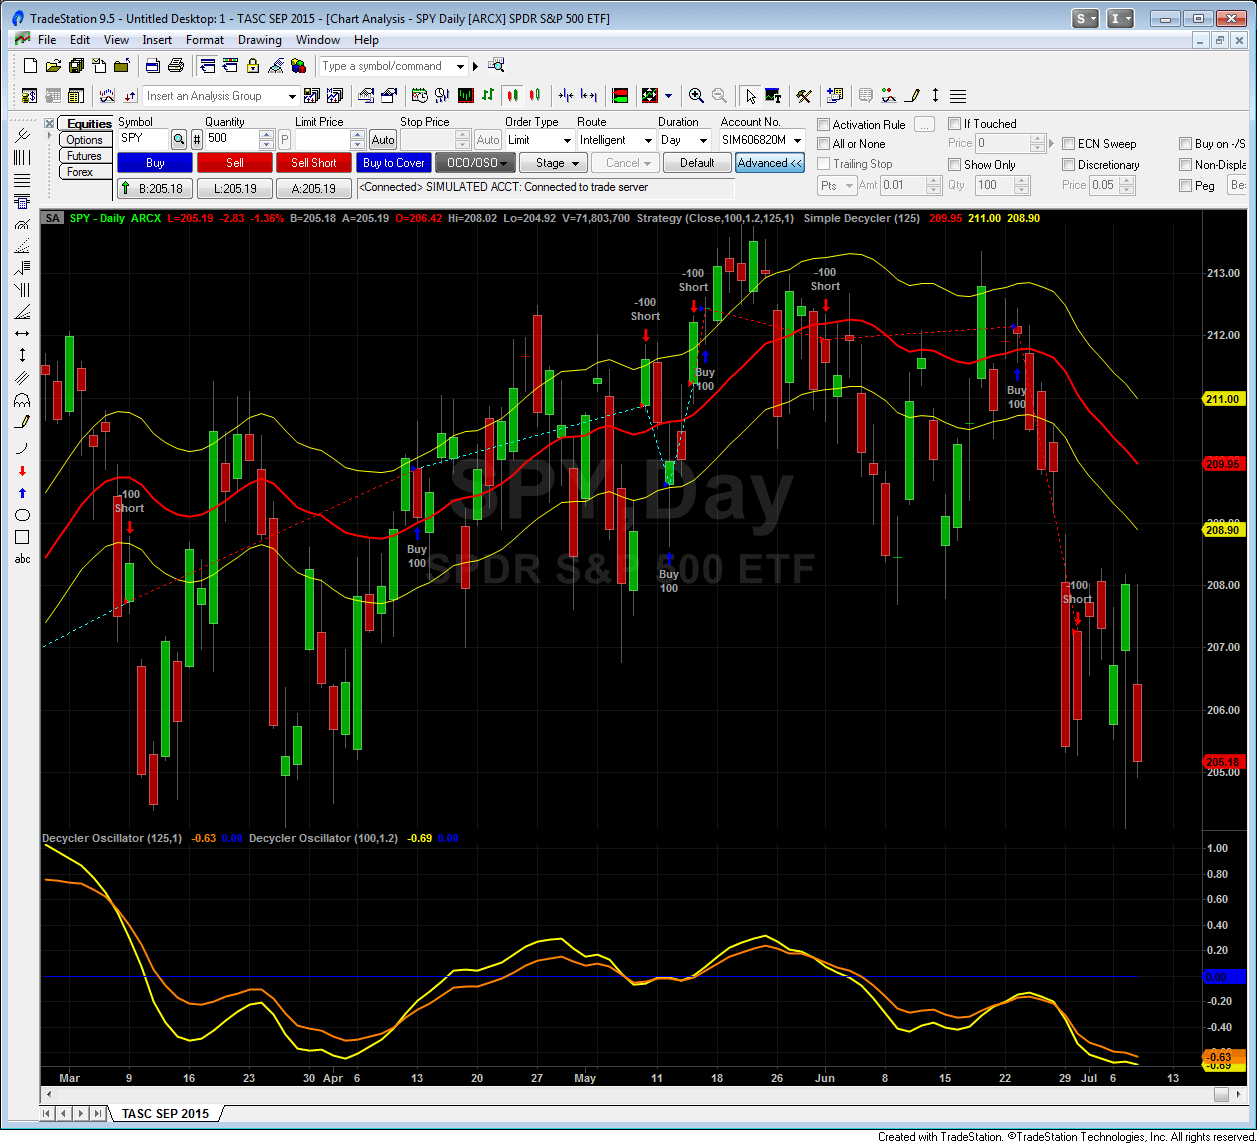
FIGURE 1: TRADESTATION. Here is an example of the simple
decycler, decycler oscillator indicators, and decycler oscillator strategy
applied to a daily chart of the SPY.
This article is for informational purposes. No type of trading or investment
recommendation, advice, or strategy is being made, given, or in any manner
provided by TradeStation Securities or its affiliates.
—Doug McCrary
TradeStation Securities, Inc.
www.TradeStation.com
BACK TO LIST

METASTOCK: SEPTEMBER 2015
In “Decyclers” in this issue, author John Ehlers presents a simple
decycler and his decycle oscillator. MetaStock formulas based on his article
are shown here:
Simple Decycler:

ti:= 125;{time periods}
alpha1:= (Cos(.707*360/ti) + Sin(.707*360/ti) -1)/Cos(.707*360/ti);
HP:= (1-alpha1/2)*(1-alpha1/2)*(C - Ref(2*C,-1) + Ref(C,-2)) +
2*(1-alpha1)*PREV - (1-alpha1)*(1-alpha1)*Ref(PREV,-1);
decycle:= C - hp;
Decycle;
1.005*decycle;
0.995*decycle

Decycle Oscillator:

ti:= 125;{time periods}
K:= 1;   {scaler}
alpha1:= (Cos(.707*360/ti) + Sin(.707*360/ti) -1)/Cos(.707*360/ti);
HP:= (1-alpha1/2)*(1-alpha1/2)*(C - Ref(2*C,-1) + Ref(C,-2)) +
2*(1-alpha1)*PREV - (1-alpha1)*(1-alpha1)*Ref(PREV,-1);
decycle:= C - hp;
alpha2:= (Cos(.707*360/(.5*ti)) + Sin(.707*360/(.5*ti)) -1)/Cos(.707*360/(.5*ti));
DecycleOsc:= (1-alpha2/2)*(1-alpha2/2)*(decycle - Ref(2*decycle,-1) + Ref(decycle,-2)) + 2*(1-alpha2)*PREV - (1-alpha2)*(1-alpha2)*Ref(PREV,-1);
100*k*DecycleOsc/C
—William Golson
MetaStock Technical Support
www.metastock.com
BACK TO LIST

eSIGNAL:
SEPTEMBER 2015
For this month’s Traders’ Tip, we’re providing two studies: SimpleDecycler.efs and DecyclerOscillator.efs,
based on the article in this issue by John Ehlers, titled “Decyclers.” In
the article, Ehlers presents a method of identifying trends with virtually
no lag, unlike with moving averages. The SimpleDecycler study is overlaid on
the chart (see Figure 2), whereas the DecyclerOscillator is displayed as a
subchart (Figure 3).
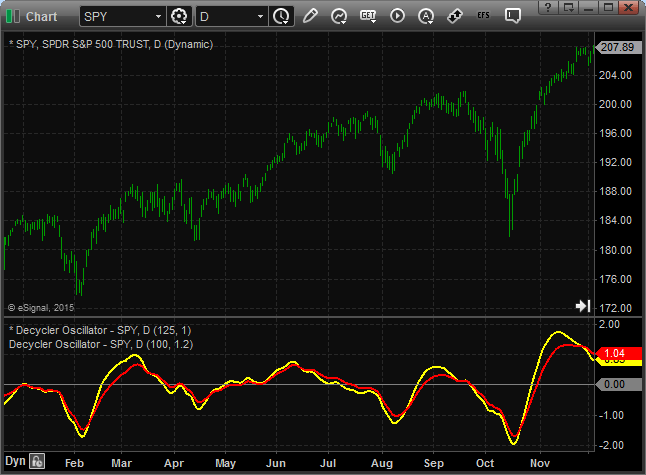
FIGURE 2: eSIGNAL. Here is an example of the SimpleDecycler
study plotted on a daily chart of the SPY.
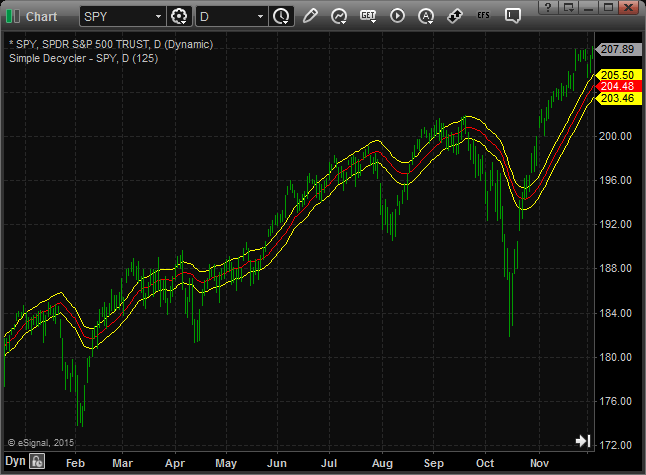
Figure 3: eSIGNAL. Here is an example of the DecyclerOscillator
study plotted on a daily chart of the SPY.
The studies contain formula parameters that may be configured through the edit
chart window (right-click on the chart and select “edit chart”).
To discuss this study or download a complete copy of the formula code, please
visit the EFS Library Discussion Board forum under the forums link
from the support menu at www.esignal.com or
visit our EFS KnowledgeBase at https://www.esignal.com/support/kb/efs/.
The eSignal formula script (EFS) is also available here:
/*********************************

Provided By:

    Interactive Data Corporation (Copyright © 2015)

    All rights reserved. This sample eSignal Formula Script (EFS)

    is for educational purposes only. Interactive Data Corporation

    reserves the right to modify and overwrite this EFS file with

    each new release.


Description:

    Decyclers by John Ehlers


Formula Parameters:                     Default:

    HP Period                           125


Version:            1.00  07/09/2015


Notes:

    The related article is copyrighted material. If you are not a subscriber

    of Stocks & Commodities, please visit www.traders.com.


**********************************/


var fpArray = new Array();


function preMain(){


    setStudyTitle("Simple Decycler");

    setPriceStudy(true);


    setCursorLabelName("UpperBand", 0);

    setCursorLabelName("Decycler", 1);

    setCursorLabelName("LowerBand", 2);


    setDefaultBarFgColor(Color.red, 1);


    var x = 0;


    fpArray[x] = new FunctionParameter("fpHPPeriod", FunctionParameter.NUMBER);

    with(fpArray[x++]){

        setName("HP Period");

        setLowerLimit(1);

        setDefault(125);

    }

}


var bInit = false;

var bVersion = null;


var xClose = null;

var xHP = null;


function main(fpHPPeriod){


    if (bVersion == null) bVersion = verify();

    if (bVersion == false) return;


    if (!bInit){


        xClose = close();

        xHP = efsInternal('Calc_HP', xClose, fpHPPeriod);


        bInit = true;

    };


    var nClose = xClose.getValue(0);

    var nHP = xHP.getValue(0);


    if (nHP == null || nClose == null)

        return;


    var nDecycle = nClose - nHP;


    return [nDecycle * 1.005, nDecycle, nDecycle * .995];

}


var nAlpha = null;


function Calc_HP(xSource, nPeriod){


    nAlpha = (Math.cos(.707*360 / nPeriod * Math.PI / 180) +

              Math.sin(.707*360 / nPeriod * Math.PI / 180) - 1) /

              Math.cos(.707*360 / nPeriod * Math.PI / 180);


    var nSource = xSource.getValue(0);

    var nSource1 = xSource.getValue(-1);

    var nSource2 = xSource.getValue(-2);


    if (nSource == null || nSource1 == null|| nSource2 == null)

        return;


    var nHP_1 = ref(-1);

    var nHP_2 = ref(-2);


    var nHP = Math.pow((1 - nAlpha / 2), 2) * (nSource - 2 * nSource1 + nSource2) +

              2 * (1 - nAlpha) * nHP_1 - Math.pow((1 - nAlpha), 2) * nHP_2;


    return nHP;

}


function verify(){


    var b = false;


    if (getBuildNumber() < 779){


        drawTextAbsolute(5, 35, "This study requires version 8.0 or later.",

            Color.white, Color.blue, Text.RELATIVETOBOTTOM|Text.RELATIVETOLEFT|Text.BOLD|Text.LEFT,

            null, 13, "error");

        drawTextAbsolute(5, 20, "Click HERE to upgrade.@URL=https://www.esignal.com/download/default.asp",

            Color.white, Color.blue, Text.RELATIVETOBOTTOM|Text.RELATIVETOLEFT|Text.BOLD|Text.LEFT,

            null, 13, "upgrade");

        return b;

    }

    else

        b = true;


    return b;

}
/*********************************

Provided By:

    Interactive Data Corporation (Copyright © 2015)

    All rights reserved. This sample eSignal Formula Script (EFS)

    is for educational purposes only. Interactive Data Corporation

    reserves the right to modify and overwrite this EFS file with

    each new release.


Description:

    Decyclers by John Ehlers


Formula Parameters:                     Default:

    HP Period                           125

    K                                   1


Version:            1.00  07/09/2015


Notes:

    The related article is copyrighted material. If you are not a subscriber

    of Stocks & Commodities, please visit www.traders.com.


**********************************/


var fpArray = new Array();


function preMain(){


    setStudyTitle("Decycler Oscillator");


    setCursorLabelName("ZeroLine", 0);

    setCursorLabelName("DecyclerOsc", 1);


    setDefaultBarFgColor(Color.grey, 0);


    setDefaultBarThickness(1, 0);

    setDefaultBarThickness(2, 1);


    setShowCursorLabel(false, 0);

    setShowCursorLabel(true, 1);


    var x = 0;


    fpArray[x] = new FunctionParameter("fpHPPeriod", FunctionParameter.NUMBER);

    with(fpArray[x++]){

        setName("HP Period");

        setLowerLimit(1);

        setDefault(125);

    }


    fpArray[x] = new FunctionParameter("fpK", FunctionParameter.NUMBER);

    with(fpArray[x++]){

        setName("K");

        setDefault(1);

    }

}


var bInit = false;

var bVersion = null;


var xClose = null;

var xHP = null;

var xDecycle = null;

var xDecycleOsc = null;


function main(fpHPPeriod, fpK){


    if (bVersion == null) bVersion = verify();

    if (bVersion == false) return;


    if (!bInit){


        xClose = close();

        xHP = efsInternal('Calc_HP', xClose, fpHPPeriod);

        xDecycle = efsInternal('Calc_Decycle', xClose, xHP);

        xDecycleOsc = efsInternal('Calc_HP', xDecycle, .5 * fpHPPeriod);


        bInit = true;

    };


    var nClose = xClose.getValue(0);

    var nDecycleOsc = xDecycleOsc.getValue(0);


    if (nDecycleOsc == null || nClose == null)

        return;


    var nReturnValue = 100 * fpK * nDecycleOsc / nClose;


    return [0, nReturnValue];

}


var nAlpha = null;


function Calc_HP(xSource, nPeriod){


    nAlpha = (Math.cos(.707*360 / nPeriod * Math.PI / 180) +

              Math.sin(.707*360 / nPeriod * Math.PI / 180) - 1) /

              Math.cos(.707*360 / nPeriod * Math.PI / 180);


    var nSource = xSource.getValue(0);

    var nSource1 = xSource.getValue(-1);

    var nSource2 = xSource.getValue(-2);


    if (nSource == null || nSource1 == null|| nSource2 == null)

        return;


    var nHP_1 = ref(-1);

    var nHP_2 = ref(-2);


    var nHP = Math.pow((1 - nAlpha / 2), 2) * (nSource - 2 * nSource1 + nSource2) +

              2 * (1 - nAlpha) * nHP_1 - Math.pow((1 - nAlpha), 2) * nHP_2;


    return nHP;

}


function Calc_Decycle(xSource, xHP){


    var nSource = xSource.getValue(0);

    var nHP = xHP.getValue(0);


    if (nHP == null || nSource == null)

        return;


    var nDecycle = nSource - nHP;


    return nDecycle;

}


function verify(){


    var b = false;


    if (getBuildNumber() < 779){


        drawTextAbsolute(5, 35, "This study requires version 8.0 or later.",

            Color.white, Color.blue, Text.RELATIVETOBOTTOM|Text.RELATIVETOLEFT|Text.BOLD|Text.LEFT,

            null, 13, "error");

        drawTextAbsolute(5, 20, "Click HERE to upgrade.@URL=https://www.esignal.com/download/default.asp",

            Color.white, Color.blue, Text.RELATIVETOBOTTOM|Text.RELATIVETOLEFT|Text.BOLD|Text.LEFT,

            null, 13, "upgrade");

        return b;

    }

    else

        b = true;


    return b;

}
—Eric Lippert
eSignal, an Interactive Data company
800 779-6555, www.eSignal.com
BACK TO LIST

THINKORSWIM: SEPTEMBER 2015
In “Decyclers” in this issue, author John Ehlers presents the
idea of detrending to build his decycler. In general, Ehlers discusses
how cycle patterns go hand in hand with trends, so he built his decycler to
go hand in hand with detrending studies.
We have built two new studies—the simpler decycler and decycler
oscillator—for use in thinkorswim based on these concepts. The
studies use our proprietary scripting language, thinkscript. We have made
the loading process extremely easy; simply click on the following links: https://tos.mx/OZUx2C and https://tos.mx/HPPszc,
and choose save script to thinkorswim, then choose to rename your
studies to “SimplerDecycler” and “DecyclerOscillator,” in
that order. You can adjust the parameters of these within the edit studies window
to fine-tune your variables.
In the example chart in Figure 4, you see the SimplerDecycler plotted on top
of the price graph and the DecyclerOscillator plotted in the subgraph.
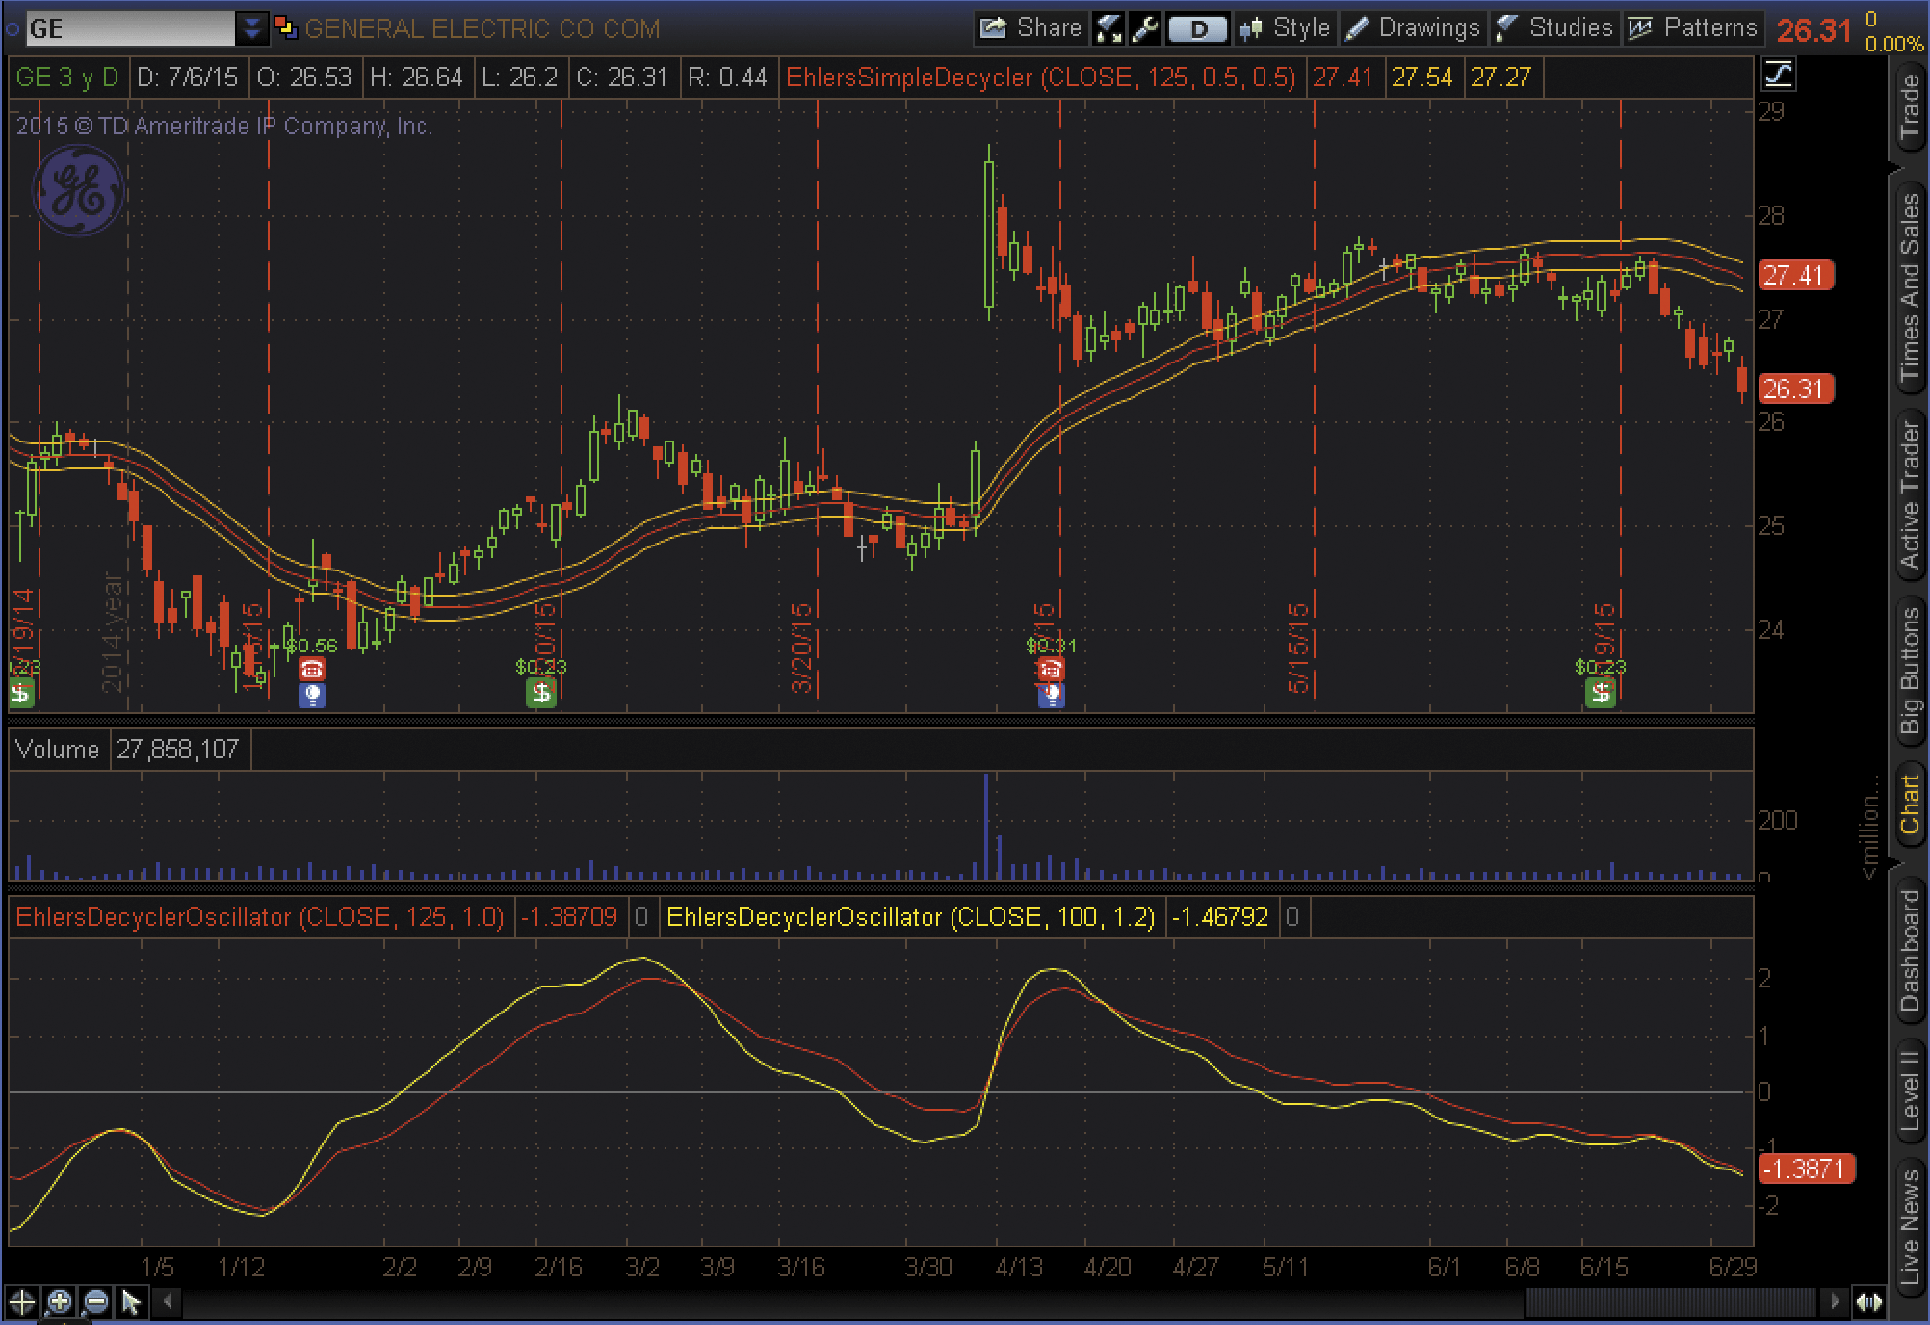
FIGURE 4: THINKORSWIM. The SimplerDecycler is plotted
on top of the price graph and the DecyclerOscillator is plotted in the subgraph.
—thinkorswim
A division of TD Ameritrade, Inc.
www.thinkorswim.com
BACK TO LIST

WEALTH-LAB: SEPTEMBER 2015
In his article in this issue, titled “Decyclers,” author John
Ehlers shares two new decycler indicators whose main feature is the ability
to identify trends with virtually zero lag.
We’ve developed a long-only trading system based on his concepts to
demonstrate the timely response of the decycler oscillator to market action.
It applies the idea of using a decycler oscillator pair with different parameters,
as discussed in Ehlers’ article:
- Enter long when the yellow line crosses over the red line
- Exit long when the yellow line crosses under the red line
On the price pane, the decycler is plotted along with the hysteresis lines
(+/- 0.5 percent). The green background indicates an uptrend in the market
(the prices are above the upper hysteresis line) and the red background indicates
a downtrend (the prices are below the lower hysteresis line). The bottom pane
illustrates trend detection according to the pair of decycler oscillators.
The yellow line has a period of 100 a K value of 1.2 and the red line
has a period of 125 and a K value of 1.
As can be seen in Figure 5, robust application of the decycler bands in a
trading system requires putting in some logic against whipsaw conditions such
as from March 2015 to June 2015. The DecyclerOscillator seems to produce less
whipsaws.
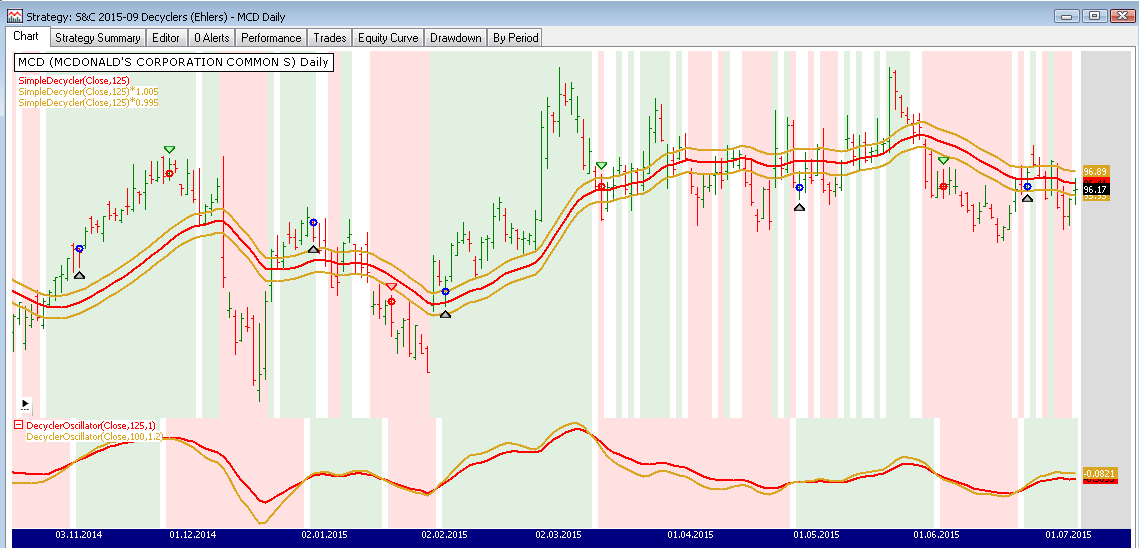
FIGURE 5: WEALTH-LAB. The price pane shows the decycler
indicator with the hysteresis lines. The bottom pane plots a pair of decycler
oscillators.
To execute the included trading system, Wealth-Lab users need to install (or
update to) the latest version of the TASCIndicators library from the extensions
section of our website if they haven’t already done so, and restart Wealth-Lab.
Wealth-Lab 6 code (C#):

using System;
using System.Collections.Generic;
using System.Text;
using System.Drawing;
using WealthLab;
using WealthLab.Indicators;
using TASCIndicators;

namespace WealthLab.Strategies
{
	public class MyStrategy : WealthScript
	{
		protected override void Execute()
		{
			// Decycler and oscillator
			SimpleDecycler sd = SimpleDecycler.Series(Close,125);
            DecyclerOscillator do1 = DecyclerOscillator.Series(Close,125,1.0);
			// Hysteresis band 0.5%
			DecyclerOscillator do2 = DecyclerOscillator.Series(Close,(int)(125 * 0.8),1.0 * 1.2);

			HideVolume();
			ChartPane paneDecyclerOsc = CreatePane(30,false,true);
			PlotSeries(paneDecyclerOsc,do1,Color.Red,LineStyle.Solid,2);
			PlotSeries(paneDecyclerOsc,do2,Color.Goldenrod,LineStyle.Solid,2);
			PlotSeries(PricePane,sd,Color.Red,LineStyle.Solid,2);
			PlotSeriesFillBand(PricePane, sd * 1.005, sd * 0.995, Color.Goldenrod, Color.Transparent, LineStyle.Solid, 2);

			for(int bar = GetTradingLoopStartBar(125); bar < Bars.Count; bar++)
			{
				if ( Close[bar] > (sd[bar] * 1.005) )
					SetPaneBackgroundColor( PricePane, bar, Color.FromArgb(30,Color.Green) );

				else
					if ( Close[bar] < (sd[bar] * 0.995) )
                    SetPaneBackgroundColor( PricePane, bar, Color.FromArgb(30,Color.Red) );

				bool reverse2Uptrend = CrossOver( bar, do2, do1 );
				bool reverse2Downtrend = CrossUnder( bar, do2, do1 );

				if (IsLastPositionActive)
				{
					if ( !reverse2Downtrend || reverse2Uptrend )
						SetPaneBackgroundColor( paneDecyclerOsc, bar, Color.FromArgb(30,Color.Green) );

					if( reverse2Downtrend )
						SellAtMarket(bar+1, LastPosition);
				}
				else
				{
					if ( reverse2Downtrend || !reverse2Uptrend )
						SetPaneBackgroundColor( paneDecyclerOsc, bar, Color.FromArgb(30,Color.Red) );


					if( reverse2Uptrend )
						BuyAtMarket(bar+1);
				}
			}
		}
	}
}
—Eugene, Wealth-Lab team
MS123, LLC
www.wealth-lab.com
BACK TO LIST

AMIBROKER: SEPTEMBER 2015
In “Decyclers” in this issue, author John Ehlers presents an oscillator
based on a second-order high-pass filtering technique. A ready-to-use AmiBroker
formula is shown here. The formula is written so it works with any AmiBroker
version, but users of the most recent version may uncomment the part that uses
the newly introduced IIR function for speed. To use the oscillator, enter the
code in the formula editor and press the apply indicator button. You
can adjust the exponential average period and the RSI smoothing period using
the parameters window.
A sample chart is shown in Figure 6.
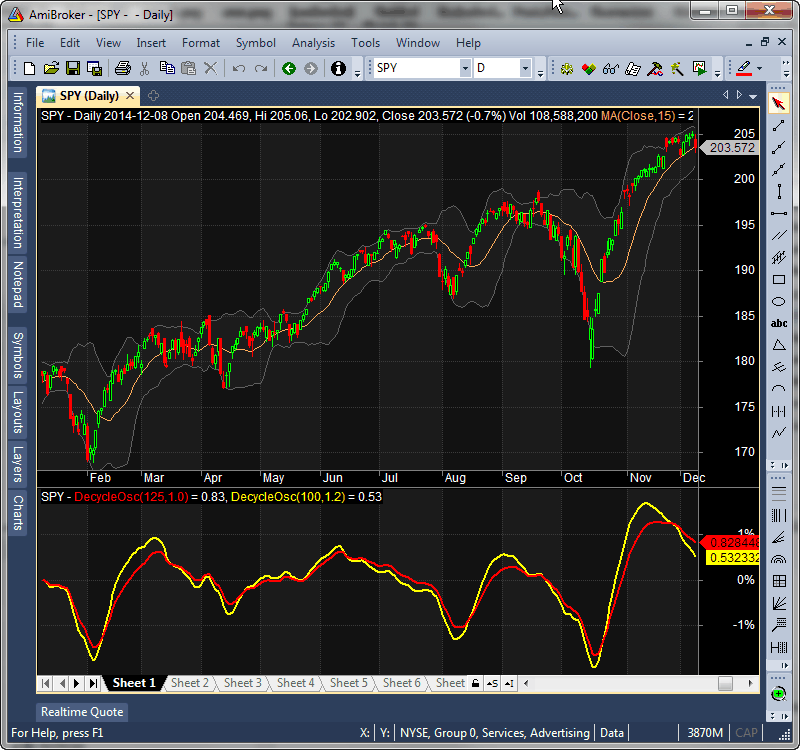
FIGURE 6: AMIBROKER. Here is a daily chart of the SPY
with decycle oscillators 125/1.0 and 100/1.2, which replicates one of the
charts from John Ehlers’ article in this issue.
AMIBROKER CODE LISTING.
SetBarsRequired( sbrAll );

function HighPass( input, alpha )
{
    output = input;

    for( i = 2; i < BarCount; i++ )
    {
      output[ i ] = ( 1 - alpha/2 ) ^ 2 *
                    ( input[ i ] - 2 * input[ i - 1 ] + input[ i -2 ] ) +
                    2 * ( 1 - alpha ) * output[ i - 1 ] -
                   ( 1 - alpha ) ^ 2 * output[ i - 2 ];
    }

    return output;
}

// newest version of AMiBroker (6.0) may use built-in IIR function instead
// - uncomment function below
/*
function HighPass( input, alpha )
{
   b0 = ( 1 - alpha/2 ) ^ 2;
   a1 = 2 * ( 1 - alpha );
   a2 = - ( 1 - alpha ) ^ 2;
   return IIR( input, b0, a1, -2 * b0, a2, b0 );
}
*/

function DecycleOsc( HPPeriod, K )
{
    alpha1 = 0;
    alpha2 = 0;
    HP = 0;
    Decycle = 0;

    // hipass filter
    PI = 3.1415926;

    angle1 = 0.707 * 2 * PI / HPPeriod;
    angle2 = 0.707 * 2 * PI / ( 0.5 * HPPeriod );

    alpha1 = ( cos( angle1 ) + sin( angle1 ) - 1 ) / cos( angle1 );
    alpha2 = ( cos( angle2 ) + sin( angle2 ) - 1 ) / cos( angle2 );

    HP = HighPass( Close, alpha1 );
    Decycle = Close - HP;
    return 100 * K * HighPass( Decycle, alpha2 );
}

Plot( DecycleOsc( 125, 1 )/Close, "DecycleOsc(125,1.0)",
      colorRed, styleThick );
Plot( DecycleOsc( 100, 1.2 )/Close, "DecycleOsc(100,1.2)",
      colorYellow, styleThick );
—Tomasz Janeczko, AmiBroker.com
www.amibroker.com
BACK TO LIST

NEUROSHELL TRADER: SEPTEMBER 2015
The quotient decycler and decycler oscillator indicators presented by John
Ehlers in his article in this issue (“Decyclers”) can be easily
implemented in NeuroShell Trader using NeuroShell Trader’s ability to
call external dynamic linked libraries. Dynamic linked libraries may be written
in C, C++, Power Basic, or Delphi.
After moving the code given in Ehlers’ article sidebar to your preferred
compiler and creating a DLL, you can insert the resulting indicators as follows:
- Select “New indicator” from the Insert menu.
- Choose the external program & library calls category.
- Select the appropriate external DLL call indicator.
- Set up the parameters to match your DLL.
- Select the finished button.
Similar filter and cycle-based strategies can also be created using indicators
found in John Ehlers’ Cybernetic and MESA91 NeuroShell
Trader Add-ons. Users of NeuroShell Trader can go to the Stocks & Commodities
section of the NeuroShell Trader free technical support website to download
a copy of this or any previous Traders’ Tips.
A sample chart is shown in Figure 7.
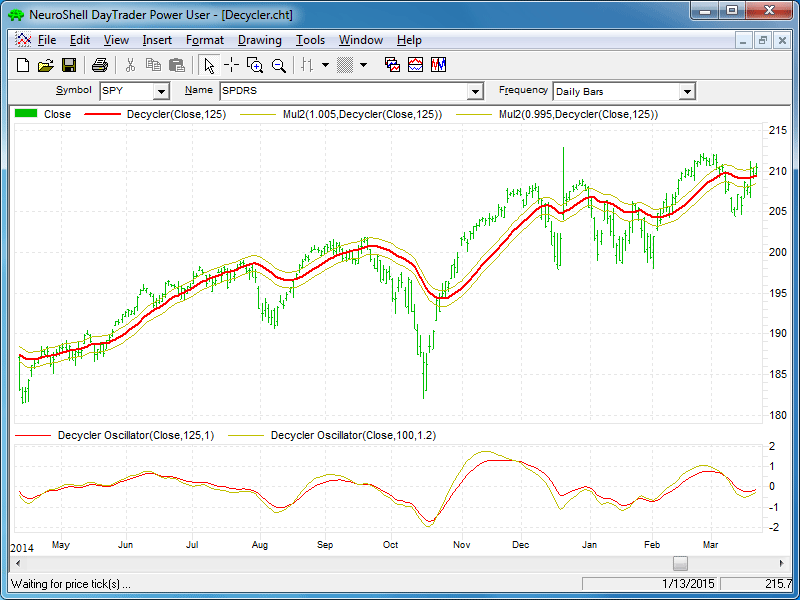
FIGURE 7: NEUROSHELL TRADER. This NeuroShell Trader chart
displays the decycler and decyler oscillator indicators.
—Marge Sherald, Ward Systems Group, Inc.
301 662-7950, sales@wardsystems.com
www.neuroshell.com
BACK TO LIST

TRADERSSTUDIO: SEPTEMBER 2015
The TradersStudio code based on John Ehlers’ article in this issue, “Decyclers,” can
be found at: www.TradersEdgeSystems.com/traderstips.htm.
The following code files are provided in the download:
- Function EHLERS_DECYCLER: Computes the decycler values
- Indicator plot EHLERS_DECYCLER_IND: For plotting the decycler indicator
on a chart
- Function EHLERS_DECYCLER_OSC: Computes the DecyclerOsc values
- Indicator plot EHLERS_DECYCLER_OSC_IND: For plotting the DecyclerOsc indicator
on a chart.
Figure 8 shows the two indicators plotted on a chart of the S&P 500 futures
contract (SP) using data from Pinnacle Data Corp.
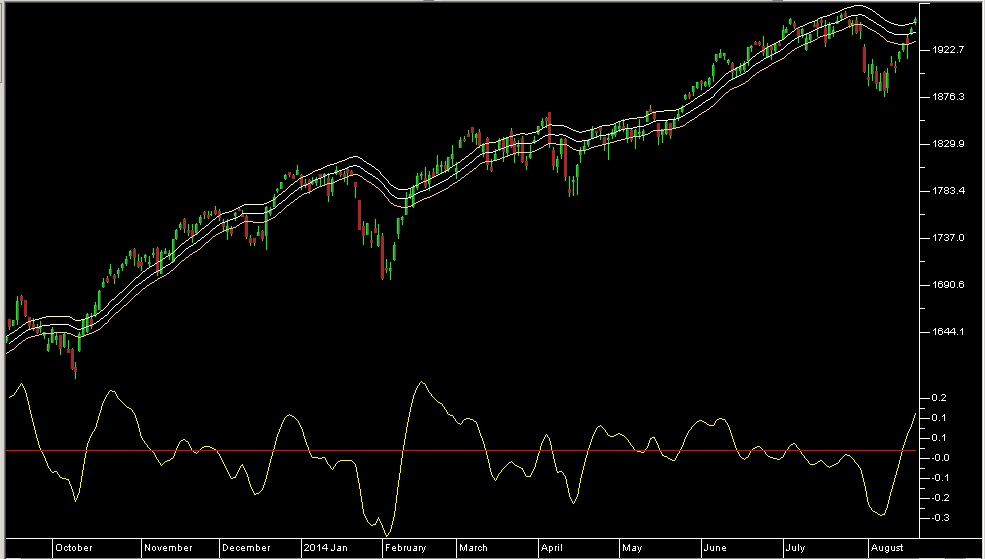
FIGURE 8: TRADERSSTUDIO. Here, the decycler indicators
are shown on a chart of S&P 500 futures contract (SP).
The code is shown here as well as at the TradersEdgeSystems.com website.
'DECYCLERS

'Author: John F. Ehlers, TASC, Sept 2015

'Coded by: Richard Denning, 7/12/15

'www.TradersEdgeSystems.com


'HIGHPASS FILTER

Function EHLERS_DECYCLER(HPPeriod)

'HPPeriod=125

Dim alpha1

Dim HP As BarArray

If Cos(DegToRad(0.707*360/HPPeriod)) <> 0 Then

   alpha1 = (Cos(DegToRad(0.707*360/HPPeriod))+Sin(DegToRad(0.707*360/HPPeriod))-1)/Cos(DegToRad(0.707*360/HPPeriod))

End If

HP = (1-alpha1/2)*(1-alpha1/2)*(C-2*C[1]+C[2])+2*(1-alpha1)*HP[1]-(1-alpha1)*(1-alpha1)*HP[2]

EHLERS_DECYCLER = C - HP

End Function

'-----------------------------------------------------------------------------------------------

Sub EHLERS_DECYCLER_IND(HPPeriod)

Dim Decycle As BarArray

Decycle = EHLERS_DECYCLER(HPPeriod)

Plot1(Decycle)

Plot2(1.005*Decycle)

Plot3(0.995*Decycle)

End Sub

'------------------------------------------------------------------------------------------------

function EHLERS_DECYCLER_OSC(HPPeriod)

'HPPeriod=125,K=1

Dim Decycle As BarArray

Dim alpha2 As BarArray

Dim DecycleOsc As BarArray

Decycle = EHLERS_DECYCLER(HPPeriod)

alpha2=(Cos(DegToRad(0.707*360/(0.5*HPPeriod)))+Sin(DegToRad(0.707+360/(0.5*HPPeriod))-1))/Cos(DegToRad(0.707-360/(0.5*HPPeriod)))

DecycleOsc=(1-alpha2/2)*(1-alpha2/2)*(Decycle-2*Decycle[1]+Decycle[2])+2*(1-alpha2)*DecycleOsc[1]-(1-alpha2)*(1-alpha2)*DecycleOsc[2]

EHLERS_DECYCLER_OSC=DecycleOsc

End Function

'--------------------------------------------------------------------------------------------------

sub EHLERS_DECYCLER_OSC_IND(HPPeriod,K)

Dim DecycleOsc As BarArray

DecycleOsc = EHLERS_DECYCLER_OSC(HPPeriod)

Plot1(100*K*DecycleOsc/C)

Plot2(0)

End Sub

'--------------------------------------------------------------------------------------------------
—Richard Denning
info@TradersEdgeSystems.com
for TradersStudio
BACK TO LIST

NINJATRADER: SEPTEMBER 2015
The simple decycler and decycler oscillator indicators described
by John Ehlers in his article in this issue, “Decyclers”, has been
made available for download at www.ninjatrader.com/SC/September2015SC.zip.
Once you have downloaded them, from within the NinjaTrader Control Center
window, select the menu File → Utilities → Import NinjaScript and
select the downloaded file. This file is for NinjaTrader version 7.
You can review the indicators’ source code by selecting the menu Tools
→ Edit NinjaScript → Indicator from within the NinjaTrader Control Center
window and selecting either the SimpleDecycler or DecyclerOscillator file.
NinjaScript uses compiled DLLs that run native, not interpreted, to provide
the highest possible performance.
A sample chart displaying the indicators is shown in Figure 9.
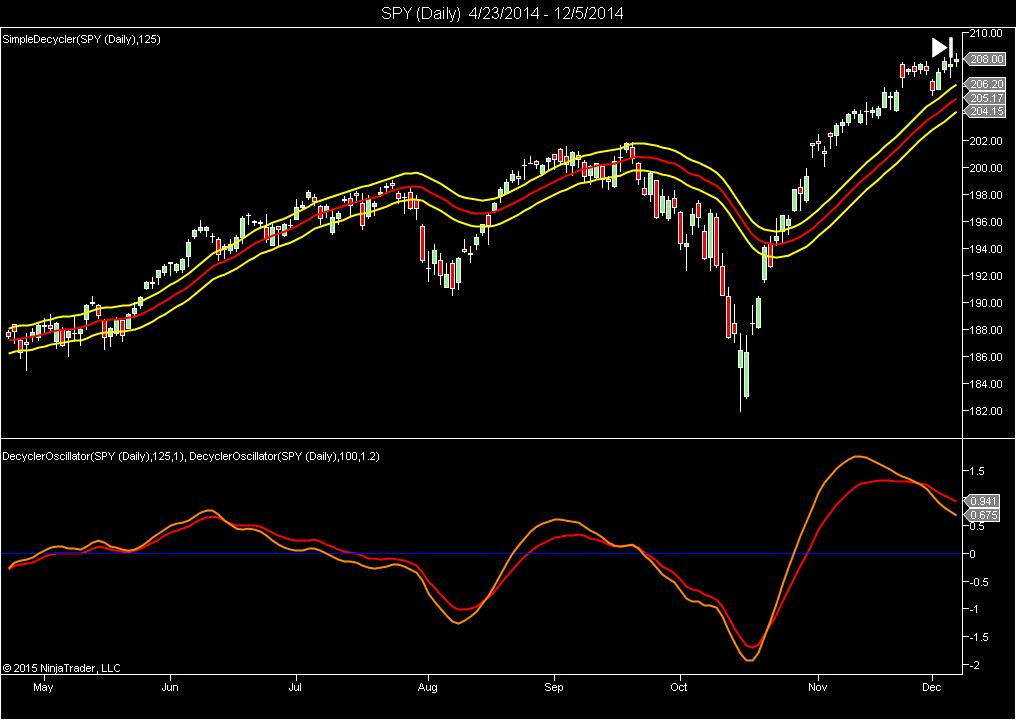
FIGURE 9: NINJATRADER. The decycler oscillator and simple
decycler are displayed together on this sample SPY daily chart ended December
2014.
—Raymond Deux & Patrick Hodges
NinjaTrader, LLC
www.ninjatrader.com
BACK TO LIST

UPDATA: SEPTEMBER 2015
In “Decyclers” in this issue, author John Ehlers develops an oscillator
that signals trend reversals with almost zero lag via digital signal processing
techniques. A high-pass filter is subtracted from the input data and the high-frequency
components are removed via cancellation of terms. Lower-frequency components
are filtered from the output, so they are not canceled from the original data.
Thus, the decycler displays them with close to zero lag.
The Updata code for both indicators is in the Updata library and may be downloaded
by clicking the custom menu and indicator library. Those
who cannot access the library due to a firewall may paste the code shown here
into the Updata custom editor and save it.
'Decyclers
DISPLAYSTYLE 3LINES
INDICATORTYPE TOOL
COLOUR RGB(200,0,0)
COLOUR2 RGB(0,0,200)
COLOUR3 RGB(0,0,200)
PARAMETER "Period" #PERIOD=125
NAME "Decycler [" #PERIOD "]" ""
@ALPHA1=0
@HP=0
@DECYCLE=0
FOR #CURDATE=0 TO #LASTDATE
   'HIGHPASS FILTER
   @ALPHA1=1+(SIN(0.707*2*CONST_PI/#PERIOD)-1)/COS(0.707*2*CONST_PI/#PERIOD)
   @HP=(1-@ALPHA1/2)*(1-@ALPHA1/2)*(CLOSE-2*CLOSE(1)+CLOSE(2))+2*(1-@ALPHA1)*HIST(@HP,1)-(1-@ALPHA1)*(1-@ALPHA1)*HIST(@HP,2)
   'DECYCLE THE DIFFERENCE BETWEEN INPUT AND HP DATA
   @DECYCLE=CLOSE-@HP
   @PLOT=@DECYCLE
   @PLOT2=1.005*@DECYCLE
   @PLOT3=0.995*@DECYCLE
NEXT

'DecyclerOscillator
DISPLAYSTYLE 2LINES
INDICATORTYPE CHART
COLOUR RGB(200,0,0)
COLOUR2 RGB(0,0,200)
COLOUR3 RGB(0,0,200)
PARAMETER "Period" #PERIOD=125
PARAMETER "K" @K=1
NAME "Decycler Osc. [" #PERIOD "] x [" @K "]" ""
@ALPHA1=0
@ALPHA2=0
@HP=0
@DECYCLE=0
@DECYCLEOSC=0
FOR #CURDATE=0 TO #LASTDATE
   'HIGHPASS FILTER
   @ALPHA1=1+(SIN(0.707*2*CONST_PI/#PERIOD)-1)/COS(0.707*2*CONST_PI/#PERIOD)
   @HP=(1-@ALPHA1/2)*(1-@ALPHA1/2)*(CLOSE-2*CLOSE(1)+CLOSE(2))+2*(1-@ALPHA1)*HIST(@HP,1)-(1-@ALPHA1)*(1-@ALPHA1)*HIST(@HP,2)
   'DECYCLE THE DIFFERENCE BETWEEN INPUT AND HP DATA
   @DECYCLE=CLOSE-@HP
   'HIGHPASS FILTER OF DECYCLE TO CREATE THE OSC.
   @ALPHA2=1+(SIN(0.707*2*CONST_PI/(#PERIOD*0.5))-1)/COS(0.707*2*CONST_PI/(#PERIOD*0.5))
   @DECYCLEOSC=(1-@ALPHA1/2)*(1-@ALPHA1/2)*(@DECYCLE-2*HIST(@DECYCLE,1)+HIST(@DECYCLE,2))+2*(1-@ALPHA1)*HIST(@DECYCLEOSC,1)-(1-@ALPHA1)*(1-@ALPHA1)*HIST(@DECYCLEOSC,2)
   @PLOT=100*@K*@DECYCLEOSC/CLOSE
   @PLOT2=0
NEXT
A sample chart is shown in Figure 10.
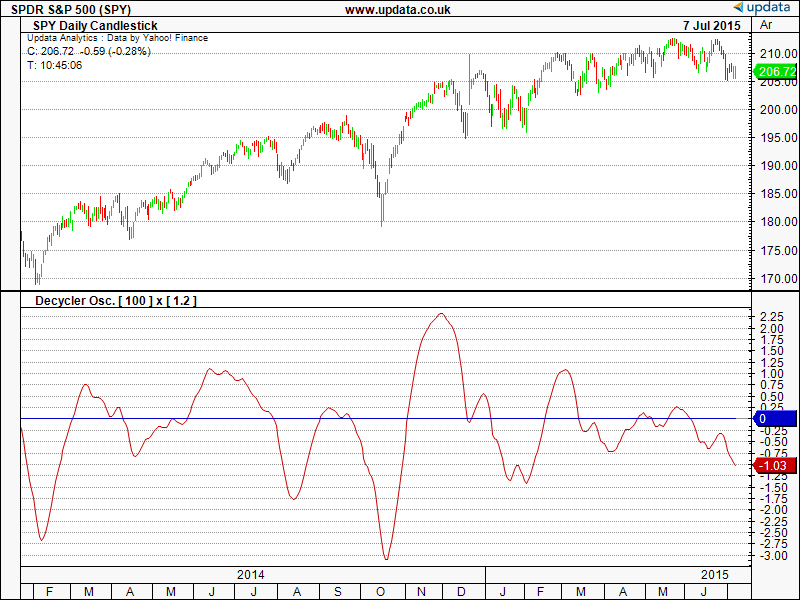
FIGURE 10: UPDATA. This chart shows the decycler oscillator
[100][1.2] as applied to the SPY ETF of daily resolution.
—Updata support team
support@updata.co.uk, www.updata.co.uk
BACK TO LIST
MICROSOFT EXCEL: SEPTEMBER 2015
In his article in this issue, titled “Decyclers,” author John
Ehlers presents a simple, interesting new way to use the high-pass filter concept
that he has discussed before in previous articles and contexts. The idea is
to subtract the high-pass filter value from the current close to get a “decycled” indicator
that follows the trend rather well by removing much of the distracting high-frequency
chatter. Apply a second high-pass filter using half the period from the first
filter to the decycled indicator and you get a smoother result with much-reduced
lag.
Divide this second result by the close value and you have an oscillator whose
turning points provide very good sensitivity to trend turning points of our
data—perhaps even better (with a bit less lag) than the base decycled
indicator.
Ehlers suggests calculating two such oscillators with differing high-pass
periods and plotting them with appropriate scaling. Then use the crossover
points to confirm trend changes.
As shown on my oscillator plot in Figure 11, I find that it is also interesting
to plot the delta of the two oscillators as a visual indication of the potential
current strength of the indicated trend.
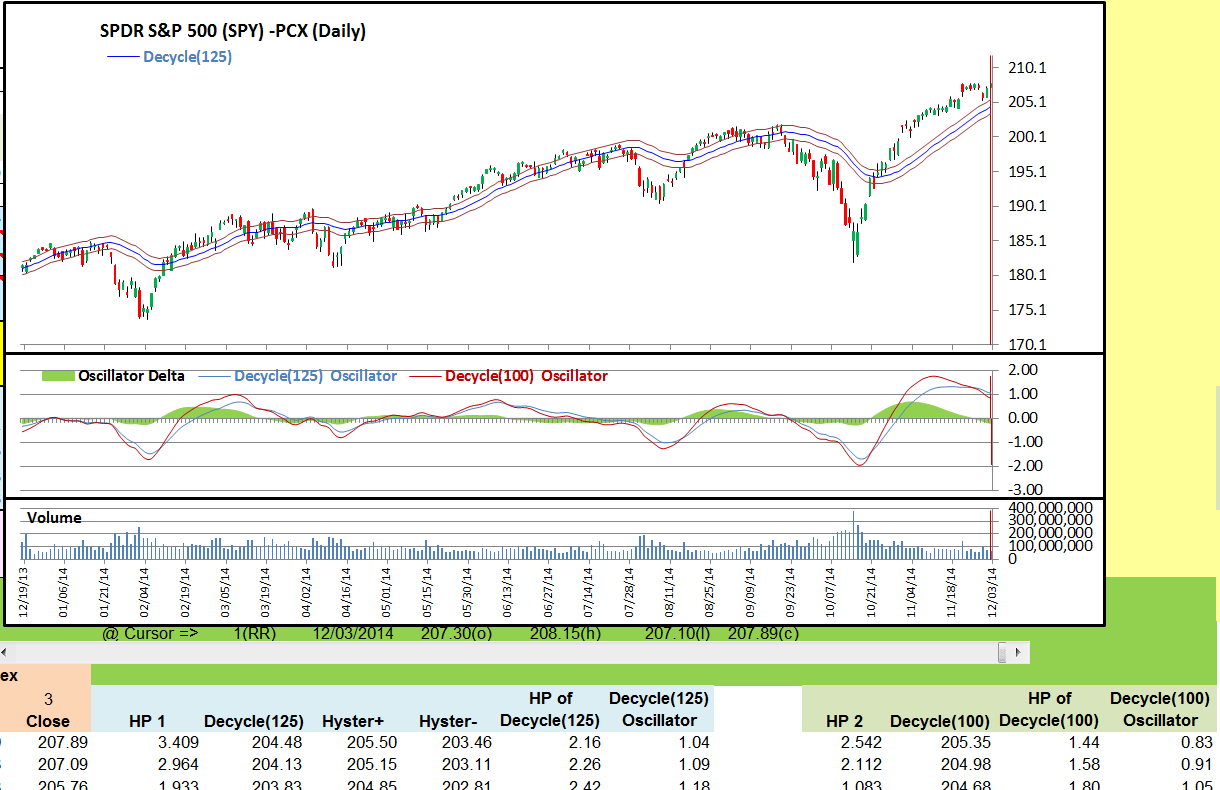
FIGURE 11: EXCEL, SPY. Here is an Excel-produced composite,
which approximates Figures 1 & 2 from John Ehlers’ article in this
issue. The date range used here is 12/19/2013 to 12/03/2014.
Figure 12 shows the five user-adjustable control values for the decycler and
oscillator computations.
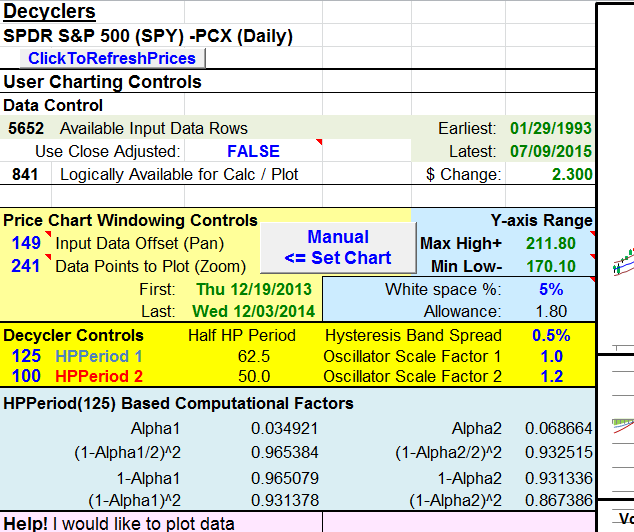
FIGURE 12: EXCEL, USER CONTROLS. This shows the user
controls: decycler periods, scale factors, and band spread.
In Ehlers’ article sidebar, he presents formulas for the high-pass filter
and oscillator. In the formulas, there are eight computational factors that
remain constant once the high-pass period has been selected. I chose to compute
these once and use the results in the indicator cell formulas. This approach
saves computational time and physical space in memory and on disk.
Figure 13 shows the corresponding constants for the second oscillator computations.
These can be found to the right of the charts.
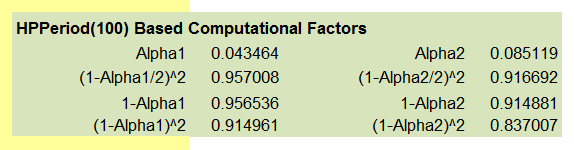
FIGURE 13: EXCEL, COMPUTATIONS. This shows the “constants” for
the second oscillator computations.
The spreadsheet file for this Traders’ Tip can be downloaded here.
To successfully download it, follow these steps:
- Right-click on the Excel
file link, then
- Select “save as” (or “save target as”) to place
a copy of the spreadsheet file on your hard drive.
—Ron McAllister
Excel and VBA programmer
rpmac_xltt@sprynet.com
BACK TO LIST
Originally published in the September 2015 issue of
Technical Analysis of STOCKS & COMMODITIES magazine.
All rights reserved. © Copyright 2015, Technical Analysis, Inc.