TRADERS’ TIPS
October 2015

For this month’s Traders’ Tips, the focus is Vitali Apirine’s
article in this issue, “The Money Flow Oscillator.” Here, we
present the October 2015 Traders’ Tips code with possible implementations
in various software.
The Traders’ Tips section is provided to help the reader implement
a selected technique from an article in this issue or another recent issue.
The entries here are contributed by software developers or programmers for
software that is capable of customization.

TRADESTATION: OCTOBER 2015
In the article “The Money Flow Oscillator” in this issue, author Vitali Apirine
presents a new indicator he developed as an alternative to existing methods
for measuring buying and selling pressure. He describes this new money flow
oscillator (MFO) as measuring the amount of money flow volume over a specific
lookback period. A move into positive territory indicates buying pressure while
a move into negative territory indicates selling pressure.
We are providing TradeStation EasyLanguage code for the MFO based on the article.
In addition, we are providing the code for a TradeStation function to calculate
the MFO and a strategy that demonstrates the function’s usage.
Indicator: _MFO
inputs:
	Length( 20 ) ;

variables:
	Dvs( 0 ),
	MLTP( 0 ),
	MyVol( 0 ),
	Dvsv( 0 ),
	MFV( 0 ),
	MFO( 0 );

Dvs = ( High - Low[1] ) + ( High[1] - Low ) ;
if Dvs <> 0 then
	MLTP = Round(( ( High - Low[1] )
	- ( High[1] - Low ) ) / Dvs,2) ;

MyVol = iff( BarType >= 2 and
	BarType < 5, Volume, Ticks ) ;
Dvsv = iff ( MyVol <> 0, MyVol, 0 ) ;

MFV = ( MLTP * MyVol ) ;

MFO = Summation( MFV, Length ) /
	Summation( Dvsv, Length ) ;

Plot1( MFO, "MFO" ) ;
Plot2( 0, "ZL" ) ;


Function: _MFO

inputs:
	Length( NumericSimple ) ;

variables:
	Dvs( 0 ),
	MLTP( 0 ),
	MyVol( 0 ),
	Dvsv( 0 ),
	MFV( 0 ) ;

Dvs = ( High - Low[1] ) + ( High[1] - Low ) ;
if Dvs <> 0 then
	MLTP = Round(( ( High - Low[1] )
	- ( High[1] - Low ) ) / Dvs,2) ;

MyVol = iff( BarType >= 2 and
	BarType < 5, Volume, Ticks ) ;
Dvsv = iff ( MyVol <> 0, MyVol, 0 ) ;

MFV = ( MLTP * MyVol ) ;

_MFO = Summation( MFV, Length ) /
	Summation( Dvsv, Length ) ;


Strategy: _MFO

inputs:
	Length( 20 ),
	ConfirmBars( 2 ) ;

variables:
	UpCounter( 0 ),
	DnCounter( 0 ),
	MFOValue( 0 ) ;

MFOValue = _MFO( Length ) ;

if MFOValue > 0 then
	begin
	UpCounter += 1 ;
	DnCounter = 0 ;
	end
else
	begin
	UpCounter = 0 ;
	DnCounter += 1 ;
	end ;

if UpCounter >= ConfirmBars then
	Buy ( "MOF LE" ) next bar at Market
else if	DnCounter >= ConfirmBars then
	SellShort ( "MOF SE" ) next bar at Market ;
To download the EasyLanguage code, please visit our TradeStation and EasyLanguage
support forum. The code for this article can be found at https://www.tradestation.com/TASC-2015.
The ELD filename is “TASC_OCT2015.ELD.”
For more information about EasyLanguage in general, please see https://www.tradestation.com/EL-FAQ.
A sample chart is shown in Figure 1.

FIGURE 1: TRADESTATION. In this example, the indicator
and strategy based on the money flow oscillator are applied to a daily chart
of Goldman Sachs (GS).
This article is for informational purposes. No type of trading or investment
recommendation, advice, or strategy is being made, given, or in any manner
provided by TradeStation Securities or its affiliates.
—Doug McCrary
TradeStation Securities, Inc.
www.TradeStation.com
BACK TO LIST

eSIGNAL:
OCTOBER 2015
For this month’s Traders’ Tip, we’ve provided the study MFO.efs based on the
formula described in Vitali Apirine’s article in this issue, “The Money Flow
Oscillator.” The author presents a study that measures buying and selling pressure.
The study contains formula parameters that may be configured through the edit
chart window (right-click on the chart and select “edit chart”). A sample chart
is shown in Figure 2.
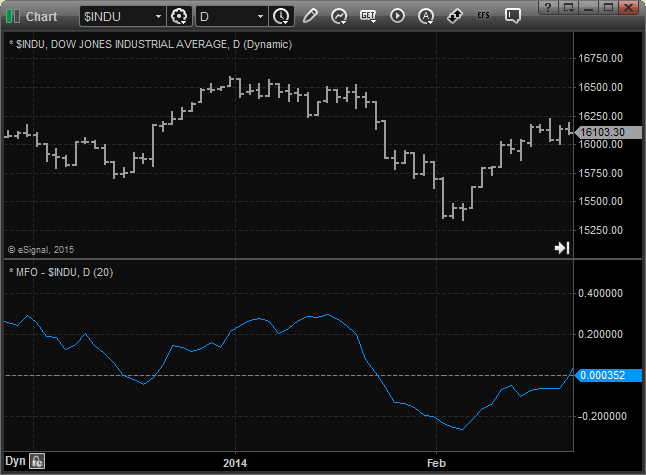
FIGURE 2: eSIGNAL. Here is an example of the study plotted on a daily chart of AAPL.
To discuss this study or download a complete copy of the formula code, please
visit the EFS Library Discussion Board forum under the forums link
from the support menu at www.esignal.com or
visit our EFS KnowledgeBase at https://www.esignal.com/support/kb/efs/.
—Eric Lippert
eSignal, an Interactive Data company
800 779-6555, www.eSignal.com
BACK TO LIST

THINKORSWIM: OCTOBER 2015
In his article in this issue, “The Money Flow Oscillator,” Vitali Apirine
discusses general indicators that measure buying and selling pressure and uses
these same ideas to go in depth on his money flow oscillator (MFO). We have
built a study for use in thinkorswim based on his ideas using our proprietary
scripting language, thinkscript. We have made the loading process easy—simply
click on the link https://tos.mx/e25ZJl and
choose save script to thinkorswim, then choose to rename your study as “MoneyFlowOscillator.”
You can adjust the parameters within the edit studies window to fine-tune your
variables.

FIGURE 3: THINKORSWIM. In this example, the MoneyFlowOscillator
(MFO) is displayed below a chart of the Dow Jones Industrial Average from
2002.
In the example shown in Figure 3, you see the MoneyFlowOscillator below a
chart of the Dow Jones Industrial Average (DJIA) from 2002. You can see that
as the MFO moves below the zero line, the DJIA price moves down drastically.
—thinkorswim
A division of TD Ameritrade, Inc.
www.thinkorswim.com
BACK TO LIST

WEALTH-LAB: OCTOBER 2015
The money flow oscillator (MFO) introduced by Vitali Apirine in his article
in this issue, “The Money Flow Oscillator,” measures buying and selling pressure
over a specific lookback. Bullish divergence indicates less selling pressure,
and bearish divergence indicates less buying pressure. Signals can be generated
by looking for divergences of MFO with price and centerline crossovers. For
our example code, we will combine both ideas into a countertrend long-only
trading system.
To identify divergences between price and oscillator, we’ll be applying a
straightforward approach. A divergence is detected when the SRSI indicator
fails to confirm a price extreme, that is, the highest high of 20 days for
bearish divergence or the 20-day lowest low for bullish divergence. This technique
improves divergence detection time, practically reducing delay to a minimum
compared to finding retracements from recent peaks or troughs.
System rules
- Once a bullish divergence is detected, enter long next
bar at open if MFO is below its centerline
- Exit long next bar at open when MFO crosses above the
centerline.
Trades from the short side are deliberately not taken, as their performance
seems poor.
After updating the TASCIndicators library to v2015.09 or later, the MoneyFlowOscillator
indicator can be found under the TASC Magazine Indicators group. You can plot
it on a chart or use it as an entry or exit condition in a rule-based strategy
without having to program any code yourself.
using System;
using System.Collections.Generic;
using System.Text;
using System.Drawing;
using WealthLab;
using WealthLab.Indicators;
using TASCIndicators;

namespace WealthLab.Strategies
{
	/*
		MFO divergence:
		Price sets a lowest low but the indicator fails to confirm the new low and turns up
	*/

	public class MFO_Divergence : WealthScript
	{
		private StrategyParameter paramHighest;
		private StrategyParameter paramPeriod;

		public MFO_Divergence()
		{
			paramPeriod = CreateParameter("MFO period", 20, 2, 100, 1);
			paramHighest = CreateParameter("Highest high of", 20, 5, 50, 1);
		}

		protected override void Execute()
		{
			bool peak = false; int peakBar = -1;
			int high = paramHighest.ValueInt;
			bool trough = false; int troughBar = -1;
			int low = paramHighest.ValueInt;
			int period = paramPeriod.ValueInt;

			MoneyFlowOscillator mfo = MoneyFlowOscillator.Series( Bars, period );
			Lowest indicatorLowest = Lowest.Series( mfo, low );
			Lowest hLow = Lowest.Series( Low, low );

			HideVolume(); LineStyle solid = LineStyle.Solid;
			ChartPane mfoPane = CreatePane( 50, false, true );
			PlotSeries( mfoPane, mfo, Color.Green, solid, 2 );
			DrawHorzLine( mfoPane,0,Color.Blue,LineStyle.Dashed,1);

			for(int bar = GetTradingLoopStartBar(period); bar < Bars.Count; bar++)
			{
				if (!IsLastPositionActive)
				{
					/* 1st peak: both price and indicator */

					if( peak == false )
					{
						if( ( High[bar-1] == Highest.Series( High, high )[bar-1] )
							& ( mfo[bar-1] == Highest.Series( mfo, high )[bar-1] )
							& TurnDown( bar, High ) & TurnDown( bar, mfo ) )
						{
							peak = true; peakBar = bar-1;
						}
					}

					if( peak == true )
					{
						if( ( High[bar] != Highest.Series( High, high )[bar] )
							& ( mfo[bar] == Highest.Series( mfo, high )[bar] ) )
							peak = false;
					}

					/* 2nd peak: price high not confirmed by the indicator */

					if( peak == true )
					{
						if( ( High[bar-1] == Highest.Series( High, high )[bar-1] )
							& ( High[bar-1] >= High[peakBar] )
							& ( mfo[bar-1] != Highest.Series( mfo, high )[bar-1] )
							& ( mfo[bar-1] < mfo[peakBar] ) &
							TurnDown( bar, High ) & TurnDown( bar, mfo ) )
						{
							peak = false;

							/* Shorting doesn't work well */

							// Fade the trend

//							if( mfo[bar] > 0 )
//								if( ShortAtMarket( bar+1 ) != null )
//									LastPosition.Priority = Close[bar];

							/* Highlight divergence */

							for (int b = peakBar; b <= bar; b++)
								SetPaneBackgroundColor( mfoPane, b, Color.FromArgb( 30, Color.LightCoral ) );

							DrawLine( PricePane, peakBar, High[peakBar], bar-1, High[bar-1], Color.Red, solid, 2 );
							DrawLine( mfoPane, peakBar, mfo[peakBar], bar-1, mfo[bar-1], Color.Blue, solid, 2 );
						}
					}

					/* 1st trough: both price and indicator */

					if( trough == false )
					{
						if( ( Low[bar-1] == Lowest.Series( Low, low )[bar-1] )
							& ( mfo[bar-1] == Lowest.Series( mfo, low )[bar-1] )
							& TurnUp( bar, Low ) & TurnUp( bar, mfo ) )
						{
							trough = true; troughBar = bar-1;
						}
					}

					if( trough == true )
					{
						if( ( Low[bar] != Lowest.Series( Low, low )[bar] )
							& ( mfo[bar] == Lowest.Series( mfo, low )[bar] ) )
							trough = false;
					}

					/* 2nd trough: price low not confirmed by the indicator */

					if( trough == true )
					{
						if( ( Low[bar-1] == Lowest.Series( Low, low )[bar-1] )
							& ( Low[bar-1] <= Low[troughBar] )
							& ( mfo[bar-1] != Lowest.Series( mfo, low )[bar-1] )
							& ( mfo[bar-1] > mfo[troughBar] ) &
							TurnUp( bar, Low ) & TurnUp( bar, mfo ) )
						{
							trough = false;

							/* Fade the trend */

							if( mfo[bar] < 0 )
								if( BuyAtMarket( bar+1 ) != null )
									LastPosition.Priority = -Close[bar];

							/* Highlight divergence */

							for (int b = troughBar; b <= bar; b++)
								SetPaneBackgroundColor( mfoPane, b,
									Color.FromArgb( 30, Color.LightGreen ) );

							DrawLine( PricePane, troughBar, Low[troughBar],
								bar-1, Low[bar-1], Color.Blue, solid, 2 );
							DrawLine( mfoPane, troughBar, mfo[troughBar],
								bar-1, mfo[bar-1], Color.Red, solid, 2 );
						}
					}
				} else
				{
					Position p = LastPosition;

					if( p.PositionType == PositionType.Long )
					{
						if( CrossOver(bar, mfo, 0) )
							ExitAtMarket( bar+1, p, "MFO Crossover" );
					}
					else
						if( CrossUnder(bar, mfo, 0) )
							ExitAtMarket( bar+1, p, "MFO Crossunder" );
				}
			}
		}
	}
}
A sample chart is shown in Figure 4.

FIGURE 4: WEALTH-LAB. The bullish divergence between
the MFO and price that formed in June 2015 triggered a long trade in KO (Coca
Cola).
—Eugene, Wealth-Lab team
MS123, LLC
www.wealth-lab.com
BACK TO LIST

AMIBROKER: OCTOBER 2015
In “The Money Flow Oscillator” in this issue, author Vitali Apirine presents
his money flow oscillator. A ready-to-use formula for AmiBroker based on the
article is shown here. To use the oscillator, enter the code into the formula
editor and press apply indicator. You can adjust the smoothing period
using the parameters window.
// Money Flow Oscillator
LL = Low;
HH = High;

PL = Ref( LL, -1 );
PH = Ref( HH, -1 );

Dvs = ( HH - PL ) + ( PH - LL ) + 1e-10;

MLTP = IIf( HH < PL, -1,
       IIf( LL > PH,  1,
          ( ( HH - PL ) - ( PH - LL ) ) / dvs ) );

Dvsv = IIf( V == 0, 1e-10, V );

Periods = Param("Periods", 20, 1, 100 );

MFO = Sum( MLTP * V, Periods ) / Sum( Dvsv, Periods );

Plot( MFO, "MFO" + _PARAM_VALUES(), colorRed, styleThick );
Plot( 0, "", colorBlue );
A sample chart is shown in Figure 5.
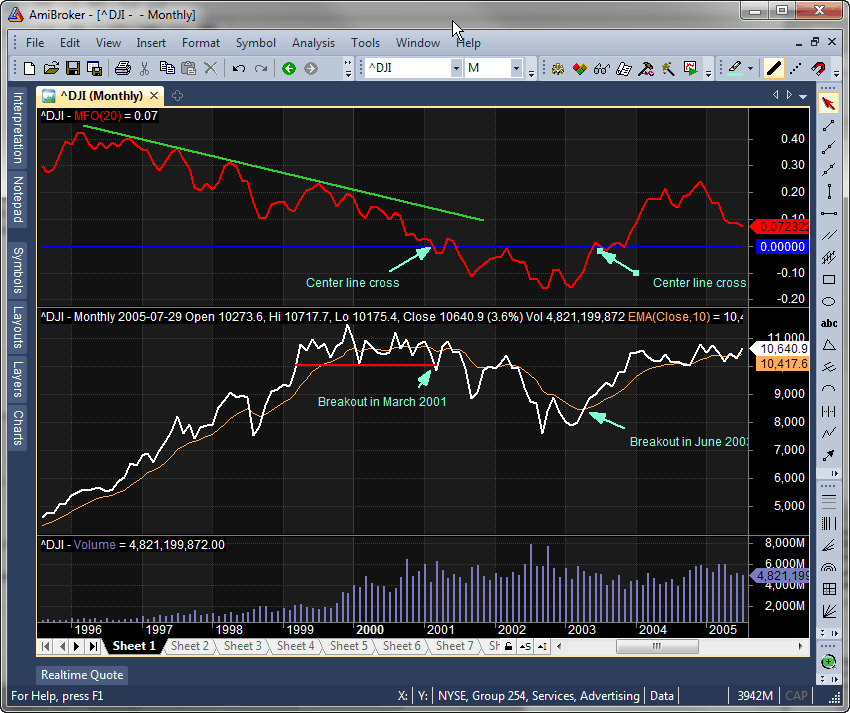
FIGURE 5: AMIBROKER. Here is a monthly price chart of
the Dow Jones Industrial Average (DJIA) with a 10-bar exponential moving
average (middle pane) and a 20-bar money flow oscillator (upper pane), replicating
the chart from Apirine’s article in this issue.
—Tomasz Janeczko, AmiBroker.com
www.amibroker.com
BACK TO LIST

NEUROSHELL TRADER: OCTOBER 2015
The money flow oscillator described by Vitali Apirine in his article in this
issue can be easily implemented in NeuroShell Trader with a few of NeuroShell
Trader’s 800+ built-in indicators. Simply select new indicator from
the insert menu and use the indicator wizard to set up the following
indicators:
HL1:	Subtract( High, Lag(Low,1) )
HL2:	Subtract( Lag(High,1), Low )
OSC:	Divide( Subtract(HL1,HL2), Add2(HL1,HL2) )
MLTP:	IfThenElse( A<B(High,Lag(Low,1) ), -1, A<B(Lag(High,1),Low), 1, OSC )
MFO:	Divide( Sum( Multiply2( MLTP, Volume ), 20), Sum( Volume, 20 ) )
Users of NeuroShell Trader can go to the STOCKS & COMMODITIES section
of the NeuroShell Trader free technical support website to download a copy
of this or any previous Traders’ Tips.
A sample chart is shown in Figure 6.

FIGURE 6: NEUROSHELL TRADER. This NeuroShell Trader chart
displays the money flow oscillator on the DJIA.
—Marge Sherald, Ward Systems Group, Inc.
301 662-7950, sales@wardsystems.com
www.neuroshell.com
BACK TO LIST

AIQ: OCTOBER 2015
The AIQ code I am providing here is based on Vitali Apirine’s article in this
issue, “The Money Flow Oscillator.”
This code displays an indicator based on Apirine’s money flow oscillator (MFO),
an example of which is shown in Figure 7.

FIGURE 7: AIQ. Here is an example of the MFO(20) indicator
on a chart of SFUN.
The code and EDS file can be downloaded from www.TradersEdgeSystems.com/traderstips.htm
and is also shown here:
!THE MONEY FLOW OSCILLATOR
!Author: Vitali Aprine, TASC October 2015
!Coded by: Richard Denning, 8/11/15
!www.TradersEdgeSystems.com

!INPUTS:
MFOlen is 20.
H is [high].
H1 is valresult(H,1).
L is [low].
L1 is valresult([low],1).
V is [volume].

!INDICATOR CODE:
MFmult is ((H-L1)-(H1-L))/((H-L1)+(H1-L)).
MFvol is MFmult*V.
MFO is sum(MFvol,MFOlen)/sum(V,MFOlen)*100. !PLOT
—Richard Denning
info@TradersEdgeSystems.com
for AIQ Systems
BACK TO LIST

TRADERSSTUDIO: OCTOBER 2015
The TradersStudio code based on Vitali Apirine’s article in this issue, “The
Money Flow Oscillator,” can be found at www.TradersEdgeSystems.com/traderstips.htm.
The following code files are provided in the download:
- Function MFO: Computes the MFO values
- Indicator plot MFO_IND: For plotting the MFO indicator on a chart.

FIGURE 8: TRADERSSTUDIO. On this sample chart, the MFO indicator is plotted on a chart of S&P 500 futures contract (SP).
Figure 8 shows the MFO indicator on a chart of the S&P 500 futures contract
(SP) using data from Pinnacle Data Corp.
The TradersStudio code is also shown here:
'THE MONEY FLOW OSCILLATOR
'Author: Vitali Aprine, TASC October 2015
'Coded by: Richard Denning, 8/11/15
'wwwTradersEdgeSystemscom

'FUNCTION TO COMPUTE MFO VALUES:
Function MFO(MFOlen)
'default: MFOlen = 20

Dim MFmult, MFOdenom
Dim MFsum As BarArray
Dim MFvol As BarArray

'INDICATOR CODE:
MFOdenom = ((H-L[1])+(H[1]-L))
If MFOdenom = 0 Then
    MFOdenom = 0.0000001
End If
MFmult = ((H-L[1])-(H[1]-L))/MFOdenom
MFvol = MFmult*V
MFsum = summation(V,MFOlen)
If MFsum = 0 Then
    MFsum = 0.000001
End If
MFO = Summation(MFvol,MFOlen)/MFsum*100
End Function
'-------------------------------------------
'INDICATOR CODE TO PLOT MFO INDICATOR:
sub MFO_IND(MFOlen)
plot1(MFO(MFOlen))
plot2(0)
end sub
'-------------------------------------------
—Richard Denning
info@TradersEdgeSystems.com
for TradersStudio
BACK TO LIST

NINJATRADER: OCTOBER 2015
The money flow oscillator presented by Vitali Apirine in his article in this issue by the same name has been made available for download at www.ninjatrader.com/SC/October2015SC.zip.
Once you have it downloaded, from within the NinjaTrader Control Center window, select the menu File → Utilities → Import NinjaScript and select the downloaded file. This file is for NinjaTrader version 7.
You can review the indicator’s source code by selecting the menu Tools → Edit NinjaScript → Indicator from within the NinjaTrader Control Center window and selecting the MFO file.
A sample chart displaying the indicator is shown in Figure 9.
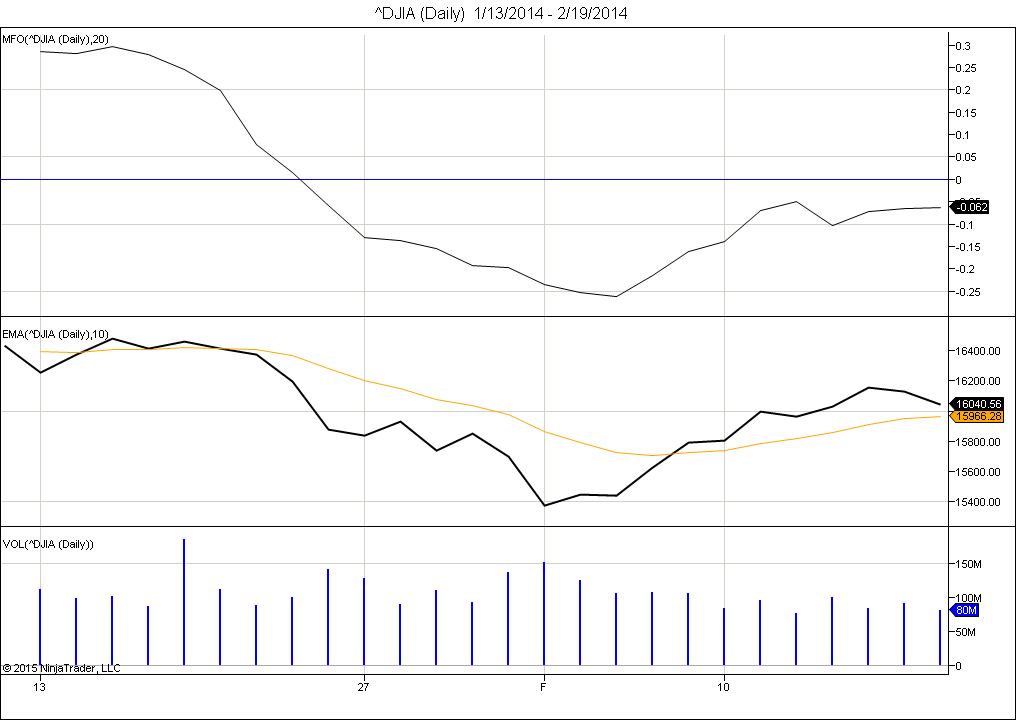
FIGURE 9: NINJATRADER. The MFO is displayed on a chart of the DJIA along with volume and a 10-period EMA.
—Raymond Deux & Michael Maloney
NinjaTrader, LLC
www.ninjatrader.com
BACK TO LIST

UPDATA: OCTOBER 2015
Our Traders’ Tip for this month is based on the article by Vitali Apirine in this issue, “The Money Flow Oscillator.”
In his article, the author develops an oscillator that signals changes in buying or selling pressure for an instrument. He develops ratios between current and previous, high, and low prices, and then sums the volume over a predefined lookback period to produce an oscillator that is positive when buying pressure is detected and negative when selling pressure is detected.
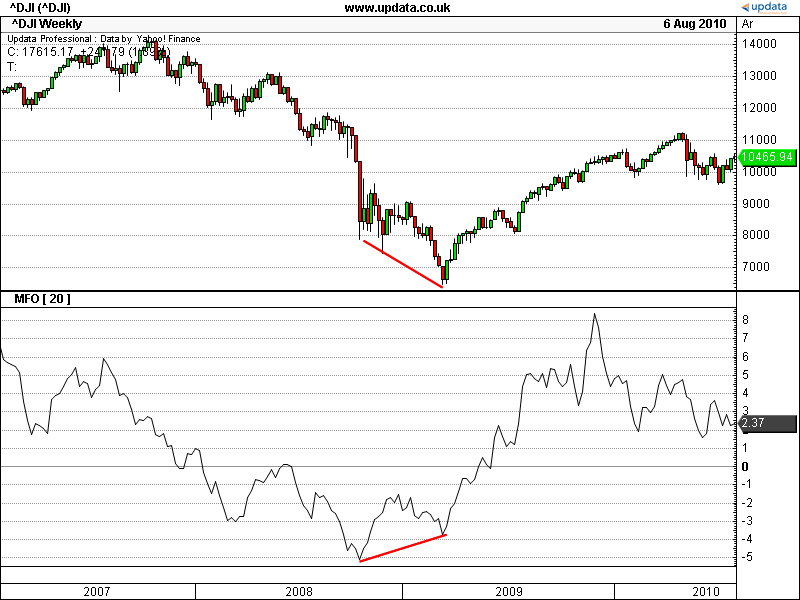
FIGURE 10: UPDATA. Here, the money flow oscillator [20] is applied to the Dow Jones Industrial Average of daily resolution.
The Updata code for this article has been added to the Updata library and may be downloaded by clicking the custom menu and then indicator library. Those who cannot access the library due to a firewall may paste the code shown here into the Updata custom editor and save it.
'MFO
PARAMETER "Period" #PERIOD=20
NAME "MFO [" #PERIOD "]" ""
@MULT=0
@SUMVOL=0
@MFV=0
@MFO=0
FOR #CURDATE=#PERIOD TO #LASTDATE
   @MULT=((HIGH-LOW(1))-(HIGH(1)-LOW)) /((HIGH-LOW(1))+(HIGH(1)-LOW))
   @SUMVOL=SGNL(VOL,#PERIOD,M)*#PERIOD
   @MFV=@MULT*@SUMVOL
   @MFO=SGNL(@MFV,#PERIOD,M)*#PERIOD/@SUMVOL
   @PLOT=@MFO
NEXT
—Updata support team
support@updata.co.uk
www.updata.co.uk
BACK TO LIST

TRADE NAVIGATOR: OCTOBER 2015
We have prepared a custom file to make it easy to download into Trade Navigator the indicator library based on “The Money Flow Oscillator” by Vitali Apirine in this issue. The file name is “SC201510.”
Please click on Trade Navigator’s blue telephone button, select download special file, then erase the word “upgrade” and type in “SC201508” (without the quotes), and click the start button. When prompted to upgrade, click the yes button. If prompted to close all software, click on the continue button. Your library will now download. This library contains an indicator named “MFO.” This indicator can be inserted into your chart by opening the charting dropdown menu, then selecting the add to chart command, then selecting the indicators tab. This library also contains a template called “S&C Money Flow Oscillator.” This prebuilt template can be overlaid onto your chart by opening the charting dropdown menu, then selecting the templates command, then selecting the template.
The TradeSense language for the indicator is as follows:
&dvs := IFF ((High - Low.1) + (High.1 - Low) = 0 , 0.00001 , (High - Low.1) + (High.1 - Low))
&mltp := IFF (High < Low.1 , (-1) , IFF (Low > High.1 , 1 , ((High - Low.1) - (High.1 - Low)) / &dvs))
&dvsv := IFF (Volume = 0 , 0.00001 , Volume)
MovingSum ((&mltp * Volume) , 20 , 0) / MovingSum (&dvsv , 20 , 0)
To recreate this indicator manually, click on the edit dropdown menu and open the trader’s toolbox (or use CTRL+T) and click on the functions tab. Now click on the new button, and a new function dialogue window will open. In its text box, type in the code for the highlight bar. Ensure there are no extra spaces at the end of each line. When completed, click on the verify button. You may be presented with an add inputs popup message if there are variables in the code. If so, click the yes button, then enter a value in the default value column. If all is well, when you click on the function tab, the code you entered will convert to italic font. Now click the save button and type a name for the indicator.
Once this is completed, you can insert this indicator into your chart (Figure 11) by opening the charting dropdown menu, selecting the add to chart command, then on the indicators tab. Find your named indicator, select it, then click on the add button. Repeat this procedure for the other indicators as well if you wish.
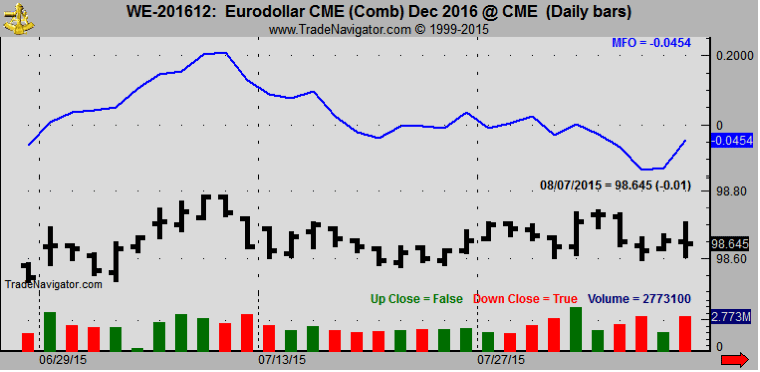
FIGURE 11: TRADENAVIGATOR. The MFO is shown on a chart of the eurodollar.
If you have any difficulties, call our technical support staff at (719) 884-0245 or click on the live chat tool located under Trade Navigator’s help menu or near the top of our homepage.
—Customer service
Genesis Financial Technologies
www.TradeNavigator.com, 719 884-0245
BACK TO LIST
MICROSOFT EXCEL: OCTOBER 2015
The money flow oscillator that Vitali Apirine introduces in his article in this issue of the same name seems simple to calculate, less sensitive to price gaps, and seems to be able to keep you in trending markets. Certainly qualities I like to have in my indicator toolbox.

FIGURE 12: EXCEL. Here is an Excel-produced composite chart that approximates Figure 3 from Vitali Apirine’s article in this issue (using a date range of 4/19/2010 to 4/1/2011).
Figure 12 shows an Excel-produced composite that approximates Figure 3 from Apirine’s article in this issue (using a date range of 4/19/2010 to 4/1/2011). Similarly, Figure 13 approximates Figure 5 from Apirine’s article in this issue (using a date range of 6/24/2013 to 2/6/2014).

FIGURE 13 EXCEL. Here is an Excel-produced composite chart that approximates Figure 5 from Apirine’s article in this issue (using a date range of 6/24/2013 to 2/6/2014).
The spreadsheet file for this Traders’ Tip can be downloaded here. To successfully download it, follow these steps:
—Ron McAllister
Excel and VBA programmer
rpmac_xltt@sprynet.com
BACK TO LIST
Originally published in the October 2015 issue of
Technical Analysis of STOCKS & COMMODITIES magazine.
All rights reserved. © Copyright 2015, Technical Analysis, Inc.


