TRADERS’ TIPS
November 2015

For this month’s Traders’ Tips, the focus is Vitali Apirine’s
article in this issue, “Average Percentage True Range.” Code for MetaStock is already provided in Apirine’s article in this issue. Here,
we present the November 2015 Traders’ Tips code with possible implementations
in various software.
The Traders’ Tips section is provided to help the reader implement
a selected technique from an article in this issue or another recent issue.
The entries here are contributed by software developers or programmers for
software that is capable of customization.

eSIGNAL:
NOVEMBER 2015
For this month’s Traders’ Tip, we’ve provided a study named APTR.efs based
on the formula described in Vitali Apirine’s article in this issue, “Average
Percentage True Range.” In the article, Apirine presents a study that displays
the average true range (ATR) as a percentage instead of as points as in J.
Welles Wilder Jr.’s original ATR study.
The eSignal study contains formula parameters that may be configured through
the edit chart window (right-click on the chart and select “edit chart”).
A sample chart is shown in Figure 1.

FIGURE 1: eSIGNAL. Here is an example of the study plotted on a daily chart of $RUT along with the classic ATR for comparison.
To discuss this study or download a complete copy of the formula code, please
visit the EFS Library Discussion Board forum under the forums link
from the support menu at www.esignal.com or
visit our EFS KnowledgeBase at https://www.esignal.com/support/kb/efs/.
The eSignal formula script (EFS) is also available as a downloadable file here.
/*********************************
Provided By:
    Interactive Data Corporation (Copyright В© 2015)
    All rights reserved. This sample eSignal Formula Script (EFS)
    is for educational purposes only. Interactive Data Corporation
    reserves the right to modify and overwrite this EFS file with
    each new release.

Description:
    Average Percentage True Range by Vitali Apirine

Formula Parameters:                     Default:
Length                                  14

Version:            1.00  09/09/2015

Notes:
    The related article is copyrighted material. If you are not a subscriber
    of Stocks & Commodities, please visit www.traders.com.

**********************************/

var fpArray = new Array();

function preMain(){

    setStudyTitle("APTR");

    setCursorLabelName("APTR", 0);

    var x = 0;

    fpArray[x] = new FunctionParameter("fpLength", FunctionParameter.NUMBER);
    with(fpArray[x++]){
        setName("Length");
        setLowerLimit(1);
        setDefault(14);
    }
}

var bInit = false;
var bVersion = null;

var xATRS = null;
var xAPTR = null;

function main(fpLength){

    if (bVersion == null) bVersion = verify();
    if (bVersion == false) return;

    if (!bInit){

        xATRS = efsInternal('Calc_ATRS');
        xAPTR = smma(fpLength, xATRS);

        bInit = true;
    };

    nAPTR = xAPTR.getValue(0);

    if (nAPTR == null)
        return;

    return [nAPTR * 100];
}

var xHigh = null;
var xLow = null;
var xClose = null;

function Calc_ATRS(){

    if (getBarState() == BARSTATE_ALLBARS){
        xHigh = high();
        xLow = low();
        xClose = close();
    }

    var nHigh = xHigh.getValue(0);
    var nLow = xLow.getValue(0);
    var nPrevClose = xClose.getValue(-1);

    if (nHigh == null || nLow == null || nPrevClose == null)
        return;

    var nHL = nHigh - nLow;
    var nHC = Math.abs(nHigh - nPrevClose);
    var nLC = Math.abs(nLow - nPrevClose);

    var nMax = Math.max(nHL, nHC, nLC);

    if (nMax == nHC) {
        nMid = nPrevClose + nMax / 2;
    }

    if (nMax == nLC || nMax == nHL){
        nMid = nLow + nMax / 2;
    }

    nATRS = nMax / nMid;

    return [nATRS];
}

function verify(){
    var b = false;
    if (getBuildNumber() < 3742){

        drawTextAbsolute(5, 35, "This study requires version 12.1 or later.",
            Color.white, Color.blue, Text.RELATIVETOBOTTOM|Text.RELATIVETOLEFT|Text.BOLD|Text.LEFT,
            null, 13, "error");
        drawTextAbsolute(5, 20, "Click HERE to upgrade.@URL=https://www.esignal.com/download/default.asp",
            Color.white, Color.blue, Text.RELATIVETOBOTTOM|Text.RELATIVETOLEFT|Text.BOLD|Text.LEFT,
            null, 13, "upgrade");
        return b;
    }
    else
        b = true;

    return b;
}
—Eric Lippert
eSignal, an Interactive Data company
800 779-6555, www.eSignal.com
BACK TO LIST

THINKORSWIM: NOVEMBER 2015
In his article in this issue, “Average Percentage True Range,” author Vitali
Apirine discusses how to improve the legacy indicator average true range originally
developed by J. Welles Wilder Jr. We have recreated Apirine’s average percentage
true range using our proprietary scripting language, thinkscript.
We have made the loading process extremely easy; simply click on the link https://tos.mx/wq5ymQ and
choose save script to thinkorswim, then choose to rename your study
“ATRP.” You can adjust the parameters of this study within the edit studies window
to fine-tune your variables.

FIGURE 2: THINKORSWIM. In this example chart, you see
the new ATRP study as well as the legacy ATR study below the chart of the
Russell 2000 index.
In the example chart shown in Figure 2, you see the new ATRP study as well
as the legacy ATR study below the chart of the Russell 2000 index. We have
drawn the purple regression line to display that the ATRP actually has a different
value while the shape is very similar to that of the traditional ATR. Please
see Apirine’s article in this issue for more on this indicator.
—thinkorswim
A division of TD Ameritrade, Inc.
www.thinkorswim.com
BACK TO LIST

WEALTH-LAB: NOVEMBER 2015
In this issue’s article “Average Percentage True Range,” author Vitali Apirine
presents a normalization of the classic average true range (ATR) indicator.
For obvious reasons, the original ATR indicator should not be used for making
comparisons across different markets. Others have also recognized the problem
in using absolute price values by the ATR before; for example, see the May
2006 article by John Forman in the STOCKS & COMMODITIES archive, “Cross-Market
Evaluations With Normalized Average True Range” and the accompanying Wealth-Lab
Traders’ Tip in that issue (https://technical.traders.com/content/backissuearchive.asp),
and see “Normalized
Volatility Indicator” by Rajesh Kayakkal in the August 2010 issue and the
accompanying Wealth-Lab Traders’ Tip in that issue.
As a solution to the problem of using absolute price values, Wealth-Lab has
been including a version of a normalized ATR indicator called “ATRP” (ATR percentage).
It’s simply an ATR multiplied by 100 and divided by the close price. We have
coded the APTR and compared it visually to Apirine’s ATRP. As can be seen on
the chart in Figure 3, while the two are not exactly equal, they are substantially
close in their readings and dynamics.
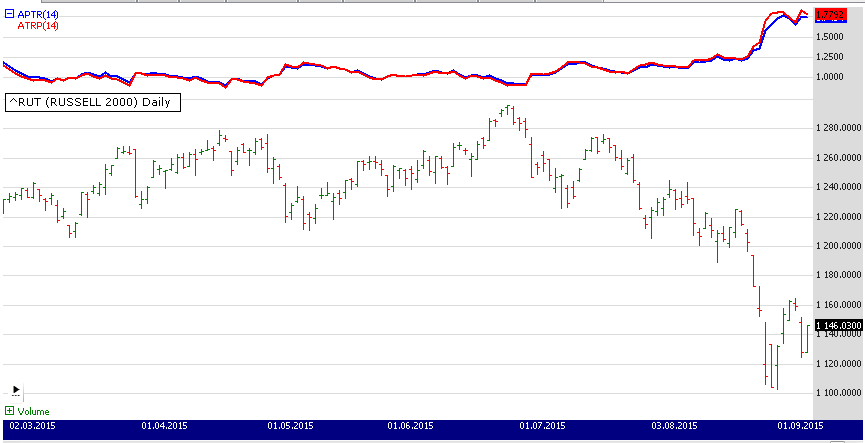
FIGURE 3: WEALTH-LAB. For the most part, both indicators’
curves were inseparable during 2015. This sample chart shows the ATRP and
APTR on the Russell 2000 index (^RUT daily data).
Usually, they reach extremes at about the same date; however, sometimes the
red line (Wealth-Lab’s ATRP) gets more responsive than the blue line (APTR).
On such occasions, ATRP leads APTR for a short period. For example, Figure
4 compares the two indicators during the recent “Black Monday” phase on August
24, 2015.
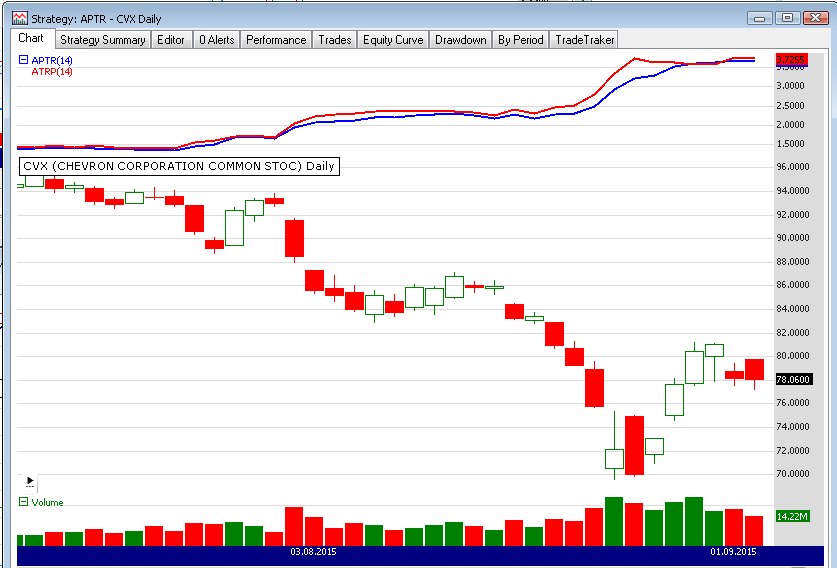
FIGURE 4 WEALTH-LAB. When volatility rapidly increases,
ATRP becomes slightly more reactive than APTR, as shown here on a daily chart
of Chevron (CVX).
After updating the TASCIndicators library to version 2015.10 or later, the
APTR indicator can be found under the “TASC Magazine Indicators” group. You
can plot it on a chart or use it as an entry or exit condition in a rule-based
strategy without having to program a line of code yourself.
In conclusion, APTR is very similar to ATRP and can be used to measure volatility
across different markets.
Wealth-Lab 6 strategy code (C#):


using System;
using System.Collections.Generic;
using System.Text;
using System.Drawing;
using WealthLab;
using WealthLab.Indicators;
using TASCIndicators;

namespace WealthLab.Strategies
{
	public class MyStrategy : WealthScript
	{
		protected override void Execute()
		{
			APTR aptr = APTR.Series(Bars,14);
			ATRP atrp = ATRP.Series(Bars,14);
			ChartPane aptrPane = CreatePane(30,true,true);
			PlotSeries(aptrPane, aptr, Color.Blue, LineStyle.Solid, 2);
			PlotSeries(aptrPane, atrp, Color.Red, LineStyle.Solid, 2);
		}
	}
}
—Eugene, Wealth-Lab team
MS123, LLC
www.wealth-lab.com
BACK TO LIST

AMIBROKER: NOVEMBER 2015
In “Average Percentage True Range” in this issue, author Vitali Apirine presents
the ATR indicator that is based on percentage price movement. A ready-to-use
formula for AmiBroker is shown here. To use the indicator, enter the code in
the formula editor and press the apply indicator button. You can adjust
the averaging period using the parameters window.
lh = High - Low;
pc = Ref( Close, -1 );
hc = abs( High - pc );
lc = abs( Low - pc );
MM = Max( Max( lh, hc ), lc );
atrs = IIF( MM == hc, hc / (  pc + ( hc / 2 ) ),
       IIF( MM == lc, lc / ( Low + ( lc / 2 ) ),
       IIF( MM == lh, lh / ( Low + ( lh / 2 ) ), 0 ) ) );

APTR = Wilders( atrs, Param("Period", 14, 1 ) ) * 100;

Plot( APTR, "APTR" + _PARAM_VALUES(), colorRed );
A sample chart is shown in Figure 5.
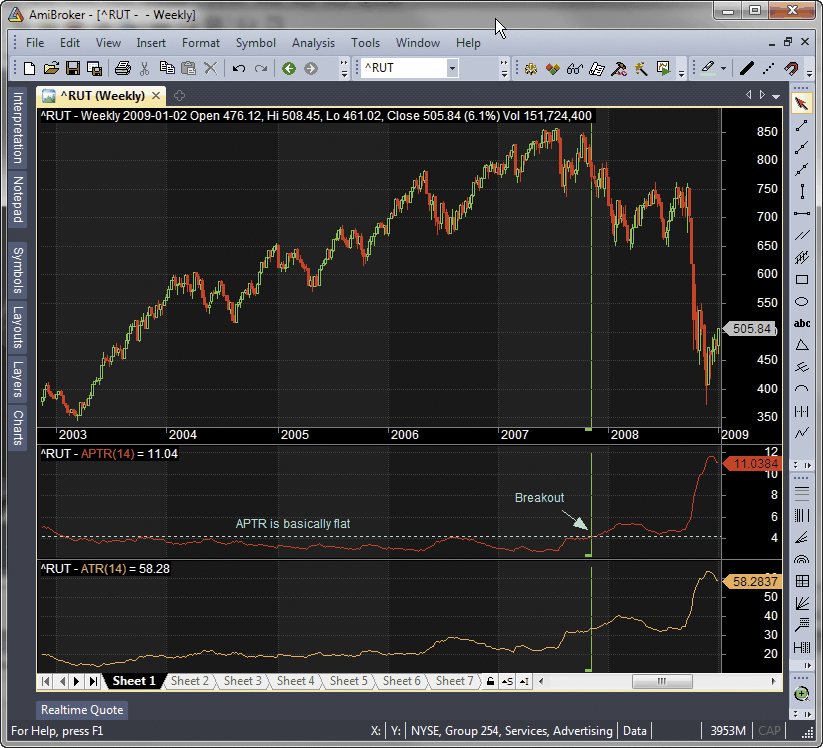
FIGURE 5: AMIBROKER. Here is a sample weekly chart of
the Russell 2000 index, with a 14-bar APTR compared to the standard ATR.
APTR gives a clearer signal of increased volatility thanks to using percentage
price movement instead of absolute prices.
This and previously published AmiBroker Traders’ Tips are available at https://www.amibroker.com/traders/.
—Tomasz Janeczko, AmiBroker.com
www.amibroker.com
BACK TO LIST

NEUROSHELL TRADER: NOVEMBER 2015
The average percent true range described by Vitali Apirine in his article
in this issue, “Average Percentage True Range,” can be easily implemented with
a few of NeuroShell Trader’s 800+ indicators. Simply select new indicator from
the insert menu and use the indicator wizard to set up the following
indicators:
HL% = Divide( Sub(High,Low), PriceMidpoint(High,Low) )
HC% = Divide( Abs(Sub(High,Lag(Close,1))), PriceMidPoint(High,Lag(Close,1),1) )
LC% = Divide( Abs(Sub(Low,Lag(Close,1))), PriceMidPoint(Low,Lag(Close,1), 1) )
APTR = Multiply2( ExpAvg(Max3(HL%,HC%,LC%), 14), 100)
Users of NeuroShell Trader can go to the Stocks & Commodities section
of the NeuroShell Trader free technical support website to download a copy
of this or any previous Traders’ Tips.
A sample chart of the APTR is shown in Figure 6.

FIGURE 6: NEUROSHELL TRADER. This NeuroShell Trader chart
displays the APTR on the Russell 2000 index.
—Marge Sherald, Ward Systems Group, Inc.
301 662-7950, sales@wardsystems.com
www.neuroshell.com
BACK TO LIST

AIQ: NOVEMBER 2015
The AIQ code based on Vitali Apirine’s article in this issue, “Average Percentage
True Range,” is provided at www.TradersEdgeSystems.com/traderstips.htm.
The code provided is used as an indicator (which I’ve called “PATR”). An example
of the PATR is shown in Figure 7 on a chart of Apple Inc. (AAPL) compared to
the same indicator on the S&P 500 index (SPX).

FIGURE 7: AIQ. Here is the percentage average true range
(PATR) on a chart of AAPL in comparison to the same indicator plotted on
the SPX index.
As mentioned, the code and EDS file can be downloaded from www.TradersEdgeSystems.com/traderstips.htm,
and is shown below.
!AVERAGE PERCENTAGE TRUE RANGE
!Author: Vitali Apirine, TASC Nov 2015
!Coded by: Richard Denning 9/7/2015
!www.TradersEdgeSystems.com

WilderLen is 14.
Index is "SPX".
H is [high].
L is [low].
C is [close].
C1 is valresult(C,1).

LH is H - L.
HC is Abs(H - C1).
LC is abs(L - C1).

M is max(LH,HC).
MM is max(M,LC).

ATR1 is iff(MM=HC,HC,0).
MID1 is iff(ATR1>0,(valresult(C,1)+(HC/2)),0.00001).

ATR2 is iff(MM=LC and ATR1=0,LC,0).
MID2 is iff(ATR2>0,(L+(LC/2)),0.00001).

ATR3 is iff(MM=LH and ATR1=0 and ATR2=0,LH,0).
MID3 is iff(ATR3>0,(L+(LH/2)),0.00001).

ATRS is iff(ATR1>0,ATR1/MID1,iff(ATR2>0,ATR2/MID2,iff(ATR3>0,ATR3/MID3,0)))*100.

ExpLen is WilderLen*2-1.
APTR is expavg(ATRS,ExpLen). !PLOT

APTRidx is TickerUDF(Index,APTR). !PLOT

ShowValues if 1.
—Richard Denning
info@TradersEdgeSystems.com
for AIQ Systems
BACK TO LIST

TRADERSSTUDIO: NOVEMBER 2015
The TradersStudio code based on Vitali Apirine’s article in this issue, “Average
Percentage True Range,” is provided at www.TradersEdgeSystems.com/traderstips.htm.
The following code files are provided in the download:
- Function APTR—Computes the average percentage true range
values
- Indicator plot APTR_IND—For plotting the APTR indicator
on a chart for the “mom” data series
- Indicator plot APTRdata1_IND—For plotting the APTR indicator
on a chart for the first “child” data series.
Figure 8 shows the APTR indicator on a chart of Apple Inc. compared to the
same indicator on the S&P 500 Index.

FIGURE 8: TRADERSSTUDIO. Here, the APTR indicator is
displayed on a chart of Apple Inc. as well as on the S&P 500 index for
comparison.
'AVERAGE PERCENTAGE TRUE RANGE
'Author: Vitali Apirine, TASC Nov 2015
'Coded by: Richard Denning 9/8/2015
'www TradersEdgeSystems com

Function APTR(WilderLen,pH As BarArray,pL As BarArray,pC As BarArray)
'WilderLen = 14
'Index = "SPX"
Dim LH As BarArray
Dim HC As BarArray
Dim LC As BarArray
Dim M As BarArray
Dim MM As BarArray
Dim ATR1 As BarArray
Dim MID1 As BarArray
Dim ATR2 As BarArray
Dim MID2 As BarArray
Dim ATR3 As BarArray
Dim MID3 As BarArray
Dim ATRS As BarArray
Dim ExpLen

LH = pH - pL
HC = Abs(pH - pC[1])
LC = Abs(pL - pC[1])

M = Max(LH,HC)
MM = Max(M,LC)

ATR1 = IFF(MM=HC,HC,0)
MID1 = IFF(ATR1>0,(pC[1]+(HC/2)),0.00001)

ATR2 = IFF(MM=LC And ATR1=0,LC,0)
MID2 = IFF(ATR2>0,(pL+(LC/2)),0.00001)

ATR3 = IFF(MM=LH And ATR1=0 And ATR2=0,LH,0)
MID3 = IFF(ATR3>0,(pL+(LH/2)),0.00001)

ATRS = IFF(ATR1>0,ATR1/MID1,IFF(ATR2>0,ATR2/MID2,IFF(ATR3>0,ATR3/MID3,0)))*100

ExpLen = WilderLen*2-1
APTR = XAverage(ATRS,ExpLen)

End Function
End Function
'-----------------------------------------------
'INDICATOR PLOT FOR THE MOM SERIES:
Sub APTR_IND(WilderLen)
plot1(APTR(WilderLen,H,L,C))
End Sub
'-----------------------------------------------
'INDICATOR PLOT FOR THE FIRST CHILD DATA SERIES:
Sub APTRdata1_IND(WilderLen)
plot1(APTR(WilderLen,H Of independent1,L Of independent1,C Of independent1))
End Sub
'-----------------------------------------------
—Richard Denning
info@TradersEdgeSystems.com
for TradersStudio
BACK TO LIST

NINJATRADER: NOVEMBER 2015
The average percentage true range (APTR) indicator, as presented
in the article by Vitali Apirine in this issue, “Average Percentage True Range,”
has now been made available for download at www.ninjatrader.com/SC/November2015SC.zip.
Once you have it downloaded, from within the NinjaTrader Control Center window,
select the menu File → Utilities → Import NinjaScript and select
the downloaded file. This file is for NinjaTrader version 7.
You can review the indicator’s source code by selecting the menu Tools → Edit
NinjaScript → Indicator from within the NinjaTrader Control Center window
and selecting the APTR file.
NinjaScript uses compiled DLLs that run native, not interpreted, to provide
the highest possible performance.
A sample chart displaying the indicator is shown in Figure 9.

FIGURE 9: NINJATRADER. Here, the average percentage true
range (APTR) is displayed with the average true range (ATR) for the ^RUT
and ^SP500 (SPX) indexes.
—Raymond Deux & Zachary Gauld
NinjaTrader, LLC
www.ninjatrader.com
BACK TO LIST

UPDATA: NOVEMBER 2015
Our Traders’ Tip for this month is based on the article in this issue by Vitali
Apirine, “Average Percentage True Range.”
In the article, Apirine modifies J. Welles Wilder’s classic average true range
calculation to use percentage price inputs instead of absolute prices in order
to compare values with other instruments.
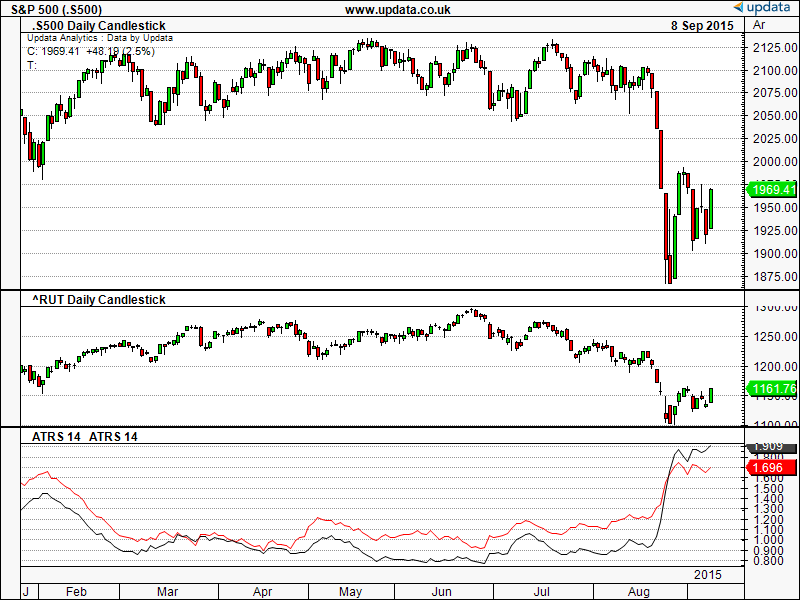
FIGURE 10: UPDATA. Here, the average percentage true
range is applied to both the S&P 500 index and the Russell 2000 Index,
plotted in the same window for comparison.
The Updata code based on this article is in the Updata library and may be
downloaded by clicking the custom menu and then indicator library.
Those who cannot access the library due to a firewall may paste the code shown
here into the Updata custom editor and save it.
PARAMETER "Period" #PERIOD=14
NAME ATRS
@LH=0
@HC=0
@LC=0
@M=0
@MM=0
@ATR1=0
@MID1=0
@MID2=0
@MID3=0
@ATR2=0
@ATR3=0
@MID3=0
@ATRS=0
FOR #CURDATE=#PERIOD TO #LASTDATE
   @LH=HIGH-LOW
   @HC=ABS(HIGH-CLOSE(1))
   @LC=ABS(LOW-CLOSE(1))
   @M=MAX(@LH,@HC)
   @MM=MAX(@M,@LC)
   IF @MM=@HC
      @ATR1=@HC
   ELSE
      @ATR1=0
   ENDIF
   IF @ATR1>0
      @MID1=CLOSE(1)+@HC/2
   ELSE
      @MID1=0.00001
   ENDIF
   IF @MM=@LC
      @ATR2=@LC
   ELSE
      @ATR2=0
   ENDIF
   IF @ATR2>0
      @MID2=CLOSE(1)+@LC/2
   ELSE
      @MID2=0.00001
   ENDIF
   IF @MM=@LH
      @ATR3=@LH
   ELSE
      @ATR3=0
   ENDIF
   IF @ATR3>0
      @MID3=CLOSE(1)+@LH/2
   ELSE
      @MID3=0.00001
   ENDIF
   IF @ATR1>0
      @ATRS=@ATR1/@MID1
   ELSEIF @ATR2>0
      @ATRS=@ATR2/@MID2
   ELSEIF @ATR3>0
      @ATRS=@ATR3/@MID3
   ENDIF
   '6 DENOTES WILDER AVG
   @PLOT=100*SGNL(@ATRS,#PERIOD,6)
NEXT
—Updata support team
support@updata.co.uk
www.updata.co.uk
BACK TO LIST
MICROSOFT EXCEL: NOVEMBER 2015
In “Average Percentage True Range” in this issue, author Vitali Apirine has
provided us with an interesting way to translate volatility, as measured by
the average true range, to a common scale. This allows for a more direct comparison
when trying to make a decision between several possible trades.
Figure 11 shows an Excel-produced composite that approximates Figure 2 from
Apirine’s article (using a date range of 7/14/1999 to 7/17/2000).
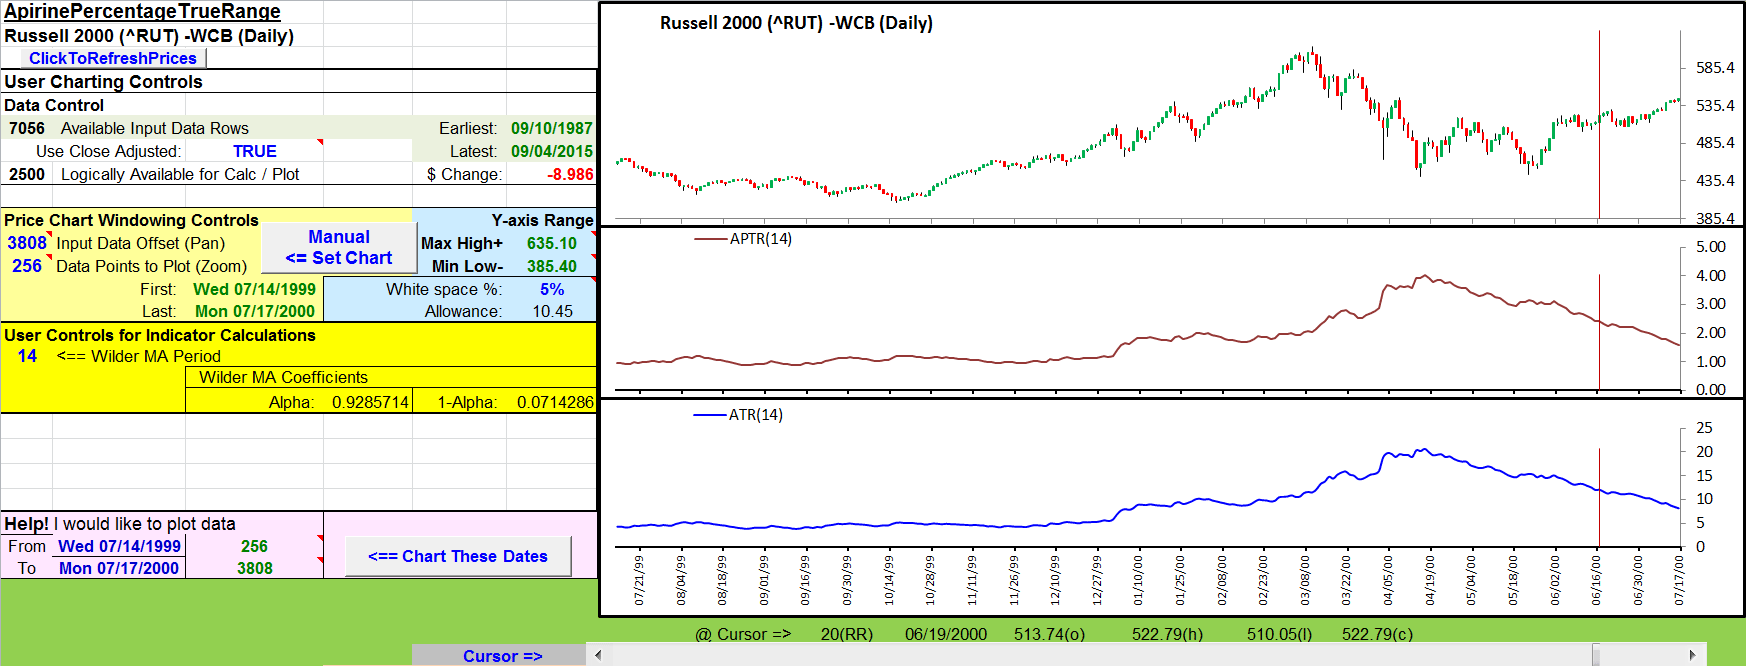
FIGURE 11: MICROSOFT EXCEL. Here is an Excel-produced
composite that approximates Figure 2 from Vitali Apirine’s article in this
issue (using a date range of 7/14/1999 to 7/17/2000).
The spreadsheet file for this Traders’ Tip can be downloaded here: ApirinePercentageTrueRange.xlsm.
To successfully download it, follow these steps:
—Ron McAllister
Excel and VBA programmer
rpmac_xltt@sprynet.com
BACK TO LIST
Originally published in the November 2015 issue of
Technical Analysis of STOCKS & COMMODITIES magazine.
All rights reserved. © Copyright 2015, Technical Analysis, Inc.


