TRADERS’ TIPS
January 2016

For this month’s Traders’ Tips, the focus is James and John Rich’s article in the November 2015 issue, “Simplify It.” Here, we present the January 2016 Traders’ Tips code with possible implementations in various software.
The Traders’ Tips section is provided to help the reader implement a selected technique from an article in this issue or another recent issue. The entries here are contributed by software developers or programmers for software that is capable of customization.

TC2000: JANUARY 2016
James and John Rich’s approach to trading with the trend, as described in their article “Simplify It” that appeared in the November 2015 issue of Technical Analysis of STOCKS & COMMODITIES, can easily be applied in TC2000 Version 16.
In Figure 1, you see a daily SPY chart with a 50-day moving average (yellow line). The 50-day average is moving up, signifying an overall uptrend.
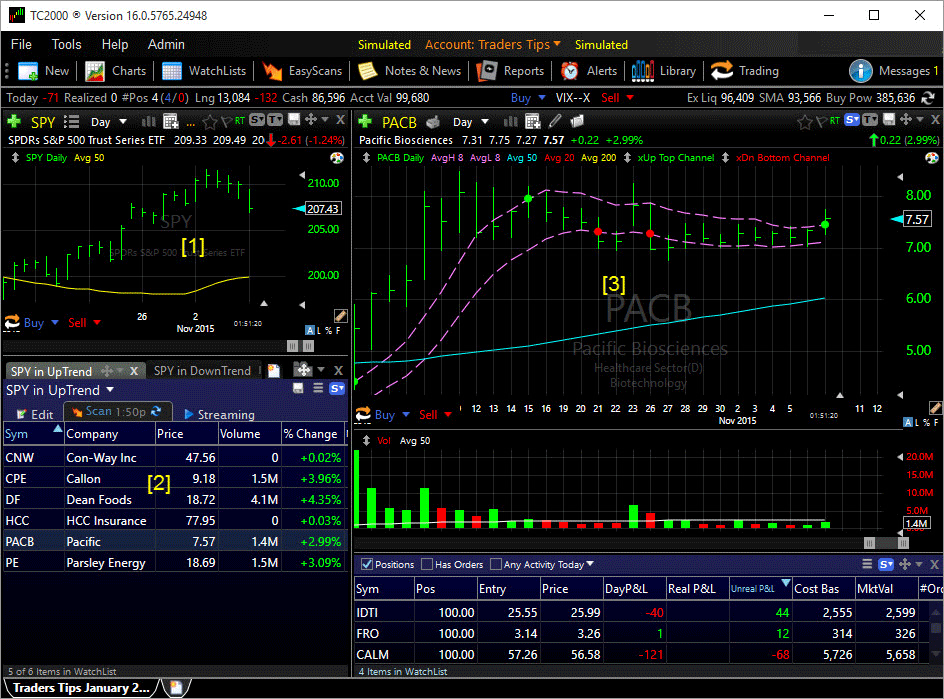
FIGURE 1: TC2000. Here is a TC2000 Version 16 layout showing: 1) a chart of SPY; 2) scans for uptrending and downtrending markets; and 3) a chart showing the entry points for uptrends (green dots) and entry points for downtrends (red dots).
Below the SPY chart are two TC2000 EasyScans: SPY in uptrend and SPY in downtrend. Since the SPY chart is indicating an uptrend based on the 50-day moving average, we have SPY in uptrend selected. This scan shows five stocks for which the following conditions are true:
- Price is above its 50-day average (SMA)
- 20-day SMA of price is above the 50-day SMA of price
- 50-day SMA of price is above the 200-day SMA of price
- 50-day average volume is greater than one million shares
- Price has just crossed up through the eight-day moving average of the high.
You can spacebar through the scan results to view the charts for each symbol. Green dots mark entry points during uptrends and red dots mark entry points during downtrends. Using the new simulated trading feature in version 16, you can place trades on the symbols you find interesting and see how they perform using this approach.
If you would like a copy of this layout to use in your TC2000 software, simply send an email to support@TC2000.com and we’ll send it to you.
—Patrick Argo
Worden Brothers, Inc.
www.TC2000.com
BACK TO LIST

TRADESTATION: JANUARY 2016
In “Simplify It,” which appeared in the November 2015 issue of Technical Analysis of STOCKS & COMMODITIES, authors James and John Rich presented a trend-following approach to trading that they have developed over their many years of market experience. They noted that they begin by determining an opinion of the direction of the overall market. With this information, they described the criteria for selecting candidate stocks for trading. Finally, the authors listed their rules for entry and exit. Here, we are providing TradeStation EasyLanguage code for both an indicator and strategy based on the authors’ work. The indicator can be used in the TradeStation Scanner to search for candidate stocks as well as in a chart to visualize the results; the strategy can be used to backtest on the symbols of your choice.
To download the EasyLanguage code, please visit our TradeStation and EasyLanguage support forum. The code from this article can be found here: https://www.tradestation.com/TASC-2016. The ELD filename is “TASC_JAN2016.ELD.” For more information about EasyLanguage in general, please see https://www.tradestation.com/EL-FAQ.
The code is also shown below:
Indicator: _RichMethod
using elsystem ;
using tsdata.common ;
using tsdata.marketdata ;

inputs:
	ChanLength( 8 ),
	FastMALength( 20 ),
	MedMALength( 50 ),
	SlowMALength( 200 ),
	MarketTrendSymbol( "SPY" ) ;

variables:
	UpperChanValue( 0 ),
	LowerChanValue( 0 ),
	FastMAValue( 0 ),
	MedMAValue( 0 ),
	SlowMAValue( 0 ),
	double SPYAverageValue( 0 ),
	SPYROC( 0 ),
	MarketTrend( 0 ),
	PriceSeriesProvider PSP1( NULL ) ;

once
	begin
	PSP1 = new PriceSeriesProvider ;
	PSP1.Symbol = MarketTrendSymbol ;
	PSP1.Interval.ChartType = DataChartType.Bars ;
	PSP1.Interval.IntervalType = DataIntervalType.Daily ;
	PSP1.Interval.IntervalSpan = 1 ;
	PSP1.Range.FirstDate =
	DateTime.FromELDateAndTime( Date[MaxBarsBack],
		Time[MaxBarsBack] )
		- TimeSpan.Create( 100, 0, 0, 0 ) ;
	PSP1.Realtime = true;
	PSP1.Load = true ;
	Value99 = PSP1.Count ;
	end ;

if PSP1.Count > 50 then
	begin
	SpyAverageValue = Average( PSP1.Close, 50 ) ;
	SpyROC = RateofChange( SpyAverageValue, 2 ) ;
	end ;

if SpyROC > 0 then
	MarketTrend = 1
else if SpyROC < 0 then
	MarketTrend = -1 ;

UpperChanValue = Average( High, ChanLength ) ;
LowerChanValue = Average( Low, ChanLength ) ;
FastMAValue = Average( Close, FastMALength ) ;
MedMAValue = Average( Close, MedMALength ) ;
SlowMAValue = Average( Close, SlowMALength ) ;

if MarketTrend = 1 then
	begin
	if Close > MedMAValue and
		FastMAValue > MedMAValue and
		MedMAValue > SlowMAValue then
		begin
		Alert ;
		if Close crosses over UpperChanValue then
			Plot6( High, "Signal", Cyan ) ;
		end ;
	end
else
	begin
	if Close < MedMAValue and
		FastMAValue < MedMAValue and
		MedMAValue < SlowMAValue then
		begin
		Alert ;
		if Close crosses under LowerChanValue then
			Plot6( Low, "Signal", Magenta ) ;
		end ;
	end ;

Plot1( UpperChanValue, "UpperChan" ) ;
Plot2( LowerChanValue, "LowerChan" ) ;
Plot3( FastMAValue, "FastMA" ) ;
Plot4( MedMAValue, "MediumMA" ) ;
Plot5( SlowMAValue, "SlowMA" ) ;

if MarketTrend = 1 then
	Plot7( "Mkt Up", "Trend" )
else
	Plot7( "Mkt Dn", "Trend" ) ;


Strategy: _RichMethod

using elsystem ;
using tsdata.common ;
using tsdata.marketdata ;

inputs:
	ChanLength( 8 ),
	FastMALength( 20 ),
	MedMALength( 50 ),
	SlowMALength( 200 ),
	MarketTrendSymbol( "SPY" ) ;

variables:
	UpperChanValue( 0 ),
	LowerChanValue( 0 ),
	FastMAValue( 0 ),
	MedMAValue( 0 ),
	SlowMAValue( 0 ),
	double SPYAverageValue( 0 ),
	SPYROC( 0 ),
	MarketTrend( 0 ),
	PriceSeriesProvider PSP1( NULL ) ;

once
	begin
	PSP1 = new PriceSeriesProvider ;
	PSP1.Symbol = MarketTrendSymbol ;
	PSP1.Interval.ChartType = DataChartType.Bars ;
	PSP1.Interval.IntervalType = DataIntervalType.Daily ;
	PSP1.Interval.IntervalSpan = 1 ;
	PSP1.Range.FirstDate =
		DateTime.FromELDateAndTime( Date[MaxBarsBack],
		Time[MaxBarsBack] ) -
		TimeSpan.Create( 100, 0, 0, 0 ) ;
	PSP1.Realtime = true;
	PSP1.Load = true ;
	Value99 = PSP1.Count ;
	end ;

if PSP1.Count > 50 then
	begin
	SpyAverageValue = Average( PSP1.Close, 50 ) ;
	SpyROC = RateofChange( SpyAverageValue, 2 ) ;
	end ;

if SpyROC > 0 then
	MarketTrend = 1
else if SpyROC < 0 then
	MarketTrend = -1 ;

UpperChanValue = Average( High, ChanLength ) ;
LowerChanValue = Average( Low, ChanLength ) ;
FastMAValue = Average( Close, FastMALength ) ;
MedMAValue = Average( Close, MedMALength ) ;
SlowMAValue = Average( Close, SlowMALength ) ;

if MarketTrend = 1 then
	begin
	if Close > MedMAValue and
		FastMAValue > MedMAValue and
		MedMAValue > SlowMAValue then
		begin
		Alert ;
		if Close crosses over UpperChanValue then
			Buy next bar at Market ;
		end ;
	end
else
	begin
	if Close < MedMAValue and
		FastMAValue < MedMAValue and
		MedMAValue < SlowMAValue then
		begin
		Alert ;
		if Close crosses under LowerChanValue then
			SellShort next bar at Market ;
		end ;
	end ;

if Close crosses under LowerChanValue then
	Sell next bar at Market ;

if Close crosses over UpperChanValue then
	Buy To Cover next bar at Market ;
A sample chart is shown in Figure 2.

FIGURE 2: TRADESTATION. Here are example TradeStation Scanner results and the _RichMethod indicator and strategy applied to a daily chart of Amazon (AMZN).
This article is for informational purposes. No type of trading or investment recommendation, advice, or strategy is being made, given, or in any manner provided by TradeStation Securities or its affiliates.
—Doug McCrary
TradeStation Securities, Inc.
www.TradeStation.com
BACK TO LIST

METASTOCK: JANUARY 2016
In “Simplify It,” which appeared in the November 2015 issue of Technical Analysis of STOCKS & COMMODITIES, author James Rich along with brother John Rich presented a simple trading system. The article suggested using the direction of a 50-period SMA on the SPY to find the market trend. Then look for stocks in a trend going the same direction. From there, channel lines are used to find the entry & exit points.
The MetaStock formulas provided here combine all those conditions into entry & exit signals that you can put into a system test or expert adviser in MetaStock.
Enter Long:
s1:= Security("SPY", C);
ma1:= Mov(C, 20, S);
ma2:= Mov(C, 50, S);
ma3:= Mov(C, 200, S);
dir:= If( ROC( Mov(s1, 50,S), 1,$)>0, 1, -1);
tradelong:= dir = 1 AND
ma1 > ma2 AND ma2 > ma3;
tline:= Mov(H,8,S);
bline:= Mov(L,8,S);
el:= C > tline AND tradelong;
xl:= L < bline;
trade:= If(el, 1, If(xl, 0, PREV));
trade = 1 AND Ref(trade = 0, -1)
Exit Long:
s1:= Security("SPY", C);
ma1:= Mov(C, 20, S);
ma2:= Mov(C, 50, S);
ma3:= Mov(C, 200, S);
dir:= If( ROC( Mov(s1, 50,S), 1,$)>0, 1, -1);
tradelong:= dir = 1 AND
ma1 > ma2 AND ma2 > ma3;
tline:= Mov(H,8,S);
bline:= Mov(L,8,S);
el:= C > tline AND tradelong;
xl:= L < bline;
trade:= If(el, 1, If(xl, 0, PREV));
trade = 0 AND Ref(trade = 1, -1)
Enter Short:
s1:= Security("SPY", C);
ma1:= Mov(C, 20, S);
ma2:= Mov(C, 50, S);
ma3:= Mov(C, 200, S);
dir:= If( ROC( Mov(s1, 50,S), 1,$)>0, 1, -1);
tradeshort:= dir = -1 AND
ma1 < ma2 AND ma2 < ma3;
tline:= Mov(H,8,S);
bline:= Mov(L,8,S);
es:= C < bline AND tradeshort;
xs:= H > tline;
trade:= If(es, 1, If(xs, 0, PREV));
trade = 1 AND Ref(trade = 0, -1)
Exit Short:
s1:= Security("SPY", C);
ma1:= Mov(C, 20, S);
ma2:= Mov(C, 50, S);
ma3:= Mov(C, 200, S);
dir:= If( ROC( Mov(s1, 50,S), 1,$)>0, 1, -1);
tradeshort:= dir = -1 AND
ma1 < ma2 AND ma2 < ma3;
tline:= Mov(H,8,S);
bline:= Mov(L,8,S);
es:= C < bline AND tradeshort;
xs:= H > tline;
trade:= If(es, 1, If(xs, 0, PREV));
trade = 0 AND Ref(trade = 1, -1)
—William Golson
MetaStock Technical Support
www.metastock.com
BACK TO LIST

eSIGNAL: JANUARY 2016
For this month’s Traders’ Tip, we’ve provided a study named “Simplify.efs” based on the formula described in James and John Rich’s article that appeared in the November 2015 issue of Technical Analysis of STOCKS & COMMODITIES, “Simplify It.” In the article, the authors presented a simple trading method based on moving averages.
The study contains formula parameters that may be configured through the edit chart window (right-click on the chart and select “edit chart”). A sample chart implementing the study is shown in Figure 3.

FIGURE 3: eSIGNAL. Here is an example of the study plotted on a daily chart of HUM.
To discuss this study or download a complete copy of the formula code, please visit the EFS library discussion board forum under the forums link from the support menu at www.esignal.com or visit our EFS KnowledgeBase at https://www.esignal.com/support/kb/efs/. The eSignal formula script (EFS) is also available for copying & pasting here:
/*********************************
Provided By:
    Interactive Data Corporation (Copyright © 2015)
    All rights reserved. This sample eSignal Formula Script (EFS)
    is for educational purposes only. Interactive Data Corporation
    reserves the right to modify and overwrite this EFS file with
    each new release.

Description:
    Simplify by James E. Rich and John B. Rich

Formula Parameters:                     Default:
    ArrowUP                             Blue
    ArrowDOWN                           Red
Version:            1.00  11/06/2015

Notes:
    The related article is copyrighted material. If you are not a subscriber
    of Stocks & Commodities, please visit www.traders.com.

**********************************/

var fpArray = new Array();

function preMain(){

    setStudyTitle("Simplify");
    setPriceStudy(true);

    setCursorLabelName("50MA", 0);
    setCursorLabelName("8MA-High", 1);
    setCursorLabelName("8MA-Low", 2);

    setDefaultBarFgColor(Color.green, 0);
    setDefaultBarFgColor(Color.blue, 1);
    setDefaultBarFgColor(Color.red, 2);

    setDefaultBarThickness(2, 0);
    setDefaultBarThickness(1, 1);
    setDefaultBarThickness(1, 2);

    var x = 0;

    fpArray[x] = new FunctionParameter("ArrowUP", FunctionParameter.COLOR);
	with(fpArray[x++]){
        setDefault(Color.blue);
    }

    fpArray[x] = new FunctionParameter("ArrowDOWN", FunctionParameter.COLOR);
	with(fpArray[x++]){
        setDefault(Color.red);
    }
}

var bVersion = null;
var xMA50 = null;
var xMA8H = null;
var xMA8L = null;
var xClose = null;
var nTrend = 0;
var nTrend_1 = 0;
var nBarCounter = 0;

function main(ArrowUP, ArrowDOWN){

    if (bVersion == null)
        bVersion = verify();

    if (bVersion == false)
        return;

    if(getBarState() == BARSTATE_ALLBARS){
        nTrend = 0;
        nTrend_1 = 0;
        xMA50 = sma(50);
        xMA8H = sma(8, high());
        xMA8L = sma(8, low());
        xClose = close();
    }

    var nMA50 = xMA50.getValue(0);
    var nMA8H = xMA8H.getValue(0);
    var nMA8L = xMA8L.getValue(0);
    var nClose = xClose.getValue(0);

    if (nMA50 == null || nMA8H == null || nMA8L == null || nClose == null )
        return;

    if(getBarState() == BARSTATE_NEWBAR){
        nTrend_1 = nTrend;
        nBarCounter = getCurrentBarCount();
    }

    if(nTrend_1 == 0){
        if(nClose > nMA8H){
            nTrend_1 = 1;
            drawShape(Shape.UPARROW, BelowBar2, ArrowUP, "UP"+nBarCounter);
        }
        if(nClose < nMA8L){
            nTrend_1 = -1;
            drawShape(Shape.DOWNARROW, AboveBar2, ArrowDOWN, "DN"+nBarCounter);
        }
    }

    if(nTrend_1 != 1){
        if(nClose>nMA8H){
            drawShape(Shape.UPARROW, BelowBar2, ArrowUP, "UP"+nBarCounter);
            nTrend = 1;
        }else{
            removeShape("UP"+nBarCounter);
            nTrend = nTrend_1;
        }
    }

    if(nTrend_1 != -1){
        if(nClose < nMA8L){
            drawShape(Shape.DOWNARROW, AboveBar2, ArrowDOWN, "DN"+nBarCounter);
            nTrend = -1;
        }else{
            removeShape("DN"+nBarCounter);
            nTrend = nTrend_1;
        }
    }

    return [nMA50, nMA8H, nMA8L];
}

function verify(){
    var b = false;

    if (getBuildNumber() < 3742){
        drawTextAbsolute(5, 35, "This study requires version 12.1 or later.",
            Color.white, Color.blue, Text.RELATIVETOBOTTOM|Text.RELATIVETOLEFT|Text.BOLD|Text.LEFT,
            null, 13, "error");
        drawTextAbsolute(5, 20, "Click HERE to upgrade.@URL=https://www.esignal.com/download/default.asp",
            Color.white, Color.blue, Text.RELATIVETOBOTTOM|Text.RELATIVETOLEFT|Text.BOLD|Text.LEFT,
            null, 13, "upgrade");
        return b;
    }
    else
        b = true;

    return b;
}
—Eric Lippert
eSignal, an Interactive Data company
800 779-6555, www.eSignal.com
BACK TO LIST

THINKORSWIM: JANUARY 2016
In “Simplify It,” which appeared in the November 2015 issue of Technical Analysis of STOCKS & COMMODITIES, authors James and John Rich recounted how they have been using technical analysis since the 1960s. In that time, they have experimented with many different strategies, with John Rich even considered an authority on Elliott wave theory. They discuss how they have come to the conclusion that simple is better. Thus, using only moving averages, the brothers have constructed a strategy that defines trends and also has the granularity to include stops and limit prices.
We have recreated their SimpleTrendChannel study and strategy using our proprietary scripting language, thinkscript. We have made the loading process extremely easy: simply click on the links https://tos.mx/vTuhvW and https://tos.mx/YQ7z0L and choose save script to thinkorswim, and backtest in thinkScript. Choose to rename your study and strategy “SimpleTrendChannel.” You can adjust the parameters of this study within the edit studies window to fine-tune your variables.
In the example in Figure 4, you see a chart of National Oilwell Varco (NOV), with the averages used to define strategies as well as the channels used to trigger stops and limit orders. Beneath volume you can see a histogram chart of profit & loss for the charted time frame. In this example, there is a large profit, as the green indicates.

FIGURE 4: THINKORSWIM. Here is a chart of National Oilwell Varco (NOV), with the averages used to define strategies as well as the channels used to trigger stops and limit orders. A histogram of profit & loss for the charted time frame is beneath volume. In this example, there is a large profit, as the green indicates.
For more on this technique, please see the Richs’ article in the November 2015 issue of Technical Analysis of STOCKS & COMMODITIES magazine.
—thinkorswim
A division of TD Ameritrade, Inc.
www.thinkorswim.com
BACK TO LIST

WEALTH-LAB: JANUARY 2016
The WealthScript strategy we are presenting here combines trend-detection ideas that James and John Rich had researched and presented in their November 2015 article in STOCKS & COMMODITIES, titled “Simplify It.” Users have the means to experiment with which method of determining overall market direction works better: the one that relies on the external symbol’s (SPY) movement used by John Rich, or the one that uses a combination of multiple moving averages as used by James Rich. The system’s C# code for Wealth-Lab is shown here:
using System;
using System.Collections.Generic;
using System.Text;
using System.Drawing;
using WealthLab;
using WealthLab.Indicators;

namespace WealthLab.Strategies
{
	public class SimplifyIt : WealthScript
	{
		private StrategyParameter paramTrendRule;

		public SimplifyIt()
		{
			paramTrendRule = CreateParameter("SPY for trend", 1, 0, 1, 1);
		}

		protected override void Execute()
		{
			bool useSpyForTrend = paramTrendRule.ValueInt == 1;
			Bars spy = GetExternalSymbol("SPY",true);
			SMA spySma = SMA.Series(spy.Close,50);
			SMA sma20 = SMA.Series(Close,20);
			SMA sma50 = SMA.Series(Close,50);
			SMA sma200 = SMA.Series(Close,200);
			SMA smaHi = SMA.Series(High,8);
			SMA smaLo = SMA.Series(Low,8);

			//PlotSeries(PricePane,sma20,Color.Orange,WealthLab.LineStyle.Solid,1);
			PlotSeries(PricePane,sma50,Color.Red,WealthLab.LineStyle.Solid,1);
			//PlotSeries(PricePane,sma200,Color.Blue,WealthLab.LineStyle.Solid,1);
			PlotSeriesFillBand(PricePane, smaHi, smaLo, Color.Green, Color.Transparent, LineStyle.Solid, 1);

			if( useSpyForTrend )
			{
				ChartPane spyPane = CreatePane(30,true,true);
				PlotSymbol(spyPane,spy,Color.Blue,Color.Red);
				PlotSeries(spyPane,spySma,Color.Blue,WealthLab.LineStyle.Solid,1);
			}

			for(int bar = GetTradingLoopStartBar(200); bar < Bars.Count; bar++)
			{
				if (IsLastPositionActive)
				{
					Position p = LastPosition;
					if( p.PositionType == PositionType.Long )
					{
						if( Close[bar] < smaLo[bar] - Bars.SymbolInfo.Tick )
							SellAtMarket(bar+1, p );
					}
					else
					{
						if( Close[bar] > smaHi[bar] + Bars.SymbolInfo.Tick )
							CoverAtMarket(bar+1, p );
					}
				}
				else
				{
					bool uptrend = 							// John's / James' method
						( useSpyForTrend && (spy.Close[bar] > spySma[bar] && spySma[bar] > spySma[bar-1] && Close[bar] > sma50[bar])) ||
						(  sma20[bar] > sma50[bar]&& sma50[bar] > sma200[bar]);
					bool downtrend = 						// John's / James' method
						( useSpyForTrend && (spy.Close[bar] < spySma[bar] && spySma[bar] < spySma[bar-1] && Close[bar] < sma50[bar])) ||
						( sma20[bar] < sma50[bar] && sma50[bar] < sma200[bar]);

					if( uptrend )							// market trend is up
					{
                    	if( SMA.Series(Volume,50)[bar] > 1000000 )			// the volume criterion
                        if( Close[bar] > smaHi[bar] )	// the second step
								BuyAtMarket(bar + 1);
					}
					else if( downtrend )					// market trend is down
					{
                    	if( SMA.Series(Volume,50)[bar] > 1000000 )			// the volume criterion
                        if( Close[bar] < smaLo[bar] )	// the second step
								ShortAtMarket(bar + 1);
					}
				}
			}
		}
	}
}
A Wealth-Lab chart demonstrating the system is shown in Figure 5.
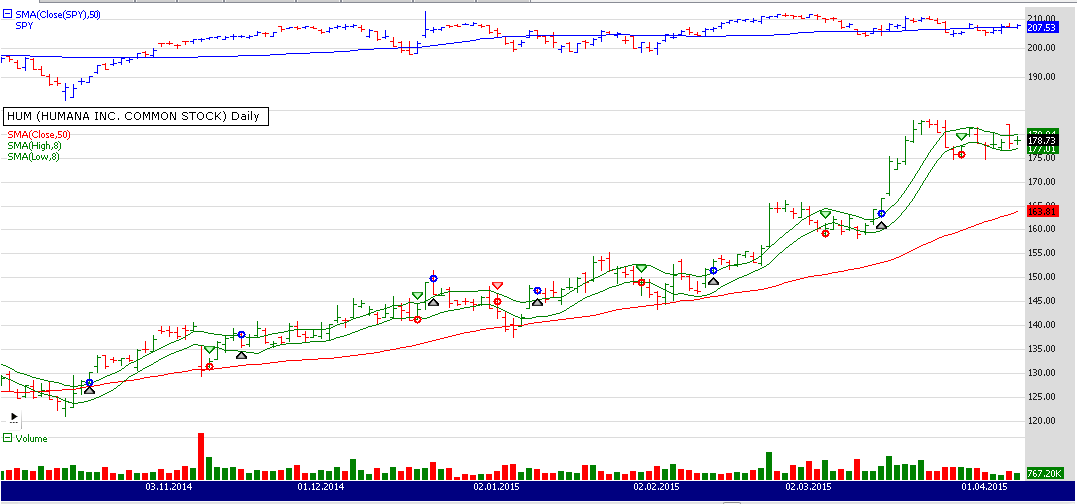
FIGURE 5: WEALTH-LAB, EXAMPLE ENTRIES. This chart illustrates the application of the system’s rules on a daily chart of HUM.
The method of screening for entries is so simple that it doesn’t require programming. For any Wealth-Lab user, it should be pretty trivial to drag and drop the conditions in a rule-based system (Figure 6).
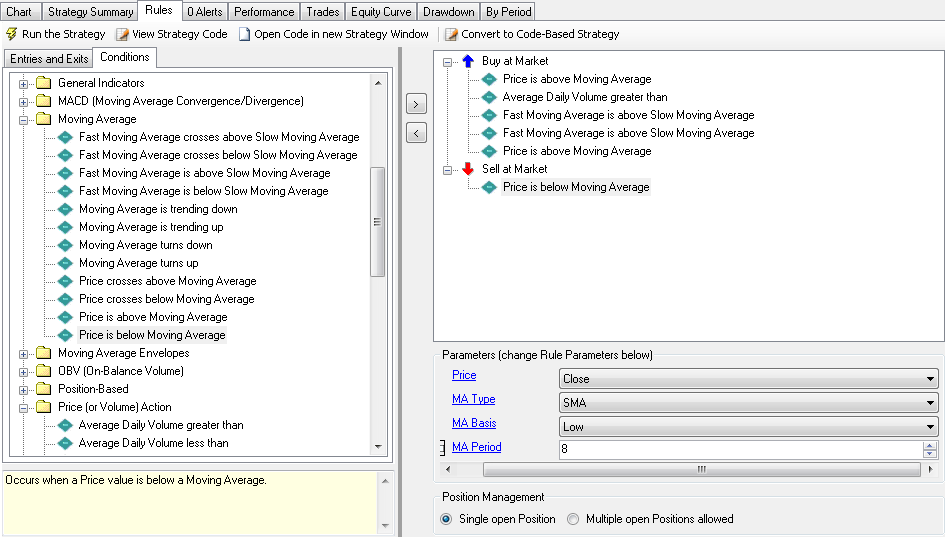
FIGURE 6: WEALTH-LAB, DRAG & DROP. Users can build the system using drag & drop rules and conditions, with no programming necessary.
—Eugene, Wealth-Lab team
MS123, LLC
www.wealth-lab.com
BACK TO LIST

AMIBROKER: JANUARY 2016
In “Simplify It,” which appeared in the November 2015 issue of Technical Analysis of STOCKS & COMMODITIES, authors James and John Rich presented a very simple trading method that involves simple moving average channel breakouts.
A ready-to-use formula for AmiBroker is provided here. This code includes trend filters mentioned in the article for your use, however, the charts presented in Richs’ article show all channel breakouts without filtering, so the formula presented here does the same.
To use the formula, enter the code in the formula editor and press apply indicator. To backtest the system, click the send to analysis button in the formula editor and then the backtest button in the analysis window. You may need to change the symbol of SP500 to match your data provider’s symbology (the code given here uses Yahoo symbology).
A sample chart is shown in Figure 7.
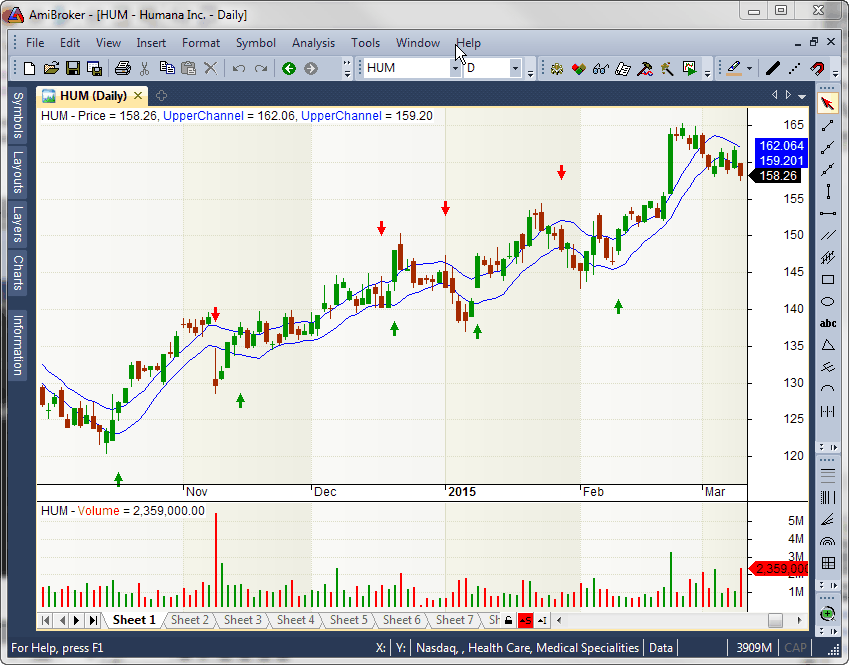
FIGURE 7: AMIBROKER. Here is a daily chart of Humana (HUM) with buy/sell arrows generated by eight-bar simple moving average channel crossovers.
Amibroker Code:
// NOTE: the article mentions those filters
// yet charts presented in article don't use them
SP500 = Foreign("^GSPC", "C" );

UpMarket = MA( SP500, 50 ) > MA( SP500, 20 );

UpTrendStock = UpMarket AND
               MA( C, 20 ) > MA( C, 50 ) AND
               MA( C, 50 ) > MA( C, 200 );

DnTrendStock = NOT UpMarket AND
               MA( C, 20 ) < MA( C, 50 ) AND
               MA( C, 50 ) < MA( C, 200 );

Filter = Volume > 1000000 AND
         ( UpTrendStock OR DnTrendStock );

// MA channel breakout rules
UpperChannel = MA( High, 8 );
LowerChannel = MA( Low, 8 );

Buy = Cross( C, UpperChannel );
Sell = Cross( LowerChannel, C );

Buy = ExRem( Buy, Sell );
Sell = ExRem( Sell, Buy );

Plot( C, "Price", colorDefault, styleCandle );

Plot( UpperChannel, "UpperChannel", colorBlue );
Plot( LowerChannel, "UpperChannel", colorBlue );

PlotShapes( Buy * shapeUpArrow, colorGreen, 0, H, -80 );
PlotShapes( Sell * shapeDownArrow, colorRed, 0, L, -80 );
—Tomasz Janeczko, AmiBroker.com
www.amibroker.com
BACK TO LIST

NEUROSHELL TRADER: JANUARY 2016
The trading method described by James and John Rich in their November 2015 in Technical Analysis of STOCKS & COMMODITIES, “Simplify It,” can be easily implemented with a few of NeuroShell Trader’s 800+ indicators. Simply select new indicator from the insert menu and use the indicator wizard to create the following indicators:
And3Long:
  Close > SMA Close,50
  SMA Close,20 > SMA Close,50
  SMA Close,50 > SMA Close,200

And3Short:
  Close <= SMA Close,50
  SMA Close,20 <= SMA Close,50
  SMA Close,50 <= SMA Close,200
To implement the method, simply select new trading strategy from the insert menu and enter the following in the appropriate locations of the trading strategy wizard:
BUY LONG CONDITIONS: [All of which must be true]
  AND3Long
  CrossAbove(Close, Avg(High,8)

SELL LONG CONDITIONS:  [All of which must be true]
  CrossBelow(Close, Avg(Low,8))

SELL SHORT CONDITIONS: [All of which must be true]
  AND3SHORT
  CrossBelow(Close, Avg(Low,8))

COVER SHORT CONDITIONS: [All of which must be true]
              CrossAbove(Close, Avg(High,8)
Users of NeuroShell Trader can go to the Stocks & Commodities section of the NeuroShell Trader free technical support website to download a copy of this or any previous Traders’ Tips.
A sample chart is shown in Figure 8.

FIGURE 8: NEUROSHELL TRADER. This sample NeuroShell Trader chart displays the method described by James and John Rich in their November 2015 article in S&C.
—Marge Sherald, Ward Systems Group, Inc.
301 662-7950, sales@wardsystems.com
www.neuroshell.com
BACK TO LIST

AIQ: JANUARY 2016
The AIQ code based on James and John Rich’s article in the November 2015 issue of Technical Analysis of STOCKS & COMMODITIES, “Simplify It,” is provided at www.TradersEdgeSystems.com/traderstips.htm.
The code I am providing matches the description of the authors’ trend-following system with additional exit rules. The long exit has an additional profit-protect exit that is not coded, but when I ran tests, I used the built-in profit-protect exit set to 80% protection once the profit level reaches 5% or greater.

FIGURE 9: AIQ. Here is a sample equity curve of the trend-following system versus the NASDAQ 100 index for the period 1/2/2000 to 11/06/2015.
Figure 9 shows the equity curve for the system versus the NASDAQ 100 index for the period 1/2/2000 to 11/06/2015. Figure 10 shows the metrics for this same test period. The system clearly outperformed the index.

FIGURE 10: AIQ. Here are the metrics for the trend-following system and the test settings.
The code and EDS file can be downloaded from www.TradersEdgeSystems.com/traderstips.htm, and is also shown below.
!SIMPLIFY IT
!Author: James E. Rich with John B. Rich, TASC Nov 2015 (for Jan 2016)
!Coded by: Richard Denning 11/1/2015
!www.TradersEdgeSystems.com

!INPUTS
mktTrendLen is 50.
IDX is "SPY".
stkLen1 is 20.
stkLen2 is 50.
stkLen3 is 200.
trdBandLen is 8.
pctStp is 0.07.
minBarsSinceBandCross is 10.
maxBarsHold is 10.

!MARKET DIRECTION:
mktClose is TickerUDF(IDX,[close]).
mktSMA is simpleavg(mktClose,mktTrendLen).
mktTrendUp if mktClose > mktSMA and mktSMA > valresult(mktSMA,10).
mtkTrendDn if mktClose < mktSMA and mktSMA < valresult(mktSMA,10).
!mktTrendUp if tickerRule(IDX,stkTrendUp).
!mtkTrendDn if tickerRule(IDX,stkTrendDn).

!STOCK SCREEN FOR UP TRENDING STOCKS:
stkSMA1 is simpleavg([close],stkLen1).
stkSMA2 is simpleavg([close],stkLen2).
stkSMA3 is simpleavg([close],stkLen3).
stkTrendUp if [close] > stkSMA2
	and stkSMA1 > stkSMA2
	and stkSMA2 > stkSMA3
	and [close] > 5
	and simpleavg([volume],50) > 10000. !volume in hundreds

!STOCK SCREEN FOR DOWN TRENDING STOCKS:
stkTrendDn if [close] < stkSMA2
	and stkSMA1 < stkSMA2
	and stkSMA2 < stkSMA3
	and simpleavg([volume],50) > 10000. !volume in hundreds

!TRADING BANDS:
stkSMAhi is simpleavg([high],trdBandLen).
stkSMAlo is simpleavg([low],trdBandLen).

Buy if mktTrendUp and stkTrendUp
	and [close] > stkSMAhi
	and countof([close] > stkSMAhi,minBarsSinceBandCross)=1.
Short if mtkTrendDn and stkTrendDn
	and [close] < stkSMAlo
	and countof([close] < stkSMAlo,minBarsSinceBandCross)=1.

PD is {position days}.
PEP is {position entry price}.
ExitBuy if [close] < stkSMAlo * (1-pctStp).

ExitShort if [close] > stkSMAhi * (1+pctStp)
	or (PD > maxBarsHold and [close] > PEP).
—Richard Denning
info@TradersEdgeSystems.com
for AIQ Systems
BACK TO LIST

TRADERSSTUDIO: JANUARY 2016
The TradersStudio code based on the article “Simplify It” by James and John Rich, which appeared in the November 2015 issue of Technical Analysis of STOCKS & COMMODITIES, can be found at www.TradersEdgeSystems.com/traderstips.htm.
The following code file is contained in the download:
- System: SIMPLIFY—Trend-following system based on author’s description in November 2015 article, “Simplify It”
Figure 11 shows the equity curve for the system from 2001 through 2013 trading one share per signal of the NASDAQ 100 stocks.

FIGURE 11: TRADERSSTUDIO. Here is a sample equity curve for the trend-following trading system from 2001 through 2013 trading one share per signal of the NASDAQ 100 stocks.
Here is the code:
'SIMPLIFY IT
'Author: James E  Rich with John B  Rich, TASC Nov 2015 (for Jan 2016)
'Coded by: Richard Denning 11/1/2015
'www TradersEdgeSystems com

sub SIMPLIFY(mktTrendLen,stkLen1,stkLen2,stkLen3,trdBandLen,pctStp,minBarsSinceBandCross,maxBarsHold,allowShorts)
'mktTrendLen = 50
'IDX = "SPY"
'stkLen1 = 20
'stkLen2 = 50
'stkLen3 = 200
'trdBandLen = 8
'pctStp = 0.07
'minBarsSinceBandCross = 10
'maxBarsHold = 10
'allowShorts = 0

'MARKET DIRECTION:
Dim mktClose As BarArray
Dim mktSMA As BarArray
Dim mktTrendUp As Boolean
Dim mtkTrendDn As Boolean
mktClose = C Of independent1
mktSMA = Average(mktClose,mktTrendLen)
mktTrendUp = mktClose > mktSMA And mktSMA > mktSMA[10]
mtkTrendDn = mktClose < mktSMA And mktSMA < mktSMA[10]

'STOCK SCREEN FOR UP TRENDING STOCKS:
Dim stkSMA1 As BarArray
Dim stkSMA2 As BarArray
Dim stkSMA3 As BarArray
Dim stkTrendUp As Boolean
stkSMA1 = Average(C,stkLen1)
stkSMA2 = Average(C,stkLen2)
stkSMA3 = Average(C,stkLen3)
stkTrendUp = C>stkSMA2 And stkSMA1>stkSMA2 And stkSMA2>stkSMA3 And C>5 And Average(V,50)>1000000

'STOCK SCREEN FOR DOWN TRENDING STOCKS:
Dim stkTrendDn As Boolean
stkTrendDn = C<stkSMA2 And stkSMA1<stkSMA2 And stkSMA2<stkSMA3 And Average(V,50)>1000000

'TRADING BANDS:
Dim stkSMAhi As BarArray
Dim stkSMAlo As BarArray
stkSMAhi = Average(H,trdBandLen)
stkSMAlo = Average(L,trdBandLen)

'ENTRY RULES:
Dim isAboveSMAhi As BarArray
isAboveSMAhi = C>stkSMAhi
If mktTrendUp And stkTrendUp And C>stkSMAhi And countof(isAboveSMAhi,minBarsSinceBandCross,0)=1 Then
    Buy("LE",1,0,Market,Day)
End If

If allowShorts=1 Then
 Dim isBelowSMAlo As BarArray
 isBelowSMAlo = C<stkSMAlo
 If mtkTrendDn And stkTrendDn And C<stkSMAlo And countof(isBelowSMAlo,minBarsSinceBandCross,0)=1 Then
    Sell("SX",1,0,Market,Day)
 End If
End If

'EXIT RULES:
If C<stkSMAlo*(1-pctStp) Then ExitLong("LXstop","",1,0,Market,Day)

If allowShorts=1 Then
 If C>stkSMAhi*(1+pctStp) Or (BarsSinceEntry>maxBarsHold And C>EntryPrice) Then
    ExitShort("SXstop","",1,0,Market,Day)
 End If
 Dim maxProfitSS As BarArray
 Dim pctOfMaxProfitSS As BarArray
 Dim loC As BarArray
 If C<EntryPrice And C>0 And EntryPrice>0 And BarsSinceEntry>0 Then
    'maxProfitSS=(Lowest(C,BarsSinceEntry-1)/EntryPrice)-1
    If BarsSinceEntry=1 Then loC=C
        Else loC = Min(loC,loC[1])
    maxProfitSS=EntryPrice/loC-1
 End If
 If maxProfitSS>0 And C>0 And EntryPrice>0 Then pctOfMaxProfitSS=(EntryPrice/C-1)/maxProfitSS
 If maxProfitSS>=0.05 And pctOfMaxProfitSS<0.8 Then
    ExitShort("SXprofitProtectSS","",1,0,Market,Day)
 End If
End If
End Sub
—Richard Denning
info@TradersEdgeSystems.com
for TradersStudio
BACK TO LIST

NINJATRADER: JANUARY 2016
The indicator and strategy presented in James and John Rich’s article “Simplify It,” which appeared in the November 2015 issue of Technical Analysis of STOCKS & COMMODITIES, are available for download at www.ninjatrader.com/SC/January2016SC.zip.
Once you have downloaded it, from within the NinjaTrader Control Center window, select the menu File → Utilities → Import NinjaScript and select the downloaded file. This file is for NinjaTrader Version 7.
You can review the indicator and strategy’s source code by selecting the menu Tools → Edit NinjaScript → Indicator or Strategy from within the NinjaTrader Control Center window and selecting either the SimplifyIt indicator or SimplifyIT strategy.
A sample chart implementing the strategy is shown in Figure 12.
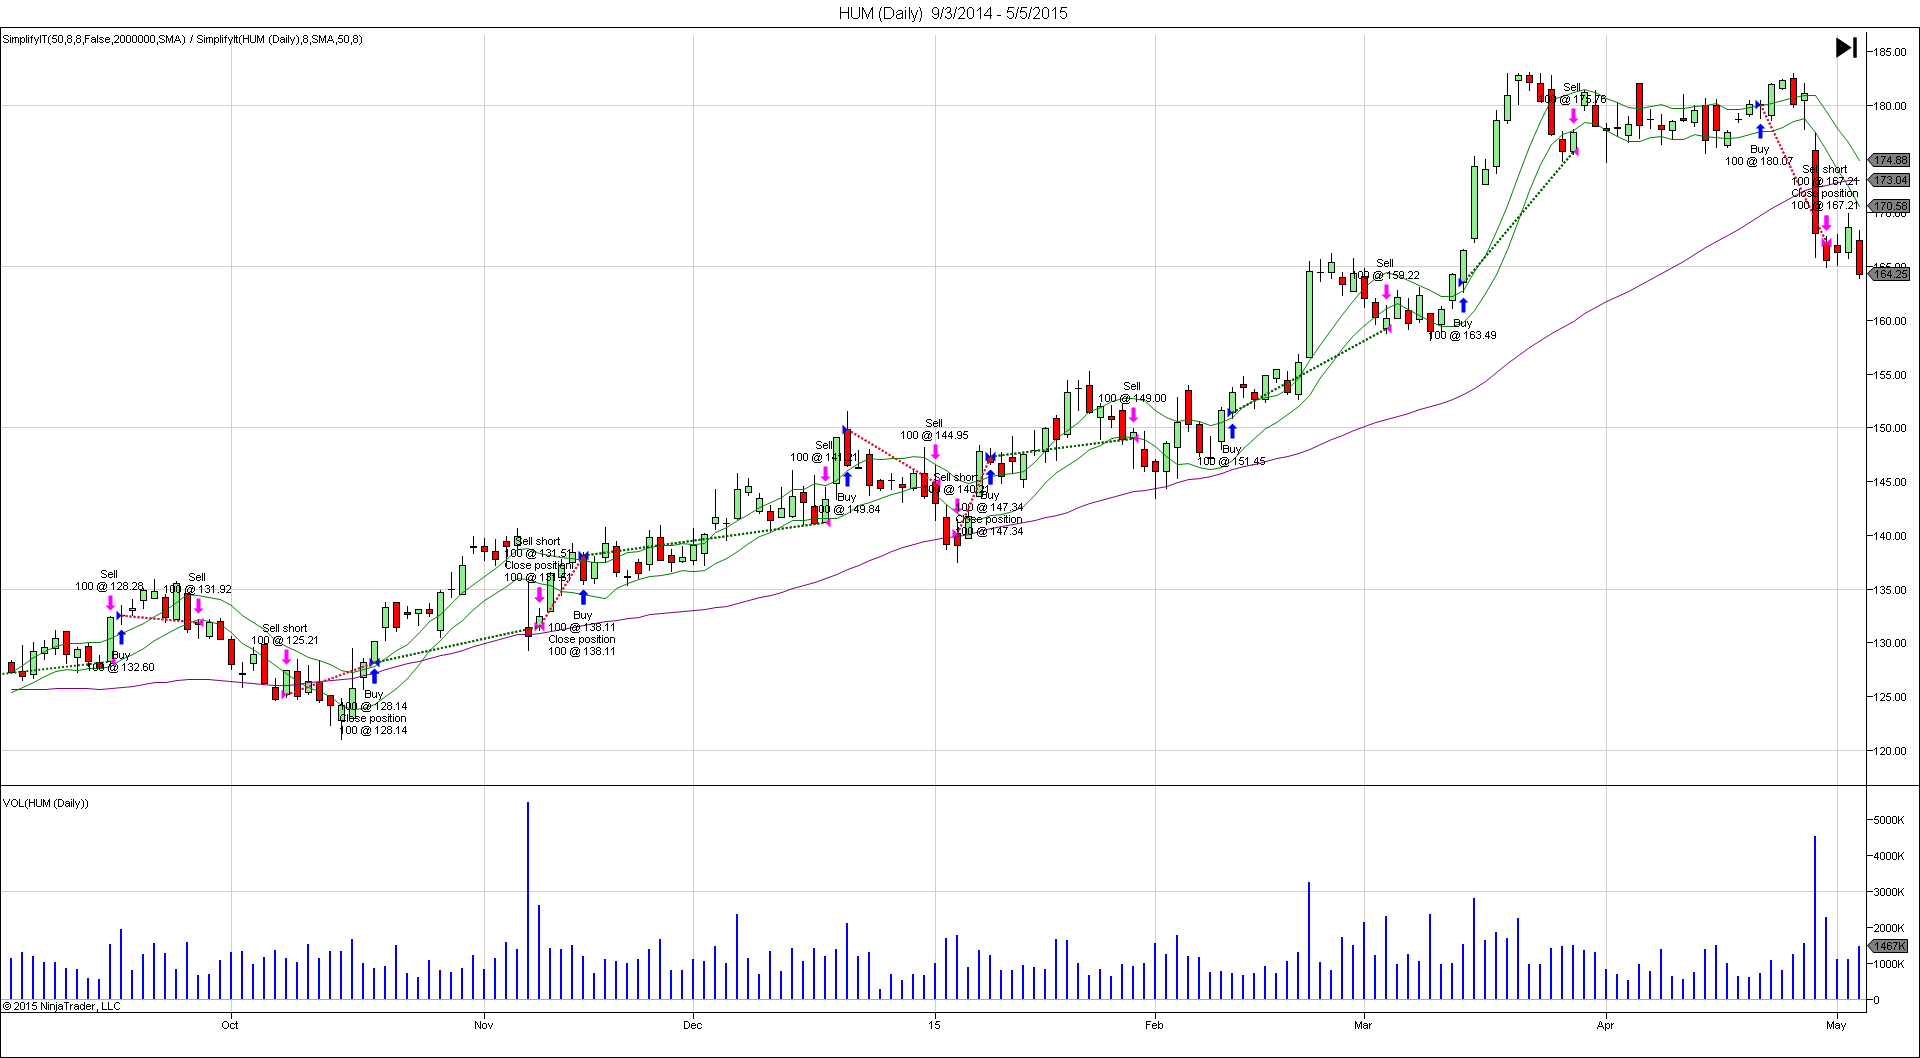
FIGURE 12: NINJATRADER. This sample chart of Humana (HUM) shows entries based on the strategy described in James & John Rich’s article “Simplify It.”
—Raymond Deux & Cody Brewer
NinjaTrader, LLC
www.ninjatrader.com
BACK TO LIST

UPDATA: JANUARY 2016
Our Traders’ Tip for this month is based on James and John Rich’s article from the November 2015 issue of Technical Analysis of STOCKS & COMMODITIES, “Simplify It.” In the article, the authors sought to develop a system for first determining the long, medium, and short trends of a market, and then following the trend, with confirmation based on the direction of the S&P 500 index ETF (SPY). Exits are a trailing stop based on an average of the high or low.
Figure 13 demonstrates an implementation of the system, with the triple moving average filter system applied to a chart of Humana Inc. (HUM).
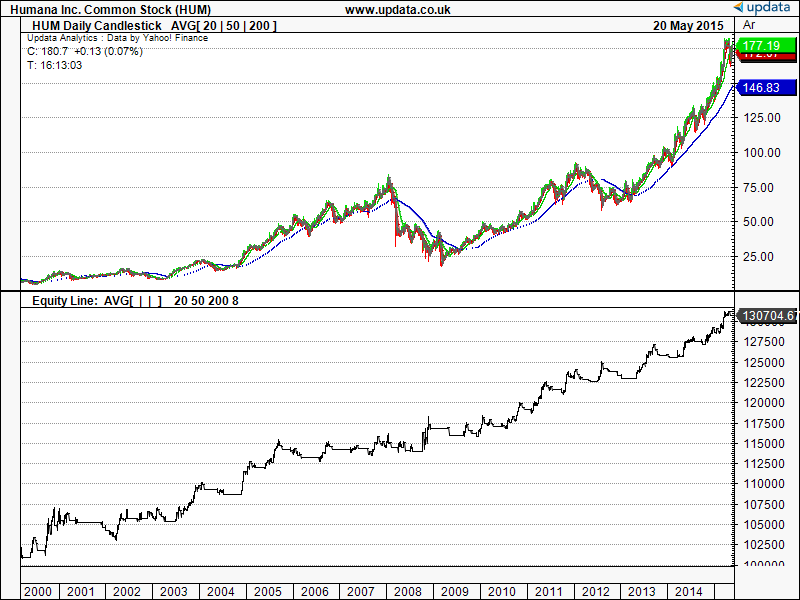
FIGURE 13: UPDATA. Here, the triple moving average filter system is applied to Humana Inc. (HUM) in daily resolution.
The Updata code based on this article is in the Updata library and may be downloaded by clicking the custom menu and system library. Those who cannot access the library due to a firewall may paste the code shown here into the Updata custom editor and save it.
DISPLAYSTYLE 5LINES
INDICATORTYPE TOOL
PLOTSTYLE LINE RGB(200,0,0)
PLOTSTYLE2 LINE RGB(0,200,0)
PLOTSTYLE3 LINE RGB(0,0,200)
PLOTSTYLE4 LINE RGB(100,100,100)
PLOTSTYLE5 LINE RGB(100,100,100)
PARAMETER "Period 1" #PERIOD1=20
PARAMETER "Period 2" #PERIOD2=50
PARAMETER "Period 3" #PERIOD3=200
PARAMETER "Hi/Lo Avg." #PERIOD4=8
PARAMETER "SPY" ~SPY=SELECT

NAME "AVG[" #PERIOD1 "|" #PERIOD2 "|" #PERIOD3 "]" ""
@AVG1=0
@AVG2=0
@AVG3=0
@UPPER=0
@LOWER=0
@SPYAVG=0
@LONGSTOP=0
@SHORTSTOP=0
FOR #CURDATE=#PERIOD1+#PERIOD2+#PERIOD3 TO #LASTDATE
   @AVG1=MAVE(#PERIOD1)
   @AVG2=MAVE(#PERIOD2)
   @AVG3=MAVE(#PERIOD3)
   @SPYAVG=SGNL(~SPY,#PERIOD2,M)
   @UPPER=SGNL(HIGH,#PERIOD4,M)
   @LOWER=SGNL(LOW,#PERIOD4,M)
   'ENTRIES
   IF @AVG1>@AVG2 AND @AVG2>@AVG3 AND HASX(CLOSE,@UPPER,UP) AND ORDERISOPEN=0 AND VOL>1000000
      BUY CLOSE
      @LONGSTOP=PLOW(@LOWER,#PERIOD4)
   ELSEIF @AVG1<@AVG2 AND @AVG2<@AVG3 AND HASX(CLOSE,@LOWER,DOWN) AND ORDERISOPEN=0 AND @SPYAVG<HIST(@SPYAVG,1)
      SHORT CLOSE
      @SHORTSTOP=PHIGH(@UPPER,#PERIOD4)
   ENDIF
   'EXITS
   IF ORDERISOPEN>0
      IF CLOSE<@LONGSTOP
         SELL @LONGSTOP
      ENDIF
      @LONGSTOP=MAX(PLOW(@LOWER,#PERIOD4),@LONGSTOP)
   ELSEIF ORDERISOPEN<0
      IF CLOSE>@SHORTSTOP
         COVER @SHORTSTOP
      ENDIF
      @SHORTSTOP=MIN(PHIGH(@UPPER,#PERIOD4),@SHORTSTOP)
   ENDIF
   @PLOT=@AVG1
   @PLOT2=@AVG2
   @PLOT3=@AVG3
   @PLOT4=@UPPER
   @PLOT5=@LOWER
NEXT
—Updata support team
support@updata.co.uk, www.updata.co.uk
BACK TO LIST
MICROSOFT EXCEL: JANUARY 2016
In “Simplify It,” which appeared in the November 2015 issue of Technical Analysis of STOCKS & COMMODITIES, the team of James and John Rich show us pieces that can be combined to build a simple trading system.
The proposed system is a combination of several screening rules to establish trade setups along with trigger rules to actually enter and exit both long and short trades after a setup has been established.
Since this system is based on bar close to generate signals, the actual trade cannot logically take place on the signal bar. So the long and short position shading used here begins and ends on the bar after an entry or exit signal.
Perhaps one could change the trigger rules to fire if any part of the high/low span of the bar crosses the upper or lower band and then trade at a price from within that span on the actual trigger day.
One other usage note: To keep the SPY index prices in sync with the stock prices, I am forcing a refresh of the index every time you request historical data for a stock symbol. So there will be a bit of additional screen flickering and flashing, but not much additional time consumed.
Figures 14 & 15 approximate the data range we see in Figure 1 of Richs’ article. They demonstrate some of the range of results based on varying the setup rules. Turning the SMA(200) versus SMA(50) rule will eliminate the losing short we see in Figure 2 beginning around 11/8/2014.

FIGURE 14: EXCEL, TRADE SETUP SCREENS. This shows Humana with all trade setup screens in place.

FIGURE 15: EXCEL, SCREENING RULES. What a difference removing a couple of screening rules can make!
Figure 16 shows my transaction summary tab, which lists the details of the transactions that appear on the chart. A bottom line version of the transaction results is carried over to the CalculationsAndCharts tab for quick reference.

FIGURE 16: EXCEL, TRANSACTION SUMMARY.
Due to the way I am calculating trades, you may see a trade at the left of the price chart that actually started on a bar that occurred prior to the bars displayed in the chart window. In that event, you will see a partial trade documented here as an exit with no entry.
This left edge partial trade will not be reflected in the transaction counts, nor in the totals. If you wish to include it, you can increase the points to plot value (cell A11) on the CalculationsAndCharts tab a little bit at a time until you can see the transaction entry bar on the chart.
Figures 17, 18, & 19 are the results of various combinations of the entry setup controls using my approximation of Figure 2 from Richs’ article.
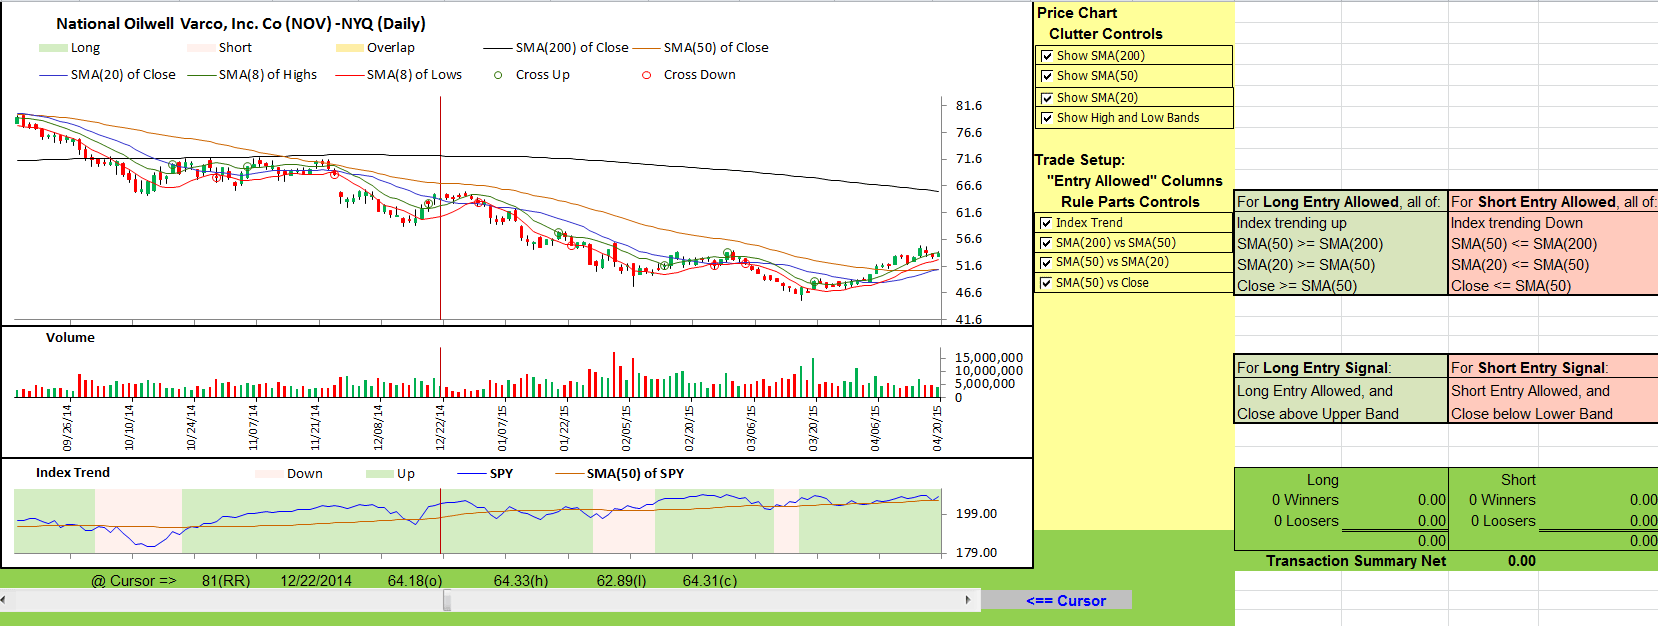
FIGURE 17: EXCEL, SCREEN EXAMPLE. Here is National Oilwell with all setup screens in force.
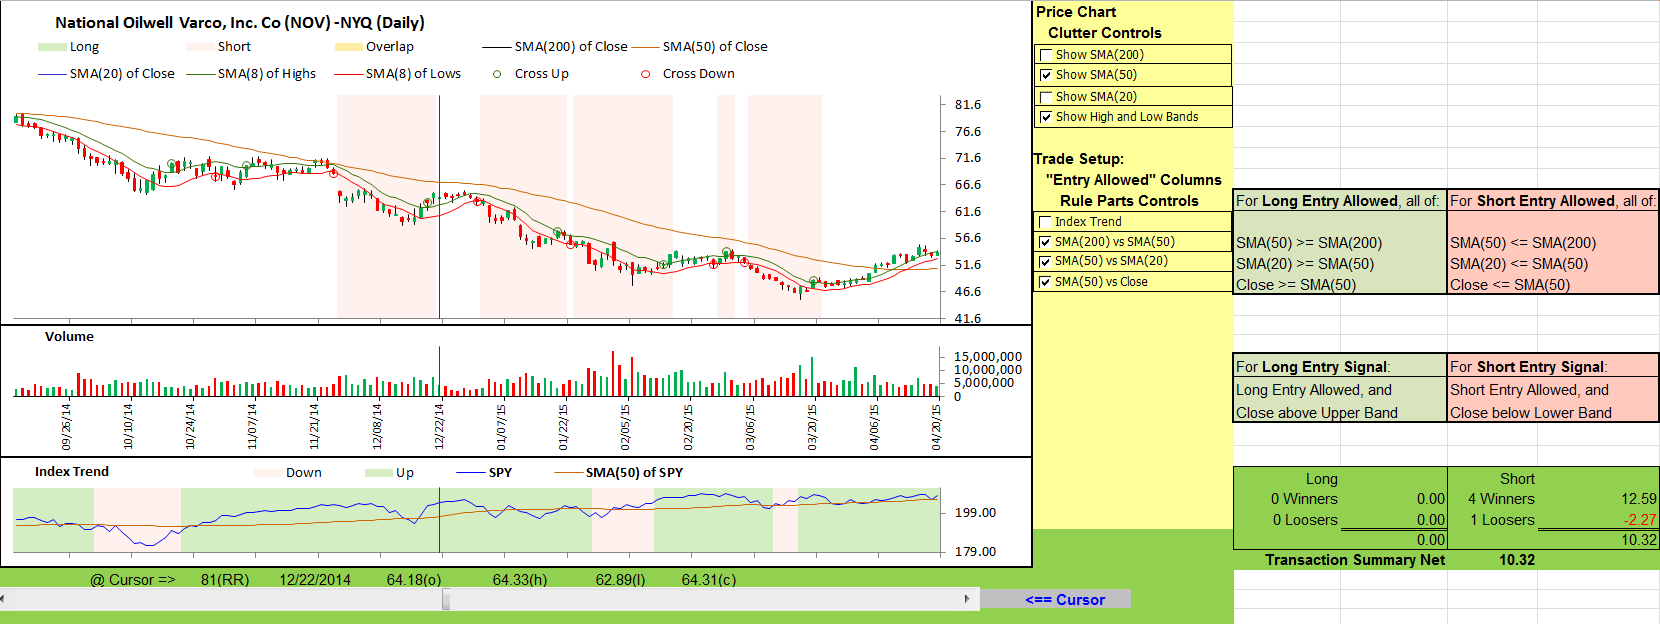
FIGURE 18: EXCEL, TREND SCREENING. Here is the result of dropping the “index trend” screening rule.
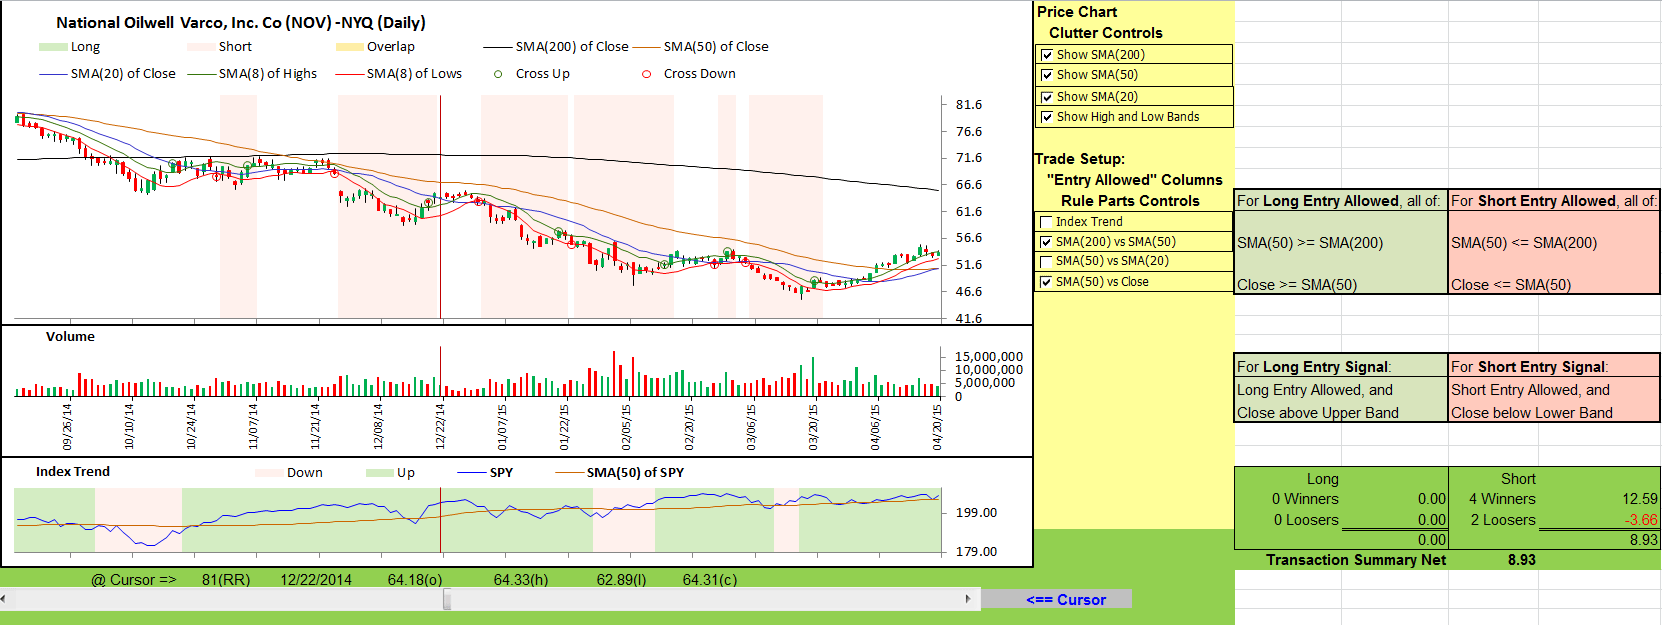
FIGURE 19: EXCEL, SCREENING CONTROLS. Dropping another setup screening control lets in an additional trade, but it did not improve our results.
This stock is clearly in a downtrend, but the market, as reflected in the trend of the SPY index, is not.
With some trial combinations of the screening rules, we find that the index trend screen was blocking all potential short entries.
The spreadsheet file for this Traders’ Tip can be downloaded here. To successfully download it, follow these steps:
- Right-click on the Excel file link, then
- Select “save as” (or “save target as”) to place a copy of the spreadsheet file on your hard drive.
James and John Rich have given us lots to play with here. Enjoy!
—Ron McAllister
Excel and VBA programmer
rpmac_xltt@sprynet.com
BACK TO LIST
Originally published in the January 2016 issue of
Technical Analysis of STOCKS & COMMODITIES magazine.
All rights reserved. © Copyright 2015, Technical Analysis, Inc.


