TRADERS’ TIPS
March 2016
For this month’s Traders’ Tips, the focus is Ken Calhoun’s article in this issue, “ADX Breakouts.” Here, we present the March 2016 Traders’ Tips code with possible implementations in various software.
The Traders’ Tips section is provided to help the reader implement a selected technique from an article in this issue or another recent issue. The entries here are contributed by software developers or programmers for software that is capable of customization.

TRADESTATION: MARCH 2016
In “ADX Breakouts” in this issue, author Ken Calhoun presents a momentum breakout system based on J. Welles Wilder’s average directional index (ADX) indicator. The author suggests that when the ADX breaks above a value of 40, there is an especially strong breakout in progress. We have included in the strategy the optional ability to require a corresponding volume breakout. Calhoun also suggests using a trailing stop with his system. There are several built-in trailing stop strategies included with the TradeStation platform that the trader can test with the ADX breakout strategy. Following is the TradeStation code for the ADX breakout strategy.
Strategy: ADX Breakouts

{ TASC Mar 2016 ADX Breakouts }
{ Ken Calhoun }

inputs:
	int ADXLength( 14 ) ,
	double TriggerLevel( 40 ),
	// 1 = use volume, 2 = ignore volume
	int UseVolumeFilter( 1 ),
	int VolumeAvgLength( 20 ),
	double VolumeMultiplier( 1.1 ),
	int AddTicksForBreakOut( 50 ) ;

variables:
	double ADXValue( 0 ),
	double MyVolume( 0 ),
	double VolumeAverage( 0 ),
	bool VolumeOK( false ),
	intrabarpersist double BreakOutOffset( 0 ) ;

ADXValue = ADX( ADXLength ) ;

once
	begin
	BreakOutOffset =
		AddTicksForBreakOut * MinMove / PriceScale ;
	end ;

if BarType >= 2 and BarType < 5 then
	MyVolume = Volume
else
	MyVolume = Ticks ;

if UseVolumeFilter = 1 then
	begin
	VolumeAverage =
		Average( MyVolume, VolumeAvgLength ) ;
	VolumeOK =
		MyVolume >= VolumeAverage * VolumeMultiplier ;
	end
else
	VolumeOK = true ;

if AdxValue crosses over TriggerLevel
	and VolumeOK then
	Buy next bar at Close + BreakOutOffset Stop ;
To download this EasyLanguage code, please visit our TradeStation and EasyLanguage support forum. The code from this article can be found at https://community.tradestation.com/Discussions/Topic.aspx?Topic_ID=142776. The ELD filename is “TASC_MAR2016.ELD.”
For more information about EasyLanguage in general, please see https://www.tradestation.com/EL-FAQ.
A sample chart is shown in Figure 1.
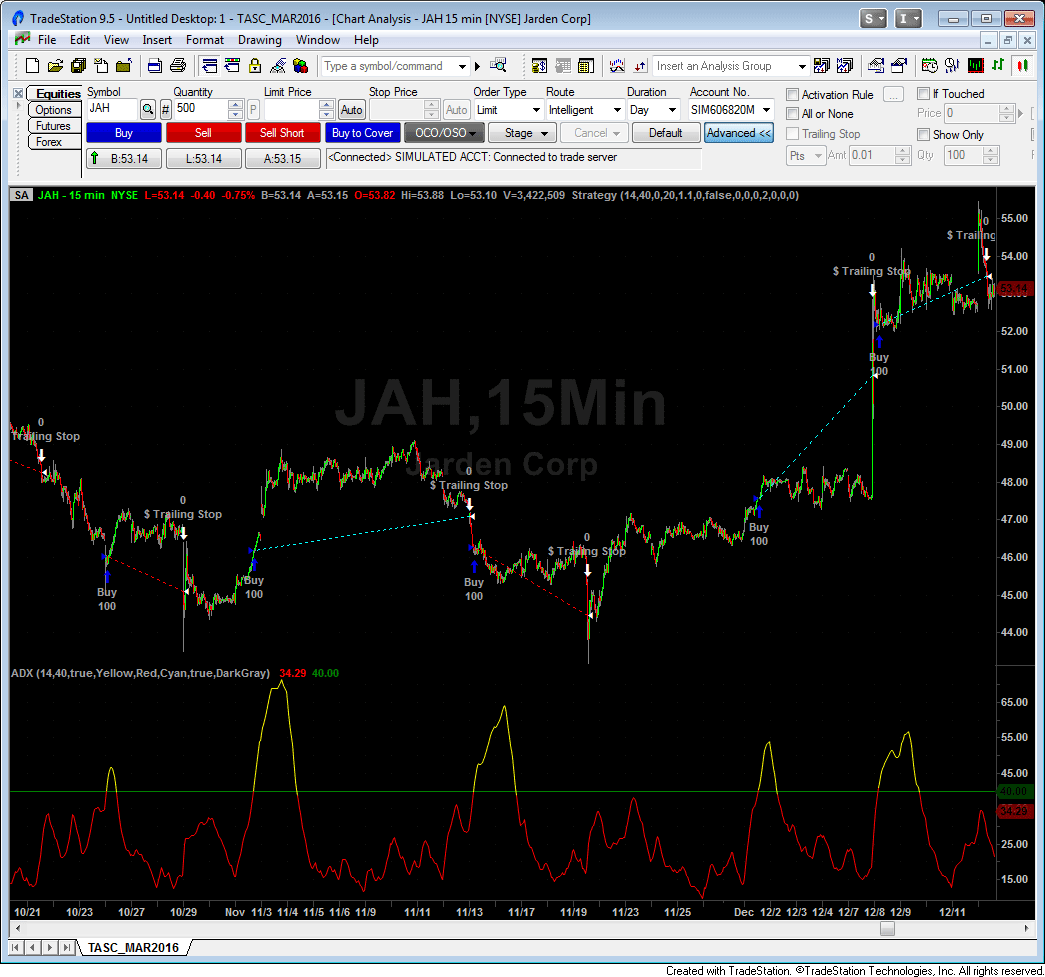
FIGURE 1: TRADESTATION. Here’s an example TradeStation 9.5 15-minute interval chart of symbol JAH with the ADX breakout strategy applied.
This article is for informational purposes. No type of trading or investment recommendation, advice, or strategy is being made, given, or in any manner provided by TradeStation Securities or its affiliates.
—Doug McCrary
TradeStation Securities, Inc.
www.TradeStation.com
BACK TO LIST

TC2000 VERSION 16: MARCH 2016
Ken Calhoun’s ADX breakout strategy described in his article in this issue can be easily applied in TC2000 version 16.
In Figure 2, we overlaid the list of conditions that were used in the EasyScan to find ADX breakouts. We scanned for price history between $20 and $70, a minimum price range over the last 15 days of at least $5.00, and ADX crossing up through 40.
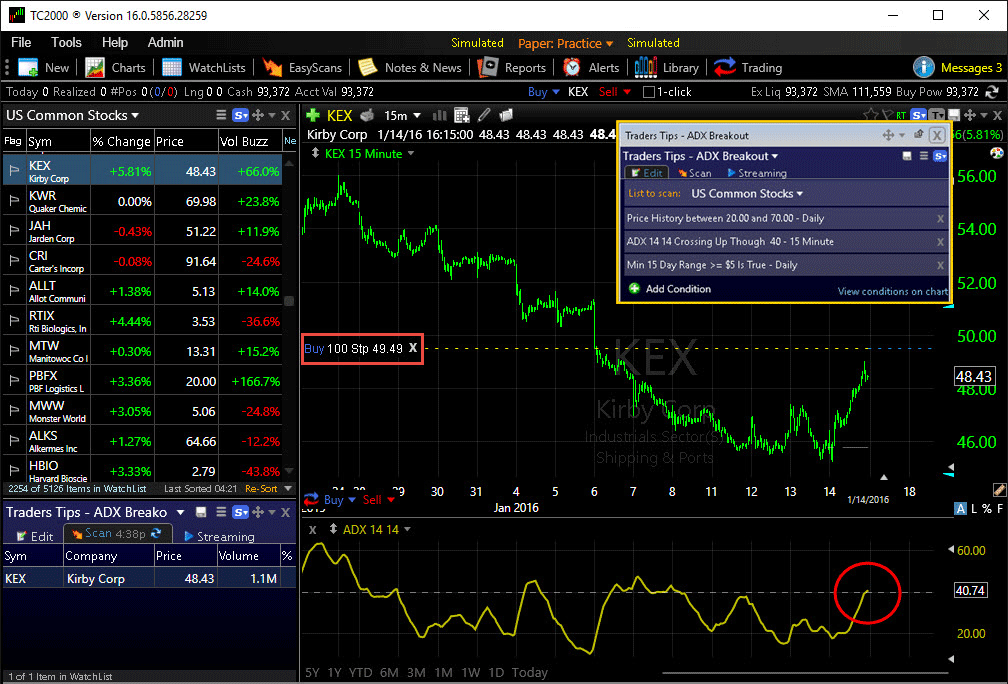
FIGURE 2: TC2000. Here is an example TC2000 version 16 chart of KEX with a buy stop set at $49.49, which is $0.50 above the high on January 14, 2016, where ADX broke above 40.
This scan found KEX, which met all of the conditions. The high price for KEX on January 14, 2016 (the day the ADX crossed up through 40) was $48.99. Using TC2000’s simulated trading, we placed a buy-stop order on KEX at $49.49.
If you would like a copy of this layout to use in your TC2000 software, simply send an email to support@TC2000.com and we’ll send it to you.
—Patrick Argo
Worden Brothers, Inc.
www.TC2000.com
BACK TO LIST

METASTOCK: MARCH 2016
Ken Calhoun’s article in this issue, “ADX Breakouts,” presents a strategy to trade high-volatility breakouts. The system is designed to run on 15-minute data so it will not work on Daily Chart versions of MetaStock.
Following are two formulas for this system. The first is an exploration to run at the end of day that searches for the setup criteria. Any results would be stocks to watch on the following day for signals, or you could place a buy-stop order at the entry price. The second formula is suitable for an expert adviser or system test and will trigger when the trade should be executed.
The formulas for MetaStock are:
Exploration formulas:
Column A
Column Name:
formula:
HighestSince(1, ROC(DayOfWeek(),1,$)<>0, H) + 0.5
Filter formula:
new:= ROC(DayOfWeek(),1,$)<>0;
r15:= (HighestSince(15, new, H)-LowestSince(15, new, L));
setup:= C >= 20 AND C <= 70 AND r15 > 5 AND
HighestSince(1, new, Cross(ADX(14), 40))=1
Expert Advisor or System Test formula:
new:= ROC(DayOfWeek(),1,$)<>0;
r15:= (HighestSince(15, new, H)-LowestSince(15, new, L));
dh:= HighestSince(1, new, H);
setup:= C >= 20 AND C <= 70 AND r15 > 5 AND
HighestSince(1, new, Cross(ADX(14), 40))=1;
ValueWhen(1, new, Ref(setup,-1)) AND
Cross(dh,ValueWhen(1, new, Ref(dh,-1) + 0.5))
—William Golson
MetaStock Technical Support
www.metastock.com
BACK TO LIST

eSIGNAL: MARCH 2016
For this month’s Traders’ Tip, we’ve provided the study ADX Breakouts.efs based on the formula described in Ken Calhoun’s article in this issue, “ADX Breakouts.” In it, the author presents a method of identifying breakouts using J. Welles Wilder’s average directional index (ADX).
The study contains formula parameters that may be configured through the edit chart window (right-click on the chart and select “edit chart”). A sample chart is shown in Figure 3.
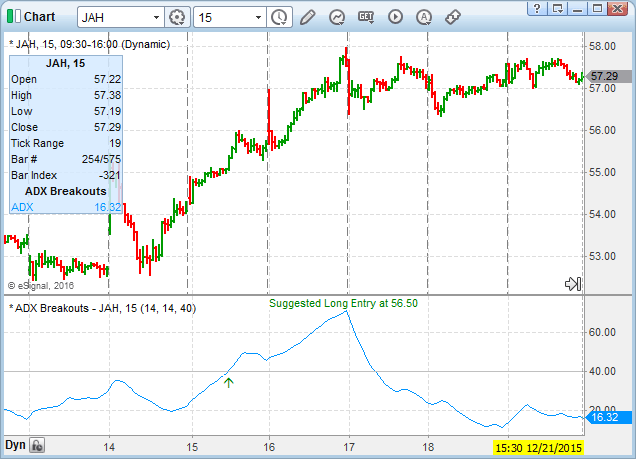
FIGURE 3: eSIGNAL. Here is an example of the study plotted on a 15-minute chart of JAH.
To discuss this study or download a complete copy of the formula code, please visit the EFS Library discussion board forum under the forums link from the support menu at www.esignal.com or visit our EFS KnowledgeBase at https://www.esignal.com/support/kb/efs/. The eSignal formula script (EFS) is also available for copying & pasting here:
/*********************************
Provided By:
eSignal (Copyright c eSignal), a division of Interactive Data
Corporation. 2016. All rights reserved. This sample eSignal
Formula Script (EFS) is for educational purposes only and may be
modified and saved under a new file name.  eSignal is not responsible
for the functionality once modified.  eSignal reserves the right
to modify and overwrite this EFS file with each new release.

Description:
    ADX Breakouts by Ken Calhoun

Version:            1.00  01/11/2016

Formula Parameters:                     Default:
Length                                  14
Smoothing                               14
ADX Trigger Level                       40


Notes:
The related article is copyrighted material. If you are not a subscriber
of Stocks & Commodities, please visit www.traders.com.

**********************************/

var fpArray = new Array();

function preMain(){
    setPriceStudy(false);
    setStudyTitle("ADX Breakouts");
    setCursorLabelName("ADX",0);

    var x=0;
    fpArray[x] = new FunctionParameter("Length", FunctionParameter.NUMBER);
	with(fpArray[x++]){
        setLowerLimit(1);
        setDefault(14);
    }
	fpArray[x] = new FunctionParameter("Smoothing", FunctionParameter.NUMBER);
	with(fpArray[x++]){
        setLowerLimit(1);
        setDefault(14);
    }
    fpArray[x] = new FunctionParameter("TriggerLevel", FunctionParameter.NUMBER);
	with(fpArray[x++]){
        setName("ADX Trigger Level");
        setLowerLimit(1);
        setDefault(40);
    }
}

var bInit = false;
var xADX = null;
var vLongFlag = false;
var vLongFlag1 = false;
var vFullDate = 0
var vTriggerDate;
var bVersion = null;

function main(Length, Smoothing, TriggerLevel){

    if (bVersion == null) bVersion = verify();
    if (bVersion == false) return;


    if(getBarState() == BARSTATE_ALLBARS){
        bInit = false;
    }

    if (!bInit){
        xADX = adx(Length,Smoothing);
        addBand(TriggerLevel, PS_SOLID, 1, Color.lightgrey, "Trigger")
        vLongFlag = false;
        vLongFlag1 = false;
        vFullDate = 0;
        bInit = true;
    }

    if(xADX.getValue(-1) == null) return;

    if( getBarState() == BARSTATE_NEWBAR){
        var oBarDate = getValue("time");
        var vYear  = oBarDate.getFullYear().toString();
        var vMonth = (oBarDate.getMonth()+1)<10? "0"+(oBarDate.getMonth()+1): oBarDate.getMonth()+1;
        var vDate  = oBarDate.getDate()<10? "0"+oBarDate.getDate(): oBarDate.getDate();
        vFullDate = (vYear+vMonth+vDate)*1;
        vLongFlag1 = vLongFlag;
    }

    if(xADX.getValue(0) > TriggerLevel && xADX.getValue(-1) < TriggerLevel){
        vTriggerDate = vFullDate;
        vLongFlag = true;
        drawTextRelative(0, TriggerLevel-2.00, "\u00E1", Color.green, null, Text.TOP|Text.CENTER, "Wingdings", 10, "Arrow"+rawtime(0));
    } else{
        vLongFlag = vLongFlag1
        removeText("UpArrow"+rawtime(0))
    }

    if(day(0)!=day(-1) && vFullDate >= vTriggerDate+1 && vLongFlag){
        var nHigh = formatPriceNumber(high(-1, inv("d"))+0.50);
        drawText("Suggested Long Entry at "+nHigh,TopRow1,Color.green,Text.LEFT,"Text"+rawtime(0));
        vLongFlag = false;
    }

    return xADX.getValue(0);
}

function verify(){
    var b = false;
    if (getBuildNumber() < 779){

        drawTextAbsolute(5, 35, "This study requires version 12.1 or later.",
            Color.white, Color.blue, Text.RELATIVETOBOTTOM|Text.RELATIVETOLEFT|Text.BOLD|Text.LEFT,
            null, 13, "error");
        drawTextAbsolute(5, 20, "Click HERE to upgrade.@URL=https://www.esignal.com/download/default.asp",
            Color.white, Color.blue, Text.RELATIVETOBOTTOM|Text.RELATIVETOLEFT|Text.BOLD|Text.LEFT,
            null, 13, "upgrade");
        return b;
    }
    else
        b = true;

    return b;
}
—Eric Lippert
eSignal, an Interactive Data company
800 779-6555, www.eSignal.com
BACK TO LIST

THINKORSWIM: MARCH 2016
In “ADX Breakouts” in this issue, author Ken Calhoun discusses trading while using momentum indicators. He uses the indicator ADX, a well-known momentum indicator, and goes into great detail about the trading strategy. Because he is using such a well-known study, the details in his article cover mainly his step-by-step trading plan.
We have built a filter and a strategy based on the description of his trading plan using our proprietary scripting language, thinkscript. We have made the loading process extremely easy; simply click on the links https://tos.mx/qxiOHy and https://tos.mx/KwNIIc and choose “view thinkScript Study” and “view thinkScript Strategy.” Choose to rename your study “ADXBreakoutsFilter” and your strategy as “ADXBreakouts,” respectively. You can adjust the parameters of this strategy within the edit studies window to fine-tune your variables.
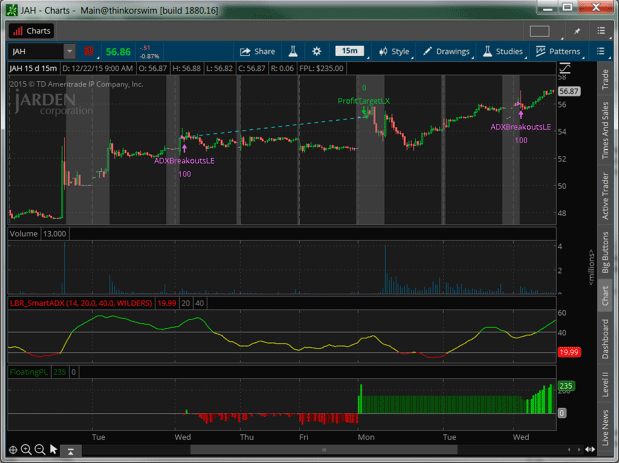
FIGURE 4: THINKORSWIM. Here you see a chart of JAH (Jarden Corporation) with the ADXBreakoutLE strategy and our LBR_SmartADX study. Two exit strategies have been added, ProfitTargetLX and TrailStopLX, both with a $2.00 value.
In the example chart shown in Figure 4, you see a chart of JAH, which is Jarden Corporation, with the ADXBreakoutLE strategy and our LBR_SmartADX study. We have also added our two exit strategies, ProfitTargetLX and TrailStopLX, both with a $2.00 value based on step 3 in Calhoun’s article. For the ADXBreakoutsFilter you can load this into your thinkorswim Stock Hacker as a study filter. This will help you find stocks that are currently in a breakout.
For more on this strategy, see Calhoun’s article.
—thinkorswim
A division of TD Ameritrade, Inc.
www.thinkorswim.com
BACK TO LIST

WEALTH-LAB: MARCH 2016
We are providing WealthScript code for Wealth-Lab based on Ken Calhoun’s intraday technique described in his article in this issue, “ADX Breakouts.”
using System;
using System.Collections.Generic;
using System.Text;
using System.Drawing;
using WealthLab;
using WealthLab.Indicators;

namespace WealthLab.Strategies
{
	public class TASC201603 : WealthScript
	{
		private StrategyParameter paramTrailing;
		private StrategyParameter paramThreshold;
		private StrategyParameter paramRange;
		private StrategyParameter paramADX;

		public TASC201603()
		{
			paramADX = CreateParameter("ADX above", 40, 30, 90, 10);
			paramRange = CreateParameter("15-day range, $", 5, 1, 10, 1);
			paramThreshold = CreateParameter("Cents above", 0.50, 0, 1.0, 0.1);
			paramTrailing = CreateParameter("Trailing stop $", 2, 1, 10, 1);
		}

		protected override void Execute()
		{
			if( !Bars.IsIntraday )
			{
				DrawLabel(PricePane, "Requires intraday data");
				Abort();
			}
			else
			{
				SetScaleDaily();
				DataSeries FifteenDayHigh = Highest.Series(High,15);
				DataSeries FifteenDayLow = Lowest.Series(Low,15);
				DataSeries FifteenDayRange = FifteenDayHigh - FifteenDayLow;
				RestoreScale();
				FifteenDayHigh = Synchronize(FifteenDayHigh);
				FifteenDayRange = Synchronize(FifteenDayRange);
				FifteenDayRange.Description = "The fifteen day range";
                var intradayADX = ADX.Series(Bars,14);
				intradayADX.Description = "Intraday ADX (14)";

				PlotSeries(PricePane,FifteenDayHigh,Color.Blue,LineStyle.Solid,1);
				ChartPane rangePane = CreatePane(30,true,true);
				PlotSeries(rangePane,FifteenDayRange,Color.Violet,LineStyle.Solid,1);
				ChartPane adxPane = CreatePane(30,false,true);
				PlotSeries(adxPane,intradayADX,Color.Red,LineStyle.Solid,1);
				DrawHorzLine(adxPane,40,Color.Green,LineStyle.Dashed,1);

				for(int bar = GetTradingLoopStartBar(1); bar < Bars.Count; bar++)
				{
					if (IsLastPositionActive)
					{
						Position p = LastPosition;
						double amount = p.MFEAsOfBar(bar) / p.Shares + p.EntryPrice - paramTrailing.Value;
						SellAtTrailingStop(bar + 1, p, amount, "$2 Trailing");
					}
					else
					{
						if( (Close[bar] > 20.0) && (Close[bar] < 70.0) )
							if(FifteenDayRange[bar] > paramRange.Value)
								if(intradayADX[bar] > paramADX.ValueInt)
									BuyAtStop(bar+1, FifteenDayHigh[bar] + paramThreshold.Value);
					}
				}
			}
		}
	}
}
Through interactive “sliders” on the bottom left of the screen, you can tune this system by modifying the parameters such as trailing stop size, threshold for entry, and more. See Figure 5 for an example implemention.
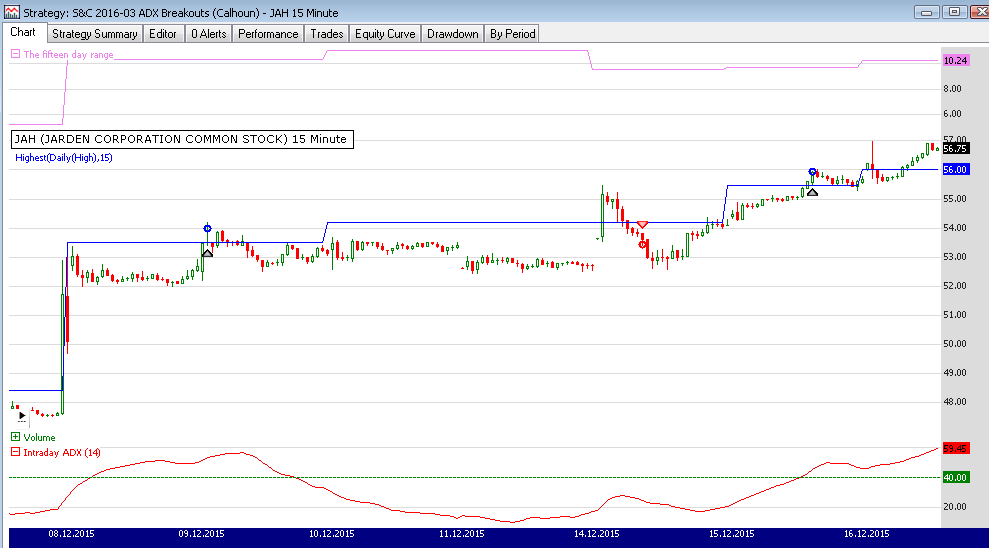
FIGURE 5: WEALTH-LAB. This sample Wealth-Lab chart shows two example trades in JAH (Jarden Corp.) in December 2015.
—Eugene, Wealth-Lab team
MS123, LLC, www.wealth-lab.com
BACK TO LIST

AMIBROKER: MARCH 2016
In “ADX Breakouts” in this issue, author Ken Calhoun presents a very simple strategy based on ADX breaking above 40. A ready-to-use formula for AmiBroker is shown here. You can use it as an indicator, a trading system (exits are implemented by a 2% trailing stop), or an exploration. To use the formula, enter the code in the formula editor and press the apply indicator button, or press send to analysis to perform a backtest or an exploration.
iadx = ADX(); // our indicator

// simple trading system rules
Buy = Cross( iadx, 40 );
Sell = 0;
// exit by 2% trailing stop
ApplyStop( stopTypeTrailing, stopModePercent, 2 );

// exploration
Filter = Buy;
AddColumn( iadx, "ADX" );

// chart
Plot( iadx, "ADX", colorRed );
Plot( 40, "Trigger", colorGreen );
PlotShapes( Buy * shapeUpArrow, colorGreen );
A sample chart of the strategy is shown in Figure 6.
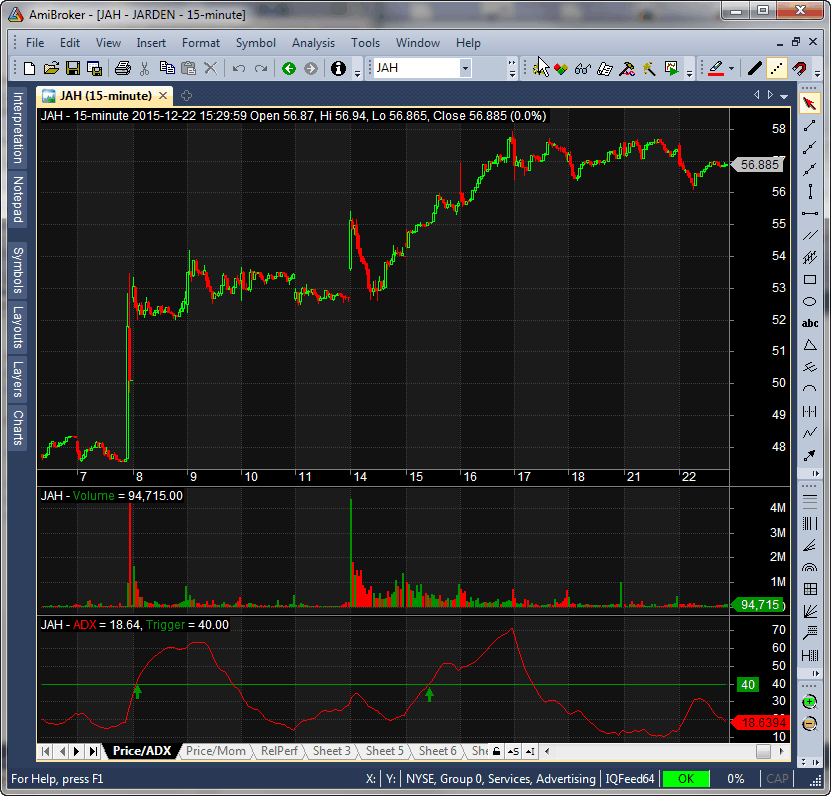
FIGURE 6: AMIBROKER. Here is a 15-minute chart of JAH with ADX breakouts, replicating Figure 1 from Ken Calhoun’s article in this issue.
—Tomasz Janeczko, AmiBroker.com
www.amibroker.com
BACK TO LIST

NEUROSHELL TRADER: MARCH 2016
The ADX breakout system described by Ken Calhoun in his article in this issue, “ADX Breakouts,” can be easily implemented with a few of NeuroShell Trader’s 800+ indicators. Although the 15-minute ADX breakout could be implemented using a 15-minute chart, this tip will describe how to implement both the qualifying conditions and the intraday breakout into a single end-of-day strategy using the NeuroShell DayTrader Power User version’s ability to combine multiple data frequencies.
To set up the ADX breakout system as an end-of-day system, simply create a daily price chart of the stock(s) you wish to trade. Then select new trading strategy from the insert menu and enter the following in the appropriate locations of the trading strategy wizard:
BUY LONG CONDITIONS: [All of which must be true]
     A<=B<=C(20,Close,70)
     A>B(PriceRange(High,Low,15),5)
     A>B(LinTimeReg Slope(Close,15),0)
     A>=B(High,PriceHigh(High,15))
     A>B(15 Minute DayHigh(Date,15 Minute CrossAbove(15 Minute ADX(15 Minute High,15 Minute Low,15 Minute Close,10,5),40),0),0)

STOP PRICE: Add2(High,0.5)

SELL LONG CONDITIONS:
     [Use any of your favorite exit signals]
Note that the qualifying conditions of price between $20 and $70, a 15-day price range larger than $5, an upward trend, and a 15-day price high were all implemented in the daily time frame. However, the condition requiring a 15-minute ADX breakout above 40 was implemented by adding 15-minute CrossAbove and ADX indicators to the daily trading system.
Users of NeuroShell Trader can go to the STOCKS & COMMODITIES section of the NeuroShell Trader free technical support website to download a copy of this or any previous Traders’ Tips.
A sample chart is shown in Figure 7.
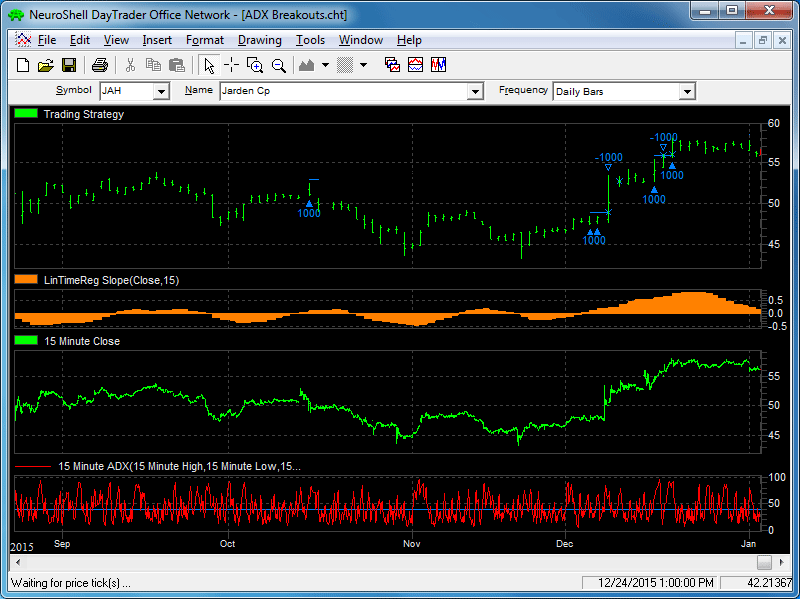
FIGURE 7: NEUROSHELL TRADER. This NeuroShell DayTrader Power User Chart demonstrates the combining of 15-minute and end-of-day frequencies to create an end-of-day stop order trading system based on 15-minute ADX breakout signals.
—Marge Sherald, Ward Systems Group, Inc.
301 662-7950, sales@wardsystems.com
www.neuroshell.com
BACK TO LIST

AIQ: MARCH 2016
The AIQ code based on Ken Calhoun’s article in this issue, “ADX Breakouts,” is provided at www.TradersEdgeSystems.com/traderstips.htm.
Since I mainly work with daily bar strategies, I wanted to test the ADX concept from the article on a daily bar trading system. So I set up a system that buys after a stock has based around the 200-day simple moving average (Basing200). Basing200 is coded in the system as:
- The stock closing above the 200-SMA only 19 bars or less out of the last 100 bars, and
- The stock closing greater than two bars above the 200-SMA in the last 10 bars.
For exits, I used the following built-in exits: a capital-protect exit set at 80% and a profit-protect exit set at 80% once profit reaches 5% or more.
I ran this system on the NASDAQ 100 list of stocks in the EDS backtester over the period 12/31/1999 to 1/11/2016. I then ran a second test on the system using the ADX filter (ADX must be greater than 40 at the time of the signal to buy). I used the same list of stocks, exits, and test period.
Figure 8 shows the first test without the filter: 883 trades, 1.84% average profit per trade, 1.51 reward/risk. Figure 9 shows the second test with the filter: 151 trades, 2.12% average profit per trade, 1.66 reward/risk.
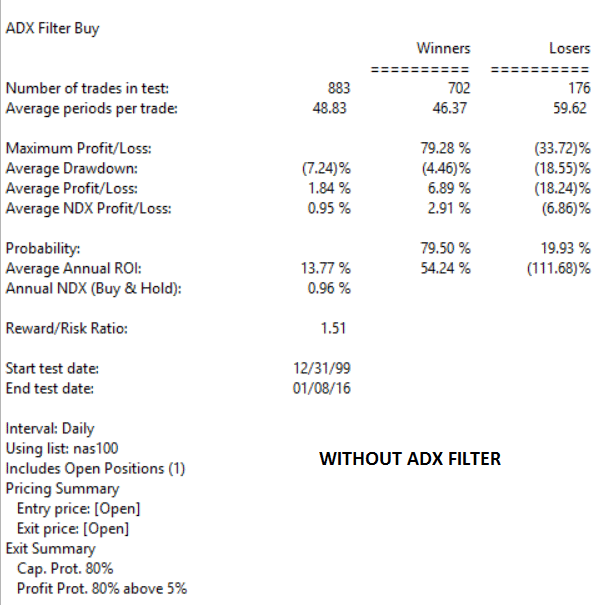
FIGURE 8: AIQ, WITHOUT FILTER. Here are the EDS test results for the example system without the ADX filter.
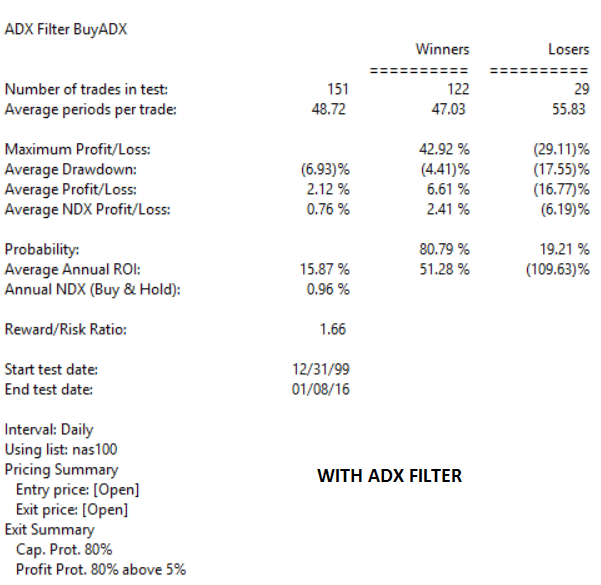
FIGURE 9: AIQ, WITH FILTER. Here are the EDS test results for the example system with the ADX filter.
Although all of the key metrics are better with the filter, there is a significant reduction in the number of trades. In fact, 151 trades would not be sufficient for a trading system over this long test period. If one wanted to use the filter, then the list of stocks would need to be increased to about 2,000 stocks.
!ADX BREAKOUTS
!Author: Ken Calhoun, TASC March 2016
!Coded by: Richard Denning, 1/11/2016
!www.TradersEdgeSystems.com

!NOTE; THIS SAMPLE SYSTEM IS FOR
           !DAILY BAR TESTING OF ADX FILTER ONLY

SMA200 is simpleavg([close],200).
HD is hasdatafor(250).
Above200 if ( [close] > SMA200 ) .
Basing200 if CountOf(Above200,10) >2
	and CountOf(Above200,100) <20.
Buy if  Basing200  and HD>200.
ADXhi if [ADX] >= 40.
BuyADX if Buy and ADXhi.
This code and EDS file can be downloaded from www.TradersEdgeSystems.com/traderstips.htm.
—Richard Denning
info@TradersEdgeSystems.com
for AIQ Systems
BACK TO LIST

TRADERSSTUDIO: MARCH 2016
The TradersStudio code based on Ken Calhoun’s article in this issue, “ADX Breakouts,” can be found at www.TradersEdgeSystems.com/traderstips.htm.
The following code file is provided in the download:
- System: ADX_FILTER_TEST, a system to test the effectiveness of adding an ADX level filter to a simple trading system.
This daily bar system buys after a stock has “based around the 200-day simple moving average (Basing200). Basing200 is coded in the system as closing above the 200-SMA only 19 bars or less out of the last 100 bars and also in the last 10 bars the stock has closed greater than two bars above the 200-SMA. I coded three exits: a time-stop, a stop-loss exit, and a profit-protect trailing exit.
Parameters of the system are as follows:
- UseFilter: If set to “1” then use the ADX level filter. If set to zero, then run system without the filter
- ADXlvl: The level at which the ADX must be at before the signal becomes a buy signal (40 used)
- maxBars: The maximum bars that a trade can be held for (60 bars used)
- stopLoss = The decimal that is the maximum stop-loss before an exit is triggered (0.20 used)
- ppTrig = The decimal minimum profit level that is required to activate the profit protect trailing exit (0.05 used)
- pftProtect = The amount of the profit to protect in decimals (0.80 used).
I then ran this system on the NASDAQ 100 list of stocks in the session manager over the period 2000–2014. I then ran a second test on the system with the ADX filter (ADX must be greater than 40 at the time of the signal to buy). I used the same list of stocks, exits, and test period. Figure 10 shows the results. The first column shows the results without the filter: 798 trades, $8.35 average profit per trade, 1.02 profit factor (PF). The second column shows the results with the filter: 258 trades, $190.51 average profit per trade, 1.62 PF. Although all of the key metrics are better with the filter, there is a significant reduction in the number of trades. In fact, 258 trades would not be sufficient for a trading system over this long test period. If one wanted to use the filter, then the list of stocks would need to be increased significantly.
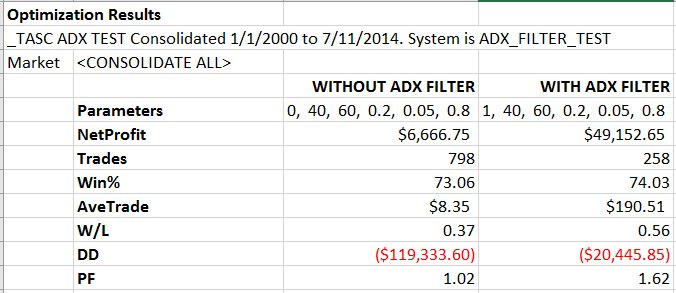
FIGURE 10: TRADERSSTUDIO. Here is a comparison of test results with and without the ADX filter on the NASDAQ 100 list of stocks for the period 1/1/2000 to 7/11/2014.
The TradersStudio code is shown here:
'ADX BREAKOUTS

'Author: Ken Calhoun, TASC March 2016

'Coded by: Richard Denning, 1/11/2016

'www TradersEdgeSystems com


'NOTE; THIS SAMPLE SYSTEMIS FOR

    'DAILY BAR TESTING OF ADX FILTER ONLY

Sub ADX_FILTER_TEST(UseFilter,ADXlvl,maxBars,stopLoss,ppTrig,pftProtect)

Dim SMA200 As BarArray

SMA200 = Average(C,200)

Dim Above200 As BarArray

Above200 = (C > SMA200)

Dim Basing200 As BarArray

Basing200 = (CountOf(Above200,10,0)>2 And CountOf(Above200,100,0)<20)

If Basing200 And UseFilter=0 Then Buy("BuyNoFilter",1,0,Market,Day)

If UseFilter = 1 Then

   If Basing200 And (adx(14,0) >= ADXlvl) Then Buy("BuyADXfilter",1,O,Market,Day)

End If

Dim hiTradePft,curPft

If EntryPrice <> 0 Then

    curPft = C/EntryPrice-1

    hiTradePft = Highest(C,BarsSinceEntry)/EntryPrice-1

    If hiTradePft > ppTrig And curPft/hiTradePft < pftProtect Then

        ExitLong("ProfitProtect","",1,0,Market,Day)

    End If

    If curPft < -stopLoss Then ExitLong("LossExit","",1,0,Market,Day)

End If

If BarsSinceEntry > maxBars Then ExitLong("TimeExit","",1,0,Market,Day)

End Sub
—Richard Denning
info@TradersEdgeSystems.com
for TradersStudio
BACK TO LIST

NINJATRADER: MARCH 2016
The ADX breakout technique as presented in Ken Calhoun’s article in this issue, “ADX Breakouts,” is available for download as both an indicator and strategy at www.ninjatrader.com/SC/March2016SC.zip.
Once you have it downloaded, from within the NinjaTrader Control Center window, select the menu File → Utilities → Import NinjaScript and select the downloaded file. This file is for NinjaTrader Version 7.
You can review the indicator’s and the strategy’s source code by selecting the menu Tools → Edit NinjaScript → Indicator or Strategy from within the NinjaTrader Control Center window and selecting either the “ADXBreakoutsIndicator” or “ADXBreakoutsStrategy” file.
A sample chart implementing the strategy is shown in Figure 11.
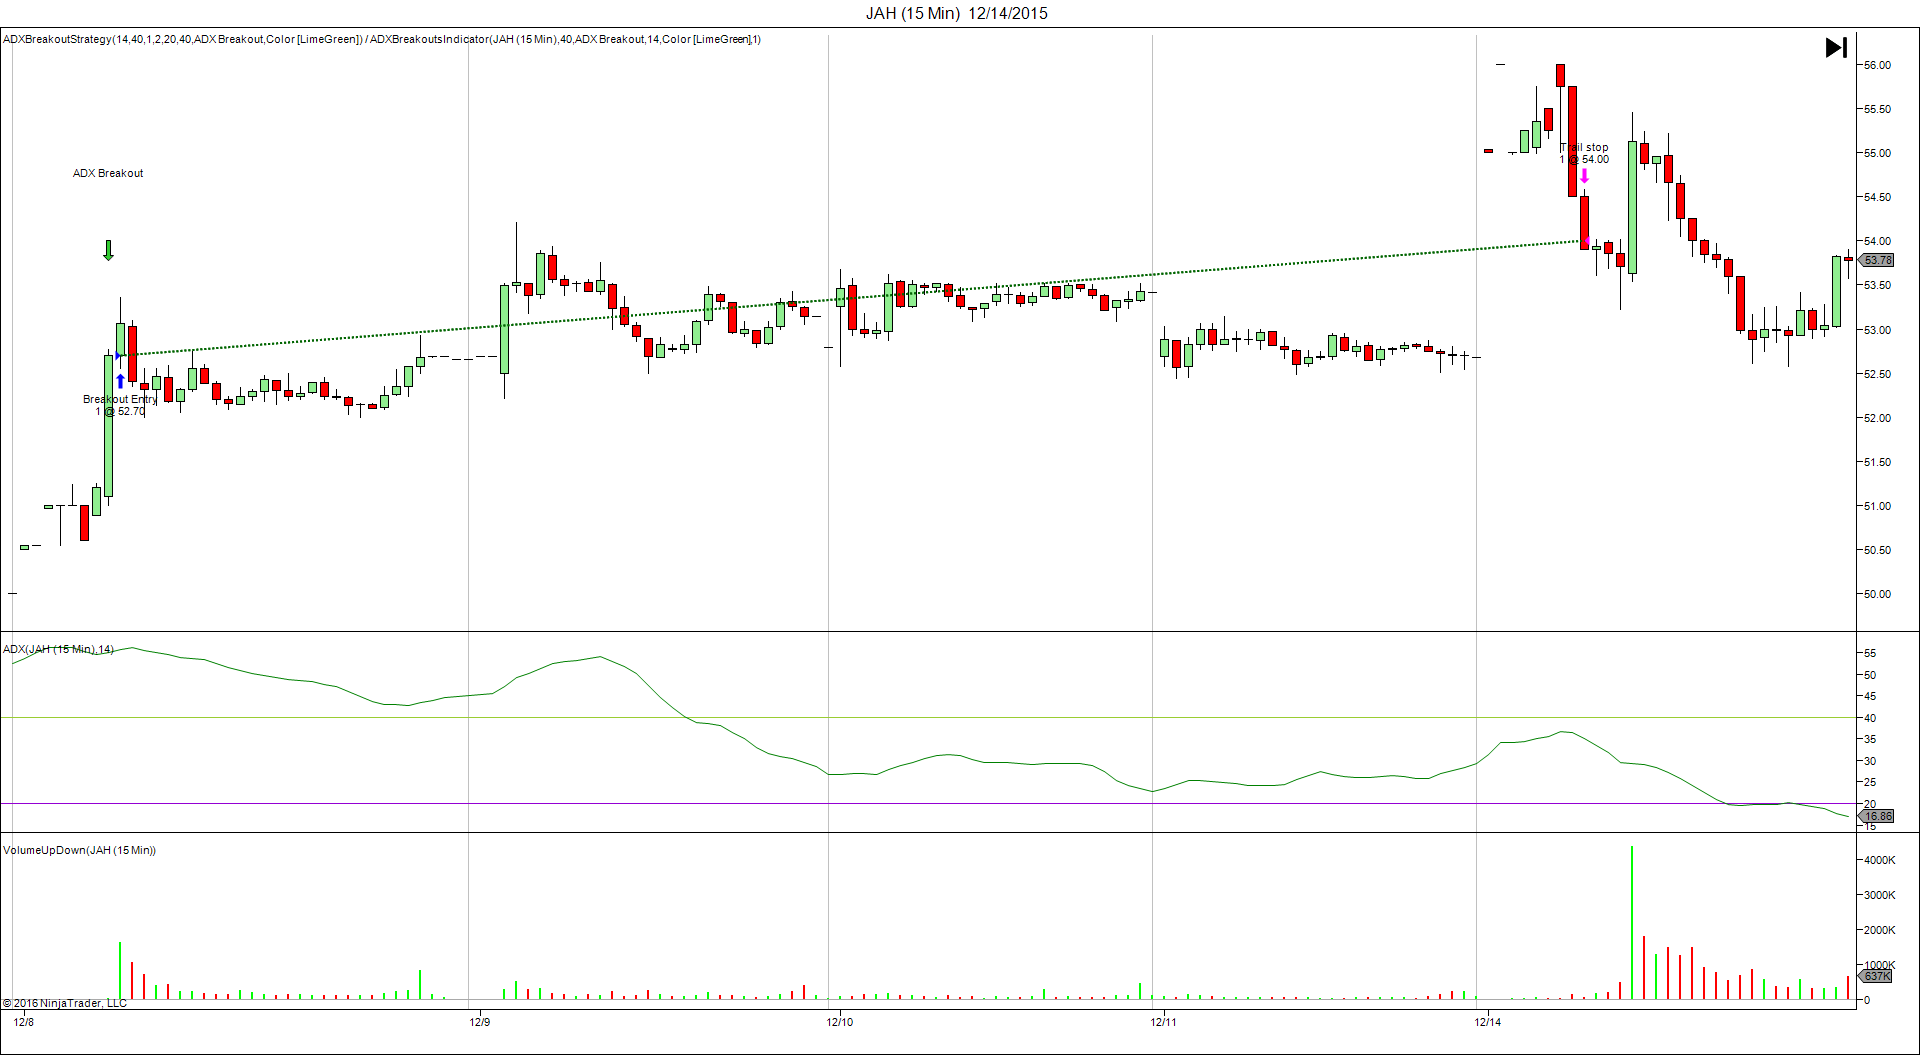
FIGURE 11: NINJATRADER. Here, the ADXBreakoutsStrategy is displayed on a 15-minute chart of JAH. Highlighted are the entry and breakout on December 8, 2015.
—Raymond Deux & Shawn Bradford
NinjaTrader, LLC
www.ninjatrader.com
BACK TO LIST

UPDATA: MARCH 2016
Our Traders’ Tip for this month is based on the article by Ken Calhoun in this issue, “ADX Breakouts.”
In the article, the author seeks to develop a system for differentiating between strong and weak breakouts, using an ADX to determine momentum breakouts from 20-day high prices. Exits are a trailing $2 stop (Figure 12).
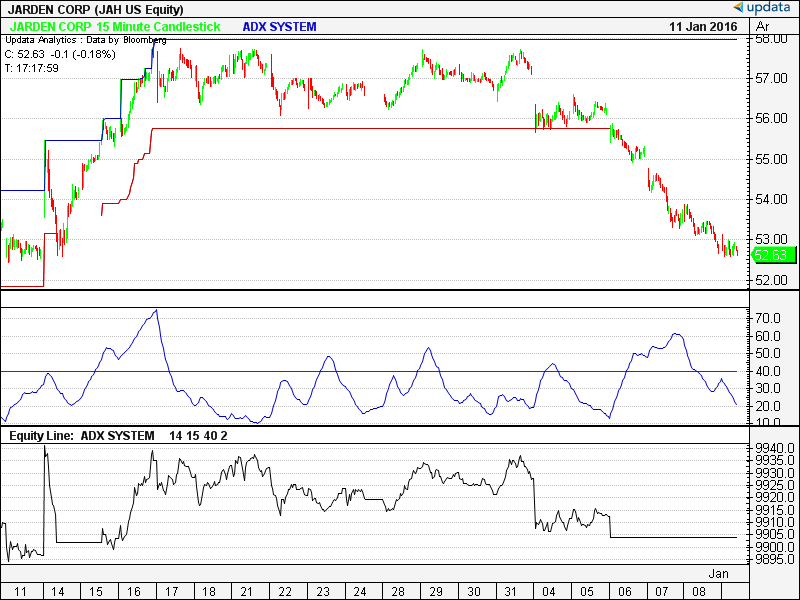
FIGURE 12: UPDATA. The ADX breakout system is applied to intraday Jarden Corp. data.
The Updata code for this article is in the Updata library and may be downloaded by clicking the custom menu and system library. Those who cannot access the library due to a firewall may paste the code shown below into the Updata custom editor and save it.
PARAMETER "Period" #PERIOD=14
PARAMETER "Day High" #DAY=15
PARAMETER "ADX Thresh." @THRESH=40
PARAMETER "Stop $" @STOP=2
DISPLAYSTYLE 4LINES
INDICATORTYPE TOOL
INDICATORTYPE2 TOOL
INDICATORTYPE3 CHART
INDICATORTYPE4 TOOL
COLOUR RGB(0,0,200)
COLOUR2 RGB(200,0,0)
COLOUR3 RGB(0,0,200)
COLOUR4 RGB(200,0,0)
NAME "ADX SYSTEM" ""
@ADX=0
@PERIODHIGH=0
@DAILYHIGH=0
#DAYSAGO=0
@DAILYHIGH=0
@STOPTRAIL=0
FOR #CURDATE=0 TO #LASTDATE
   #DAYSAGO=15*60*24
   @PERIODHIGH=PHIGH(HIGH,#DAYSAGO,1)
   @ADX=DIRMOV(#PERIOD,ADX)
   'TRAILINGSTOP EXIT
   IF ORDERISOPEN=1 AND CLOSE<@STOPTRAIL
      SELL CLOSE
   ENDIF
   'ENTRIES
   IF @ADX>@THRESH AND HIGH>@PERIODHIGH AND ORDERISOPEN=0
      BUY CLOSE
      @STOPTRAIL=CLOSE-@STOP
   ENDIF
   @STOPTRAIL=MAX(@STOPTRAIL,CLOSE-@STOP)
   @PLOT=@PERIODHIGH
   IF ORDERISOPEN=1
   @PLOT2=@STOPTRAIL
   ELSE
   @PLOT2=-10000
   ENDIF
   @PLOT3=@ADX
   @PLOT4=@THRESH
NEXT
—Updata support team
support@updata.co.uk, www.updata.co.uk
BACK TO LIST

TRADE NAVIGATOR: MARCH 2016
he technique described in “ADX Breakouts” by Ken Calhoun in this issue to make it easy to download this library into Trade Navigator. The file name is “SC201603.” To download it, click on Trade Navigator’s blue telephone button, select download special file, then erase the word “upgrade” and type in “SC201603” (without the quotes), then click the start button. When prompted to upgrade, click the yes button. If prompted to close all software, click on the continue button. Your library will now download. This library contains a template named “S&C ADX Breakouts.” This template can be inserted onto your chart (Figure 13) by opening the charting dropdown menu, then selecting the templates command, then selecting the “S&C ADX Breakouts” template.
FIGURE 13: TRADE NAVIGATOR. Here, the S&C ADX breakouts template is applied to the chart.
Strategy
This library also contains a strategy called “ADX Breakouts.” This prebuilt strategy can be overlaid onto your chart (Figure 14) by opening the charting dropdown menu, selecting the add to chart command, then selecting the strategies tab.
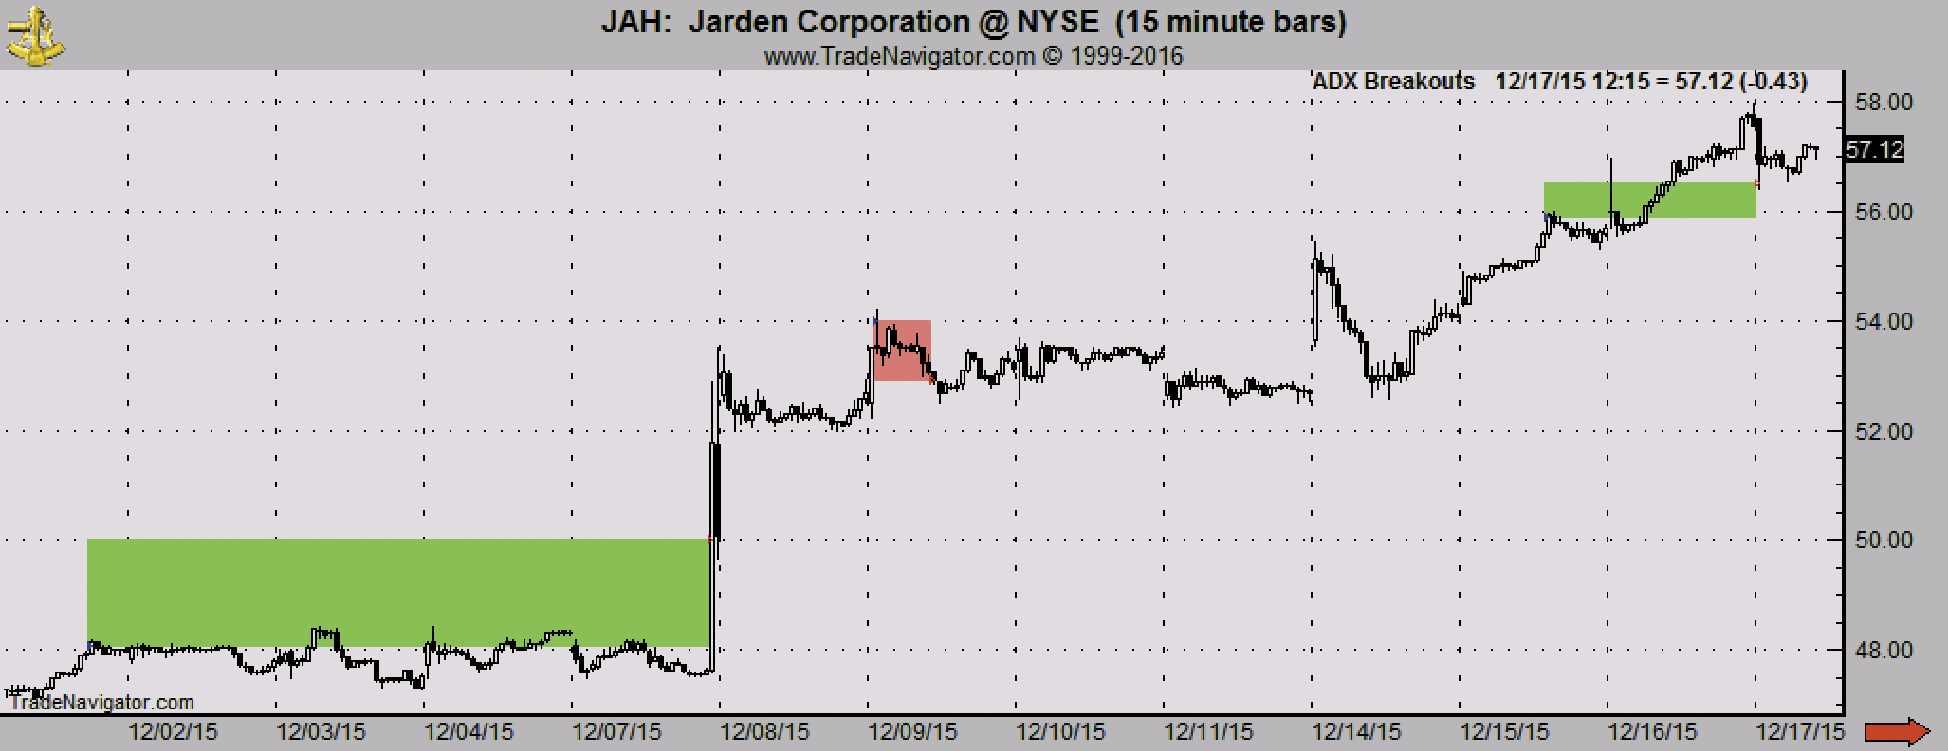
FIGURE 14: TRADE NAVIGATOR. Strategy entry/exit points are displayed on a 15-minute chart with profit/loss shading.
If you have difficulty using the indicators or strategy, our friendly technical support staff is happy to help. Either call 719 884-0245 or click on the live chat tool under Trade Navigator’s help menu or near the top of the website at www.TradeNavigator.com. Support hours are M–F, 6am–7pm US Mountain Time. Happy trading!
—Michael Herman
Genesis Financial Technologies
www.TradeNavigator.com
BACK TO LIST
Originally published in the March 2016 issue of
Technical Analysis of STOCKS & COMMODITIES magazine.
All rights reserved. © Copyright 2016, Technical Analysis, Inc.