TRADERS’ TIPS
May 2016

For this month’s Traders’ Tips, the focus is Barbara Star’s
article in this issue, “Zero In On The MACD.” Here, we present
the May 2016 Traders’ Tips code with possible implementations in various
software.
The Traders’ Tips section is provided to help the reader implement
a selected technique from an article in this issue or another recent issue.
The entries here are contributed by software developers or programmers for
software that is capable of customization.

TRADESTATION: MAY 2016
In “Zero In On The MACD” in this issue, author Barbara Star describes how
she interprets and uses the classic MACD indicator originally created by Gerald
Appel almost 40 years ago. Star also describes several methods she uses to
help further refine her signals. These include the positions of weighted and
exponential moving averages relative to the market as well as activity shown
by the aroon indicator, which was originally developed by Tushar Chande. Here,
we are providing the TradeStation EasyLanguage code for the lower MACD histogram
indicator as well as the upper PaintBar/warning symbols indicator.
Indicator: MACD ColorBars

inputs:
	FastLength( 12 ),
	SlowLength( 26 ),
	UpColor( Blue ),
	DnColor( Red ) ;
variables:
	MACDValue( 0 ),
	PlotColor( 0 ) ;

MACDValue = MACD( Close, FastLength, SlowLength ) ;

if MACDValue > 0 then
	PlotColor = UpColor
else
	PlotColor = DNColor ;

Plot1( MACDValue, "MACD HISTO", PlotColor ) ;


PaintBar: Warning Symbols

using elsystem ;
using elsystem.drawing ;
using elsystem.drawingobjects ;

inputs:
	MACDFastLength( 12 ),
	MACDSlowLength( 26 ),
	MACDUpColor( Blue ),
	MACDDnColor( Red ),
	WMALength( 34 ),
	EMALength( 55 ),
	WMAEMAAboveColor( Magenta ),
	WMAEMABelowColor( Blue ),
	AroonLength( 25 ),
	AroonUpColor( Green ),
	AroonDnColor( Red ),
	LabelSize( 16 ),
	ShowWMAEMALabels( true ),
	ShowAroonLabels( true )  ;

variables:
	MACDValue( 0 ),
	PlotColor( 0 ),
	double WMAValue( 0 ),
	double EMAValue( 0 ),
	double AroonUpValue( 0 ),
	double AroonDnValue( 0 ) ;

method void DrawLabel( string Character, string Myfont,
double Price, int MyColor, int FontSize,  VerticalStyle VLoc )
variables: DTpoint MyPoint, TextLabel MyLabel ;
	begin
	MyPoint = DTPoint.Create( BarDateTime, Price ) ;
	MyLabel = TextLabel.Create( MyPoint, Character ) ;
	MyLabel.Color = Color.FromARGB( GetRValue( MyColor ),
	GetGValue( MyColor ), GetBValue( MyColor ) ) ;
	MyLabel.Font = Font.Create( Myfont, FontSize ) ;
	MyLabel.VStyle = VLoc ;
	MyLabel.HStyle = HorizontalStyle.Center ;
	MyLabel.Persist = false ;
	MyLabel.Lock = true ;
	if DrawingObjects <> NULL then
		DrawingObjects.Add( MyLabel ) ;
	end ;

MACDValue = MACD( Close, MACDFastLength, MACDSlowLength ) ;
WMAValue = WAverage( Close, WMALength ) ;
EMAValue = XAverage( Close, EMALength ) ;
AroonUpValue = AroonUp( AroonLength ) ;
AroonDnValue = AroonDown( AroonLength ) ;

if ShowWMAEMALabels then
	begin
	if Close < WMAValue and Close >= EMAValue then
		DrawLabel( "t", "Wingdings", High,
		WMAEMAAboveColor, LabelSize, VerticalStyle.Bottom  ) ;
	if EMAValue > WMAValue and Close > WMAValue then
		DrawLabel( "t", "Wingdings", Low,
		WMAEMABelowColor, LabelSize, VerticalStyle.Top ) ;
	end ;

if ShowAroonLabels then
	begin
	if AroonUpValue crosses over AroonDnValue then
		DrawLabel( "A", "Tradestation", Low,
		AroonUpColor, 14, VerticalStyle.Top ) ;

	if AroonUpValue crosses under AroonDnValue then
		DrawLabel( "Q", "Tradestation", High,
		AroonDnColor, 14, VerticalStyle.Bottom ) ;
	end ;


if MACDValue > 0 then
	PlotColor = MACDUpColor
else
	PlotColor = MACDDnColor ;
PlotPaintBar( High, Low, Open, Close,
"MACD Color Bar", PlotColor ) ;
To download the EasyLanguage code, please visit our TradeStation and EasyLanguage
support forum. The code can be found at https://community.tradestation.com/Discussions/Topic.aspx?Topic_ID=142776.
The ELD filename is “TASC_MAY2016.ELD.”
For more information about EasyLanguage in general, please see https://www.tradestation.com/EL-FAQ.
A sample chart is shown in Figure 1.

FIGURE 1: TRADESTATION. In this example chart, MACD ColorBars
and warning symbol indicators are applied to a daily chart of 3M Co.
This article is for informational purposes. No type of trading or investment
recommendation, advice, or strategy is being made, given, or in any manner
provided by TradeStation Securities or its affiliates.
—Doug McCrary
TradeStation Securities, Inc.
www.TradeStation.com
BACK TO LIST

METASTOCK: MAY 2016
Barbara Star’s article in this issue, “Zero In On The MACD,” presents a trading
strategy focused on the main line of the MACD. It uses colors and symbols to
alert the trader to the market conditions and trend status. Following are the
MetaStock formulas to color the MACD and add the colors and symbols to a chart
through an expert advisor.
Indicator formula:
base:= OscP(12, 26, E, %);
If(base>=0, base, 0);
If(base<0, base, 0)
After plotting this formula, you will have two lines in your chart. Select
the top line and change the color to blue. Set the bottom line color to red.
Set both lines to use the histogram style.
Expert Advisor Formulas
Six formulas are used to make the expert. Two are highlights and others are
symbols:
Blue Highlight formula:
OscP(12, 26, E, %) >= 0
Red Highlight formula:
OscP(12, 26, E, %) < 0
Buy Arrow formula:
Cross(OscP(12, 26, E, %), 0)
Sell Arrow formula:
Cross(0, OscP(12, 26, E, %))
Top warning diamond formula:
C < Mov(C, 34, W) AND
H > Mov(C, 55, E)
Bottom warning diamond formula:
ma1:= Mov(C, 34, W);
ma2:= Mov(C, 55, E);
ma2 > ma1 AND C > ma1
—William Golson
MetaStock Technical Support
www.metastock.com
BACK TO LIST

eSIGNAL:
MAY 2016
For this month’s Traders’ Tip, we’ve provided the studies Star_MA.efs and Star_MACD.efs based
on the formulas described in Barbara Star’s article in this issue, “Zero In
On The MACD.” In the article, Star presents a method for analyzing the market
based on the moving average convergence/divergence (MACD) indicator that was
originally developed by Gerald Appel.
The studies contain formula parameters that may be configured through the edit
chart window (right-click on the chart and select edit chart).
Sample charts demonstrating the studies are shown in Figures 2 & 3.
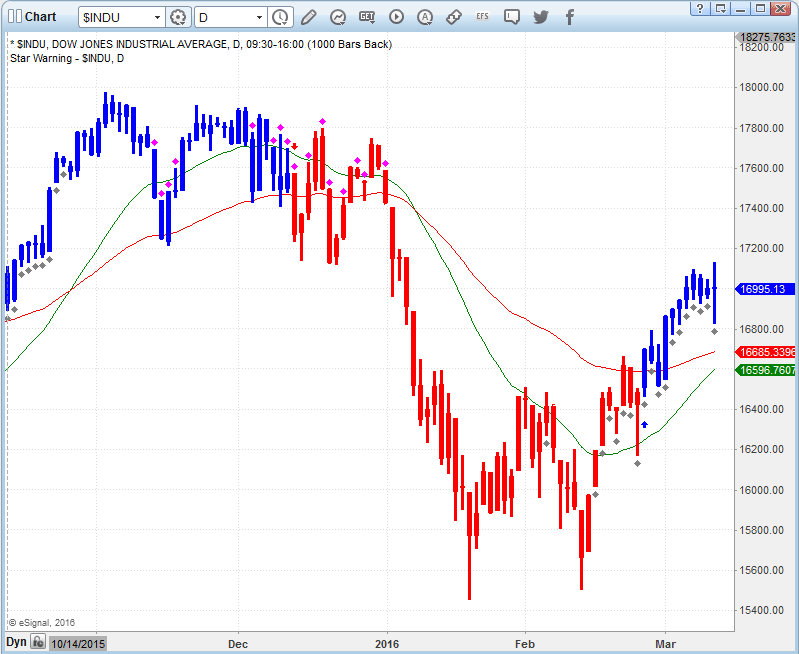
FIGURE 2: eSIGNAL. Here is an example of the Star_MA
study plotted on a daily chart of $INDU.
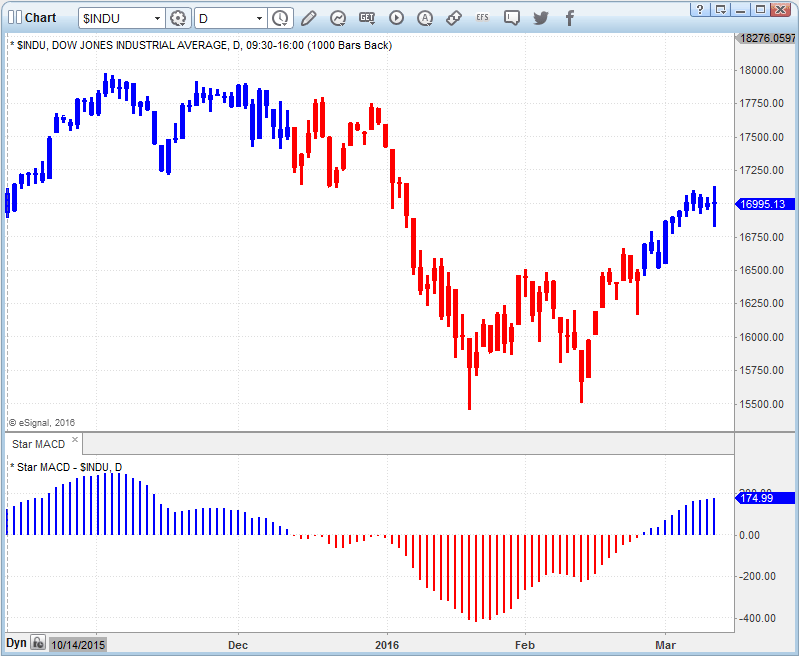
FIGURE 3: eSIGNAL. Here is an example of the Star_MACD
study plotted on a daily chart of $INDU.
To discuss this study or download a complete copy of the formula code, please
visit the EFS Library Discussion Board forum under the forums link
from the support menu at www.esignal.com or
visit our EFS KnowledgeBase at https://www.esignal.com/support/kb/efs/.
The eSignal formula scripts (EFS) are also available below.
Star_MA.efs:
/*********************************

Provided By:

    Interactive Data Corporation (Copyright © 2015)

    All rights reserved. This sample eSignal Formula Script (EFS)

    is for educational purposes only. Interactive Data Corporation

    reserves the right to modify and overwrite this EFS file with

    each new release.


Description:

    Xxxxxxx by Barbara Star


Formula Parameters:                     Default:

Fast MACD Length                        12

Slow MACD Length                        26

Weighted Average Length                 34

Exponential Average Length              55

Default Price Bar Color                 dark grey

Color Price Bars based on MACD          true

Color when MACD above 0                 blue

Color when MACD below 0                 red

Show Arrow at MACD crossing 0           true

Up Arrow Color                          blue

Down Arrow Color                        red

Show Warning Diamonds                   true

Upper Diamond Color                     magenta

Lower Diamond Color                     grey

Show Parameters                         false


Version:            1.00  11/23/2015


Notes:

    The related article is copyrighted material. If you are not a subscriber

    of Stocks & Commodities, please visit www.traders.com.


**********************************/


var fpArray = new Array();


function preMain(){


    setPriceStudy(true)

    setStudyTitle("Star Warning");

    setCursorLabelName("AvgW",0);

    setCursorLabelName("AvgE",1);

    setDefaultBarFgColor(Color.green, 0);

    setDefaultBarFgColor(Color.red, 1);

    setDefaultBarThickness(1,0);

    setDefaultBarThickness(1,1);

    setColorPriceBars(true);

    setDefaultPriceBarColor(Color.RGB(110,110,110));


    var x=0;

    fpArray[x] = new FunctionParameter("Fast", FunctionParameter.NUMBER);

	with(fpArray[x++]){

        setName("Fast MACD Length");

        setLowerLimit(1);

        setDefault(12);

    }

    fpArray[x] = new FunctionParameter("Slow", FunctionParameter.NUMBER);

	with(fpArray[x++]){

        setName("Slow MACD Length");

        setLowerLimit(1);

        setDefault(26);

    }

    fpArray[x] = new FunctionParameter("AvgW", FunctionParameter.NUMBER);

	with(fpArray[x++]){

        setName("Weighted Avg Length");

        setLowerLimit(1);

        setDefault(34);

    }

    fpArray[x] = new FunctionParameter("AvgE", FunctionParameter.NUMBER);

	with(fpArray[x++]){

        setName("Exponential Avg Length");

        setLowerLimit(1);

        setDefault(55);

    }

    fpArray[x] = new FunctionParameter("DefaultPBColor", FunctionParameter.COLOR);

	with(fpArray[x++]){

        setName("Default Price Bar Color");

        setDefault(Color.RGB(110,110,110));

    }

    fpArray[x] = new FunctionParameter("ColorPriceBars", FunctionParameter.BOOLEAN);

	with(fpArray[x++]){

        setName("Color Price Bars based on MACD");

        setDefault(true);

    }

    fpArray[x] = new FunctionParameter("MACDColorUp", FunctionParameter.COLOR);

	with(fpArray[x++]){

        setName("Color when MACD above 0");

        setDefault(Color.blue);

    }

    fpArray[x] = new FunctionParameter("MACDColorDn", FunctionParameter.COLOR);

	with(fpArray[x++]){

        setName("Color when MACD below 0");

        setDefault(Color.red);

    }

    fpArray[x] = new FunctionParameter("showArrow", FunctionParameter.BOOLEAN);

	with(fpArray[x++]){

        setName("Show Arrow at MACD crossing 0");

        setDefault(true);

    }

    fpArray[x] = new FunctionParameter("ArrowUp", FunctionParameter.COLOR);

	with(fpArray[x++]){

        setName("Up Arrow Color");

        setDefault(Color.blue);

    }

    fpArray[x] = new FunctionParameter("ArrowDn", FunctionParameter.COLOR);

	with(fpArray[x++]){

        setName("Down Arrow Color");

        setDefault(Color.red);

    }

    fpArray[x] = new FunctionParameter("showDiamond", FunctionParameter.BOOLEAN);

	with(fpArray[x++]){

        setName("Show Warning Diamonds");

        setDefault(true);

    }

    fpArray[x] = new FunctionParameter("DiamondUp", FunctionParameter.COLOR);

	with(fpArray[x++]){

        setName("Upper Diamond Color");

        setDefault(Color.magenta);

    }

    fpArray[x] = new FunctionParameter("DiamondDn", FunctionParameter.COLOR);

	with(fpArray[x++]){

        setName("Lower Diamond Color");

        setDefault(Color.grey);

    }

    fpArray[x] = new FunctionParameter("Params", FunctionParameter.BOOLEAN);

	with(fpArray[x++]){

        setName("Show Parameters");

        setDefault(false);

    }

}


var bInit = false;

var xMACD = null;

var xAvgW = null;

var xAvgE = null;

var bVersion = null;


function main(Fast, Slow, AvgW, AvgE, DefaultPBColor, ColorPriceBars, MACDColorUp, MACDColorDn,

              showArrow, ArrowUp, ArrowDn, showDiamond, DiamondUp, DiamondDn, Params){


    if (bVersion == null) bVersion = verify();

    if (bVersion == false) return;


    if(bInit == false){

        xMACD = macd(Fast, Slow, 1);

        xAvgW = wma(AvgW);

        xAvgE = ema(AvgE)

        setDefaultPriceBarColor(DefaultPBColor);

        setShowTitleParameters(eval(Params));

        bInit = true;

    }


    var nMACD = xMACD.getValue(0);

    var nMACD_1 = xMACD.getValue(-1);

    var nAvgW = xAvgW.getValue(0);

    var nAvgE = xAvgE.getValue(0);

    var nRawtime = rawtime(0);


    if(nMACD_1 == null || nAvgW == null || nAvgE == null) return;


    if(ColorPriceBars){

        if(nMACD > 0){

            setPriceBarColor(MACDColorUp);

        }

        if(nMACD < 0){

            setPriceBarColor(MACDColorDn);

        }

    }


    if(showArrow){

        if(nMACD > 0 && nMACD_1 <= 0){

            drawShape(Shape.UPARROW, BelowBar2, ArrowUp, "UpArrow"+nRawtime);

        } else {

            removeShape("UpArrow"+nRawtime);

        }

        if(nMACD < 0 && nMACD_1 >= 0){

            drawShape(Shape.DOWNARROW, AboveBar2, ArrowDn, "DnArrow"+nRawtime);

        } else {

            removeShape("DnArrow"+nRawtime);

        }

    }


    if(showDiamond){

        if(close(0) < nAvgW && high(0) >= nAvgE){

           drawShape(Shape.DIAMOND, AboveBar1, DiamondUp,  "UpDiamond"+nRawtime);

        } else {

            removeShape("UpDiamond"+nRawtime);

        }

        if(nAvgE > nAvgW && close(0) > nAvgW){

            drawShape(Shape.DIAMOND, BelowBar1, DiamondDn, "DnDiamond"+nRawtime);

        } else {

            removeShape("DnDiamond"+nRawtime);

        }

    }


    return [nAvgW, nAvgE];

}


function verify(){


    var b = false;

    if (getBuildNumber() < 779){


        drawTextAbsolute(5, 35, "This study requires version 10.6 or later.",

            Color.white, Color.blue, Text.RELATIVETOBOTTOM|Text.RELATIVETOLEFT|Text.BOLD|Text.LEFT,

            null, 13, "error");

        drawTextAbsolute(5, 20, "Click HERE to upgrade.@URL=https://www.esignal.com/download/default.asp",

            Color.white, Color.blue, Text.RELATIVETOBOTTOM|Text.RELATIVETOLEFT|Text.BOLD|Text.LEFT,

            null, 13, "upgrade");

        return b;

    }

    else

        b = true;


    return b;

}
Star_MACD.efs:
/*********************************

Provided By:

    Interactive Data Corporation (Copyright © 2015)

    All rights reserved. This sample eSignal Formula Script (EFS)

    is for educational purposes only. Interactive Data Corporation

    reserves the right to modify and overwrite this EFS file with

    each new release.


Description:

    Xxxxxxx by Barbara Star


Formula Parameters:                     Default:

Fast MACD Length                        12

Slow MACD Length                        26

Default MACD Color                      blue

Default Price Bar Color                 dark grey

Color MACD                              true

Color Price Bars based on MACD          true

Color when MACD above 0                 blue

Color when MACD below 0                 red

Show Parameters                         false


Version:            1.00  11/23/2015


Notes:

    The related article is copyrighted material. If you are not a subscriber

    of Stocks & Commodities, please visit www.traders.com.


**********************************/


var fpArray = new Array();


function preMain(){


    setStudyTitle("Star MACD");

    setCursorLabelName("MACD",0);

    setDefaultBarFgColor(Color.RGB(0xFE,0x00,0x6D), 0);

    setPlotType(PLOTTYPE_HISTOGRAM,0);

    setDefaultBarThickness(2,0);

    setColorPriceBars(true);

    setDefaultPriceBarColor(Color.RGB(110,110,110));


    var x=0;

    fpArray[x] = new FunctionParameter("Fast", FunctionParameter.NUMBER);

	with(fpArray[x++]){

        setName("Fast MACD Length");

        setLowerLimit(1);

        setDefault(12);

    }

    fpArray[x] = new FunctionParameter("Slow", FunctionParameter.NUMBER);

	with(fpArray[x++]){

        setName("Slow MACD Length");

        setLowerLimit(1);

        setDefault(26);

    }

    fpArray[x] = new FunctionParameter("DefaultMACDColor", FunctionParameter.COLOR);

	with(fpArray[x++]){

        setName("Default MACD Color");

        setDefault(Color.blue);

    }

    fpArray[x] = new FunctionParameter("DefaultPBColor", FunctionParameter.COLOR);

	with(fpArray[x++]){

        setName("Default Price Bar Color");

        setDefault(Color.RGB(110,110,110));

    }

    fpArray[x] = new FunctionParameter("ColorMACD", FunctionParameter.BOOLEAN);

	with(fpArray[x++]){

        setName("Color MACD");

        setDefault(true);

    }

    fpArray[x] = new FunctionParameter("ColorPriceBars", FunctionParameter.BOOLEAN);

	with(fpArray[x++]){

        setName("Color Price Bars based on MACD");

        setDefault(true);

    }

    fpArray[x] = new FunctionParameter("MACDColorUp", FunctionParameter.COLOR);

	with(fpArray[x++]){

        setName("Color when MACD above 0");

        setDefault(Color.blue);

    }

    fpArray[x] = new FunctionParameter("MACDColorDn", FunctionParameter.COLOR);

	with(fpArray[x++]){

        setName("Color when MACD below 0");

        setDefault(Color.red);

    }

    fpArray[x] = new FunctionParameter("Params", FunctionParameter.BOOLEAN);

	with(fpArray[x++]){

        setName("Show Parameters");

        setDefault(false);

    }

}


var bInit = false;

var xMACD = null;

var bVersion = null;


function main(Fast, Slow, DefaultMACDColor, DefaultPBColor, ColorMACD, ColorPriceBars, MACDColorUp, MACDColorDn, Params){


    if (bVersion == null) bVersion = verify();

    if (bVersion == false) return;


    if(bInit == false){

        xMACD = macd(Fast, Slow, 1);

        setDefaultPriceBarColor(DefaultPBColor);

        setDefaultBarFgColor(DefaultMACDColor);

        setShowTitleParameters(eval(Params));

        bInit = true;

    }


    var nMACD = xMACD.getValue(0);


    if(nMACD == null) return;


    if(nMACD > 0){

        if(ColorMACD){

            setBarFgColor(MACDColorUp,0);

        }

        if(ColorPriceBars){

            setPriceBarColor(MACDColorUp);

        }

    }

    if(nMACD < 0){

        if(ColorMACD){

            setBarFgColor(MACDColorDn,0);

        }

        if(ColorPriceBars){

            setPriceBarColor(MACDColorDn);

        }

    }


    return nMACD;

}


function verify(){


    var b = false;

    if (getBuildNumber() < 779){

        drawTextAbsolute(5, 35, "This study requires version 10.6 or later.",

            Color.white, Color.blue, Text.RELATIVETOBOTTOM|Text.RELATIVETOLEFT|Text.BOLD|Text.LEFT,

            null, 13, "error");

        drawTextAbsolute(5, 20, "Click HERE to upgrade.@URL=https://www.esignal.com/download/default.asp",

            Color.white, Color.blue, Text.RELATIVETOBOTTOM|Text.RELATIVETOLEFT|Text.BOLD|Text.LEFT,

            null, 13, "upgrade");

        return b;

    }

    else

        b = true;


    return b;

}
—Eric Lippert
eSignal, an Interactive Data company
800 779-6555, www.eSignal.com
BACK TO LIST

WEALTH-LAB: MAY 2016
We’ll illustrate the application of methods described in Barbara Star’s article
in this issue, “Zero In On The MACD,” with two example strategies, long-only
and short-only.
The first one enters long when price is above the 55-period EMA and when the
price bars are blue—that is, after the crossover with the MACD’s zero line
has taken place. In addition, you can drag the slider in the lower-left corner
to activate “warnings.” To highlight this trade filter, the bars are painted
orange when the EMA is above the 34-period WMA and the price closes above the
WMA (see Figure 4).
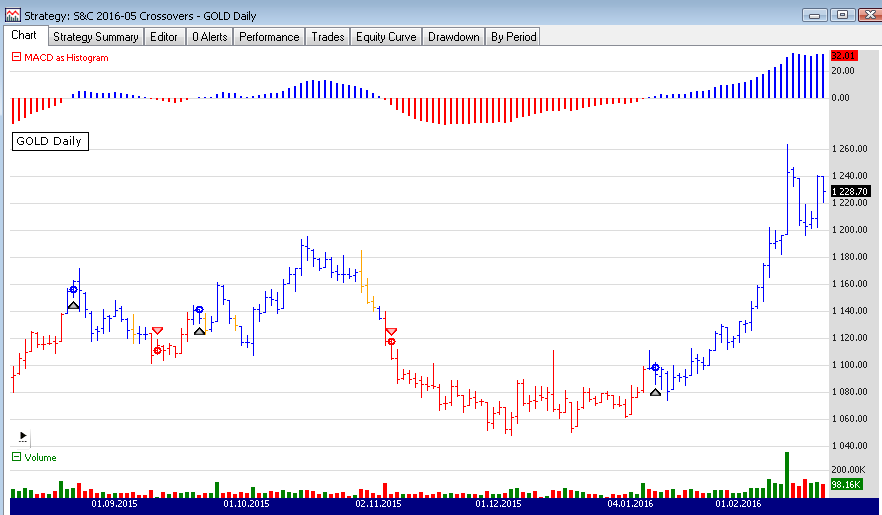
FIGURE 4: WEALTH-LAB. Riding the bullish trend in gold
in the winter of 2016.
The second method attempts to profit on divergence reversals. When price moves
higher but the MACD does not reflect that move, creating a lower top, the strategy
fades the move as illustrated on Figure 5 and exits after a specified number
of bars.
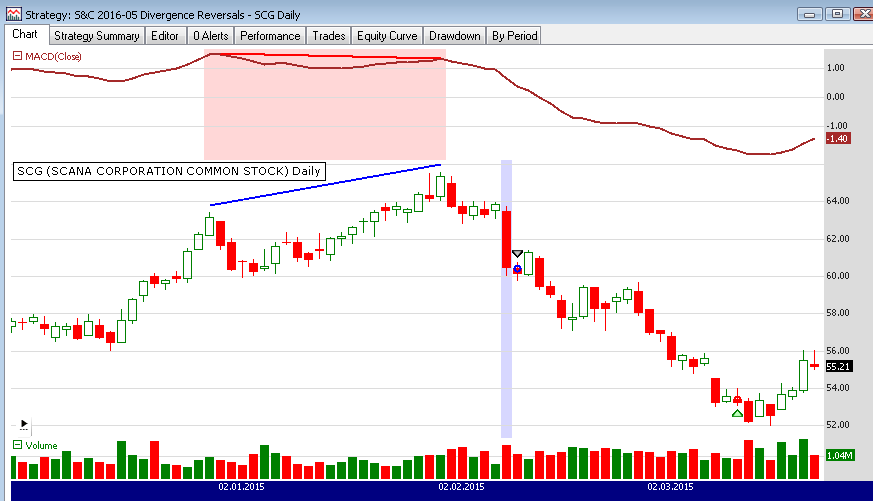
FIGURE 5: WEALTH-LAB. Here’s an example of shorting a
price top not confirmed by an MACD bearish divergence in SCG (Scana Corp.)
in February 2015.
CODE 1
using System;
using System.Collections.Generic;
using System.Text;
using System.Drawing;
using WealthLab;
using WealthLab.Indicators;

namespace WealthLab.Strategies
{
	public class TASCMay2016_Crossovers : WealthScript
	{
		private StrategyParameter paramUseWarnings;

		public TASCMay2016_Crossovers()
		{
			paramUseWarnings = CreateParameter("Filter Warnings",0,0,1,1);
		}

		protected override void Execute()
		{
			var wma = WMA.Series(Close,34);
			var ema = EMA.Series(Close,55,EMACalculation.Modern);
			var macd = MACD.Series(Close);
			bool avoidWarningBars = paramUseWarnings.ValueInt == 1 ? true : false;

			macd.Description = "MACD as Histogram";
			ChartPane MACDPane = CreatePane(25, true, true);
			PlotSeries(MACDPane, macd, Color.Red, LineStyle.Histogram, 2);

			for (int bar = GetTradingLoopStartBar(55 * 3); bar < Bars.Count; bar++)
			{
				bool isBarBlue = false;
				bool isAboveMA = Close[bar] > ema[bar];
				bool isWarning = (Close[bar] < wma[bar]) && (High[bar] > ema[bar]);

				if ( macd[bar] > 0 )
				{
					SetSeriesBarColor( bar, macd, Color.Blue );
					SetBarColor( bar, Color.Blue );
					isBarBlue = true;

					if( isWarning )
						SetBarColor( bar, Color.Orange );
				}
				else if ( macd[bar] < 0 )
				{
					SetSeriesBarColor( bar, macd, Color.Red );
					SetBarColor( bar, Color.Red );
				}

				if ( (CrossOver(bar, macd, 0) && !avoidWarningBars) ||
					(CrossOver(bar, macd, 0) && avoidWarningBars && !isWarning) )
					BuyAtMarket(bar + 1);

				if (CrossUnder(bar, macd, 0))
					SellAtMarket(bar + 1, Position.AllPositions, "MACD");
			}
		}
	}
}
CODE 2 (Courtesy Robert Sucher)
using System;
using System.Collections.Generic;
using System.Text;
using System.Drawing;
using WealthLab;
using WealthLab.Indicators;

namespace WealthLab.Strategies
{
	public class TASCMay2016_Divergences : WealthScript
	{
		private StrategyParameter peakPctPrice;
		private StrategyParameter peakPctIndicator;
		private StrategyParameter exitBars;

		public TASCMay2016_Divergences()
		{
			peakPctPrice = CreateParameter("Price Peak%", 4, 2, 10, 1);
			peakPctIndicator = CreateParameter("Indctr Peak%", 20, 5, 30, 1);
			exitBars = CreateParameter("Exit bars", 20, 1, 30, 1);
		}

		// Strategy logic
		protected override void Execute()
		{
			int pkPctPrice = peakPctPrice.ValueInt;
			int pkPctIndicator = peakPctIndicator.ValueInt;
			int barsToHold = exitBars.ValueInt;
			int lastDetectedBar = 0;
			_barLastChecked = 0;

			DataSeries rsi = MACD.Series(Close);
			ChartPane rsiPane = CreatePane(40, true, true);
			PlotSeries(rsiPane, rsi, Color.Brown, WealthLab.LineStyle.Solid, 2);
			for(int bar = 20; bar < Bars.Count; bar++)
			{
				if (IsLastPositionActive) {
					Position p = LastPosition;
					if (bar + 1 - p.EntryBar >= barsToHold)
						CoverAtMarket(bar + 1, p);
				}
				else if (PeakDivergence(bar, Close, pkPctPrice, rsi, pkPctIndicator, rsiPane))
				if( ShortAtMarket( bar+1 ) != null )
					LastPosition.Priority = Close[bar];
			}
		}

		// Returns true if divergence with indicator detected on the specified bar
		public bool PeakDivergence(int bar, DataSeries price, double pctRev1, DataSeries ind, double pctRev2, ChartPane indPane)
		{
			bool divergeDetected = false;
			PeakTroughMode mode = PeakTroughMode.Percent;
			int pb1 = (int)PeakBar.Value(bar, price, pctRev1, mode);
			if (pb1 > _barLastChecked)	{
				_barLastChecked = pb1;
				int pb2 = (int)PeakBar.Value(pb1, price, pctRev1, mode);
				if (pb2 > -1) {
					int testBar = Math.Min(bar, pb1 + proxBars);
					int ibar1 = (int)PeakBar.Value( testBar, ind, pctRev2, mode);
					// test peak proximity
					if (Math.Abs(pb1 - ibar1) > proxBars) ibar1 = pb1;
					int span = Math.Min(pb1 - pb2 - 1, proxBars);
					testBar = Math.Min(ibar1 - 1, pb2 + span);
					int ibar2 = (int)PeakBar.Value( testBar, ind, pctRev2, mode);
					if (ibar2 < 0) ibar2 = 0;
					if (Math.Abs(pb2 - ibar2) > proxBars) ibar2 = pb2;
					divergeDetected = Math.Sign(price[pb1] - price[pb2]) != Math.Sign(ind[ibar1] - ind[ibar2]);
					if (divergeDetected) {
						// Highlight bar detected
						SetPaneBackgroundColor(PricePane, bar, Color.FromArgb(40, Color.Blue));
						DrawLine(PricePane, pb1, price[pb1] * 1.01, pb2, price[pb2] * 1.01, Color.Blue, LineStyle.Solid, 2);
						DrawLine(indPane, ibar1, ind[ibar1] * 1.01, ibar2, ind[ibar2] * 1.01, Color.Red, LineStyle.Solid, 2);
						if (Math.Sign(price[pb1] - price[pb2]) == 1)
							for (int b = pb2; b <= pb1; b++)
								SetPaneBackgroundColor(indPane, b, Color.FromArgb(40, Color.Red));
					}
				}
			}
			return divergeDetected;
		}
		private const int proxBars = 6;
		private int _barLastChecked = 0;
	}
}
—Eugene, Wealth-Lab team
MS123, LLC
www.wealth-lab.com
BACK TO LIST

NEUROSHELL TRADER: MAY 2016
The indicators and signals described by Barbara Star in her article in this
issue, “Zero In On The MACD,” can be easily implemented in NeuroShell Trader.
Simply select new indicator from the insert menu and use
the indicator wizard to create the following indicators in the graphing style
listed:
MACD Histogram (Graph in Histogram Style)
MACD(Close,12,26)

MACD Buy/Sell Signals (Graph in Point Style)
IfThenElse(CrossAbove(MACD(Close,12,26),0),Mul2(High,1.02),*)
IfThenElse(CrossBelow(MACD(Close,12,26),0),Mul2(Low,0.98),*)

MACD Price Coloring (Graph in Line Style)
IfThenElse(A>B(MACD(Close,12,26),0),Close,*)
IfThenElse(A<B(MACD(Close,12,26),0),Close,*)

Weighted and Exponential Average Lines (Graph in Line Style)
LinWgtAvg(Close,34)
ExpAvg(Close,55)

Diamond Warning Symbols (Graph in Point Style)
IfThenElse(And2(A<B(Close,LinWgtAvg(Close,34)),A>B(High,ExpAvg(Close,55))),Mul2(High,1.01),*)
IfThenElse(And2(A>B(ExpAvg(Close,55),LinWgtAvg(Close,34)),A>B(Close,LinWgtAvg(Close,34))),Mul2(Low,0.99),*)

Aroon Indicators (Graph in Line Style)
Aroon Down(Low,25)
Aroon Up(Low,25)

Aroon Crossover Signals (Graph in Line Style)
IfThenElse(CrossAbove(Aroon Up(Low,25),Aroon Down(Low,25)),Aroon Down(Low,25),*)
IfThenElse(CrossBelow(Aroon Up(Low,25),Aroon Down(Low,25)),Aroon Up(Low,25),*)
Note that the aroon-up and aroon-down indicators are found in the Advanced
Indicator Set 1 add-on. Users of NeuroShell Trader can go to the STOCKS & COMMODITIES
section of the NeuroShell Trader free technical support website to download
a copy of this or any previous Traders’ Tips.
A sample chart is shown in Figure 6.

FIGURE 6: NEUROSHELL TRADER. This NeuroShell Trader chart
displays the MACD histogram, signals & price colors, the weighted and
exponential average lines & signals, and the aroon lines, and crossover
signals.
—Marge Sherald, Ward Systems Group, Inc.
301 662-7950, sales@wardsystems.com
www.neuroshell.com
BACK TO LIST

AIQ: MAY 2016
The AIQ code based on Barbara Star’s article in this issue, “Zero In On The
MACD,” is provided at www.TradersEdgeSystems.com/traderstips.htm,
and is also shown below.
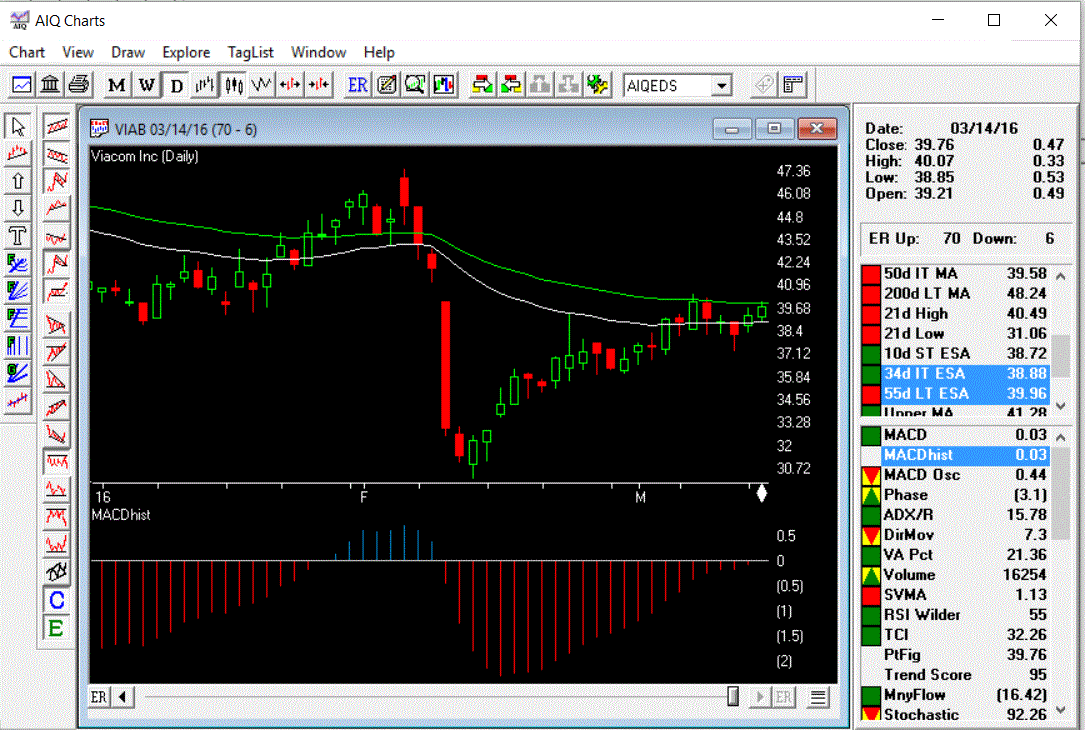
FIGURE 7: AIQ. Here is a sample chart of VIAB with MACDhist,
the color bars, and the 34- and 55-bar EMAs.
Figure 7 shows the MACD histogram on a chart of Viacom (VIAB) with the color
bars and the 34- and 55-bar exponential moving averages (EMA). Note that I
did not code the weighted moving average (WMA) but substituted the EMA for
the WMA. I chose to view the chart of VIAB by running the EDS “Zero MACD.eds”
on 3/14/2016 and examining the alert messages on the report “List.” VIAB is
the only one on that date that showed a cross up on the MACDhist (see Figure
8 for a look at part of this report for 3/14/2016).
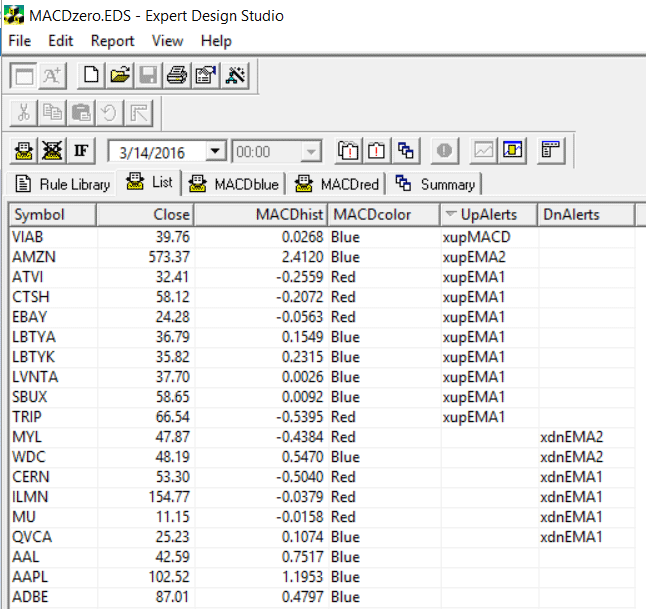
FIGURE 8: AIQ. This shows part of the EDS custom report
“List” that shows the MACDhist values on 3/14/2016, the color status, and
any alerts that were generated for that day.
! ZERO IN ON THE MACD

! Author: Barbara Star, TASC May 2016

! Coded by: Richard Denning 3/14/16

! www.TradersEdgeSystems.com


! INPUTS:

macd1 	is 	12.

macd2 	is 	26.

macdSig	is 	1.


! INDICATORS:

emaST 	is expavg([Close],macd1).

emaLT 	is expavg([Close],macd2).

MACD 	is emaST - emaLT.		! MACD line

SigMACD is expavg(MACD,macdSig).	! MACD Signal line

MACDosc is MACD - SigMACD.	! MACD Oscillator


HD if hasdatafor(macd2) = macd2.

MACDhist is MACD.                                 ! plot as historigram

MACDblue if MACDhist > 0.		! use these rules to color MACDhist

MACDred	 if MACDhist < 0.		! use these rules to color MACDhist

MACDcolor is iff(MACDblue and HD,"Blue",iff(MACDred and HD,"Red","White")). !for report list

List if 1.


!ALERTS:

EMA1 is expavg([close],34).

EMA2 is expavg([close],55).

xupEMA1 if [close] > EMA1 and valrule([close] < EMA1,1).

xdnEMA1 if [close] < EMA1 and valrule([close] > EMA1,1).

xupEMA2 if [close] > EMA2 and valrule([close] < EMA2,1).

xdnEMA2 if [close] < EMA2 and valrule([close] > EMA2,1).

xupMACD if MACDhist > 0 and valrule(MACDhist < 0,1).

xdnMACD if MACDhist < 0 and valrule(MACDhist > 0,1).

UpAlerts is iff(xupEMA1,"xupEMA1",iff(xupEMA2,"xupEMA2",iff(xupMACD,"xupMACD"," "))).

DnAlerts is iff(xdnEMA1,"xdnEMA1",iff(xdnEMA2,"xdnEMA2",iff(xdnMACD,"xdnMACD"," "))).
The code and EDS file can be downloaded from www.TradersEdgeSystems.com/traderstips.htm.
—Richard Denning
info@TradersEdgeSystems.com
for AIQ Systems
BACK TO LIST

TRADERSSTUDIO: MAY 2016
The TradersStudio code based on Barbara Star’s article in this issue, “Zero
In On The MACD,” can be found at www.TradersEdgeSystems.com/traderstips.htm.
The following code file is provided in the download:
- Indicator: ZERO_MACD_IND—An indicator plot to show the zero MACD and the
color bar study.
Figure 9 shows the MACD on a chart of Apple Inc. (AAPL) with the color bars
that are based on whether the MACD is above zero (blue bars) or below zero
(red bars).
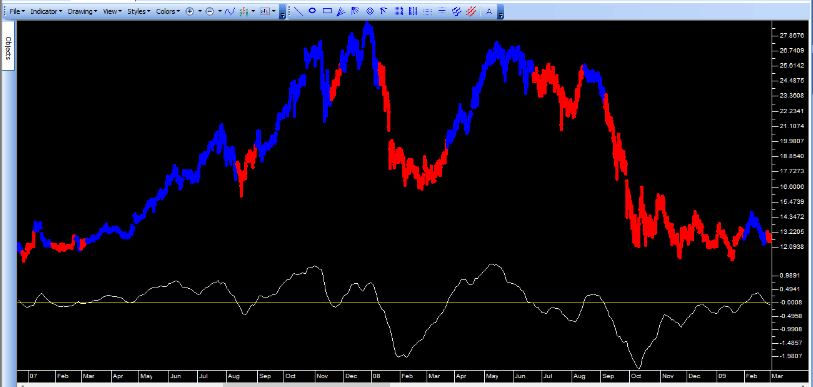
FIGURE 9: TRADERSSTUDIO. Here is a sample chart of AAPL
showing the zero MACD color bars.
The code is shown here:
' ZERO IN ON THE MACD

' Author: Barbara Star, TASC May 2016

' Coded by: Richard Denning 3/15/2016

' www.TradersEdgeSystems.com


sub ZERO_MACD_IND(mdLen1,mdLen2,mdLen3)

Dim zMACD As BarArray

zMACD = (macd(C,mdLen1,mdLen2,mdLen3))

If zMACD > 0 Then

    barcolor(0) = vbBlue

Else If zMACD < 0 Then

    barcolor(0) = vbRed

Else

    barcolor(0) = vbWhite

EndIf

EndIf


plot1(zMACD)

plot2(0)

End Sub
—Richard Denning
info@TradersEdgeSystems.com
for TradersStudio
BACK TO LIST

NINJATRADER: MAY 2016
A variation of the MACD indicator, as discussed in Barbara Star’s article
in this issue, “Zero In On The MACD,” is available for download at www.ninjatrader.com/SC/May2016SC.zip.
Once you have it downloaded, from within the NinjaTrader Control Center window,
select the menu File → Utilities → Import NinjaScript and select
the downloaded file. This file is for NinjaTrader version 7.
You can review the indicator’s source code by selecting the menu Tools → Edit
NinjaScript → Indicator from within the NinjaTrader Control Center window
and selecting the MACDVariation file.
Note that adding the indicator to a chart will not automatically add the EMA
and WMA indicators; these will need to be manually added. Ensure that the periods
match the periods specified in the MACDVariation indicator.
NinjaScript uses compiled DLLs that run native, not interpreted, to provide
the highest performance possible.
A sample chart implementing the strategy is shown in Figure 10.

FIGURE 10: NINJATRADER. Here, the MACD variation indicator
is displayed on a daily chart of FSLR.
—Raymond Deux & Zachary Gauld
NinjaTrader, LLC
www.ninjatrader.com
BACK TO LIST

UPDATA: MAY 2016
Our Traders’ Tip for this month is based on the article “Zero In On The MACD”
by Barbara Star in this issue.
In the article, Star seeks to develop the classic MACD indicator by improving
the visual aspect such that candles are colored according to the MACD position
relative to the zero line—blue above and red below (Figure 11). In addition,
the MACD itself is shown as a histogram as opposed to a solid line as traditionally
displayed.
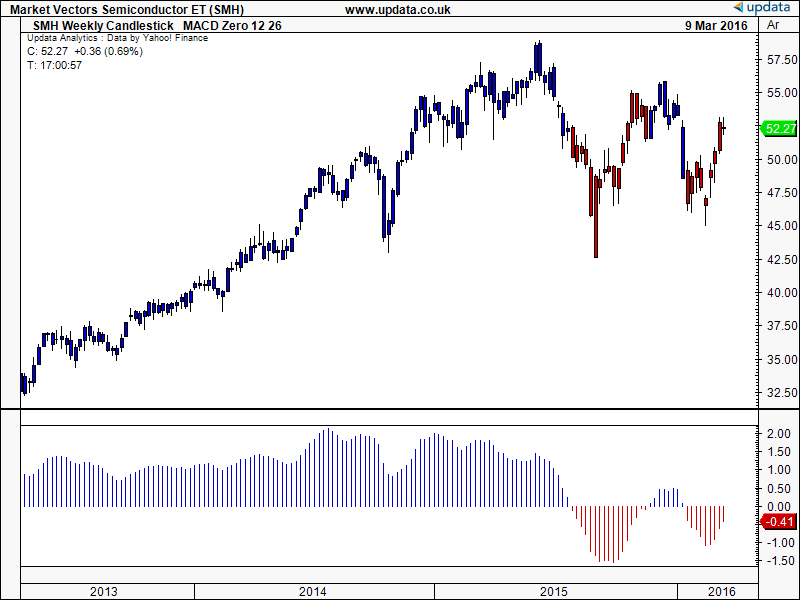
FIGURE 11: UPDATA. Here, the MACD zero indicator is applied
to the Market Vectors Semi-Conductor ETF (SMH) in weekly resolution.
The Updata code is in the Updata library and may be downloaded by clicking
the custom menu and indicator library. Those who cannot access
the library due to a firewall may paste the code shown below into the Updata
custom editor and save it.
DISPLAYSTYLE 2LINES
INDICATORTYPE TOOL
INDICATORTYPE2 CHART
PLOTSTYLE CANDLE
PLOTSTYLE2 HISTOGRAM
NAME MACD Zero
PARAMETER "MACD Period 1" #PERIOD1=12
PARAMETER "MACD Period 2" #PERIOD2=26
@MACD=0
FOR #CURDATE=#PERIOD1+#PERIOD2 TO #LASTDATE
   'INDICATORS
   @MACD=MACD(#PERIOD1,#PERIOD2,E)
   @PLOTOPEN=OPEN
   @PLOTLOW=LOW
   @PLOTHIGH=HIGH
   @PLOT=CLOSE
   'PLOTS
   IF @MACD>=0
      COLOUR RGB(0,0,200)
      COLOUR2 RGB(0,0,200)
   ELSE
      COLOUR RGB(200,0,0)
      COLOUR2 RGB(200,0,0)
   ENDIF
   @PLOT2=@MACD
NEXT
—Updata support team
support@updata.co.uk
www.updata.co.uk
BACK TO LIST
MICROSOFT EXCEL: MAY 2016
In “Zero In On The MACD” in this issue, author Barbara Star combines a set
of tools that make for a good first-cut look at the behavior of something you
might be considering for a trade.
To begin, we have a couple of ways to look at the MACD indicator.
- First, one can observe divergences between the
MACD and the price behavior as potential advance warnings of trend changes.
- Second, as noted in the article, the MACD combined
with its standard signal line generates lots of signals; perhaps too many
signals to trade profitably (see Figure 12).
- Third, if we drop the signal line and just go
with the MACD zero cross as our signal, our potential trade signals drop
to a much less frenetic pace. Here, Star suggests using price bar colors
to reflect these MACD indicated trend changes.
While it is possible to color-code price candlesticks on demand in Excel,
the process is tedious, at best. It is much easier to color the background
of the price chart per the MACD. This approach has the added benefit of retaining
the up bar and down bar information contained in the standard candlestick
colors (Figure 13).

FIGURE 12: EXCEL. Here is the MACD with MACD signal line.
Next, Star suggests adding a couple of moving averages to the price chart
that contribute to the generation of cautionary diamonds on the chart. These
warn of possible, but not necessarily confirmed, approaching price trend changes
(also Figure 13).

FIGURE 13: EXCEL. Here, the background colors per MACD
with averages and cautionary points are displayed.
Finally, Star uses the aroon indicator to provide an additional set of trend
change hints (Figure 14).

FIGURE 14: EXCEL, aroon alerts
With the charts tab set for your favorite tradable and handy for your reference,
it is well worth a couple of close rereadings of this article to fully understand
Star’s interpretations of these indicators, both at the trend change points,
and also as a trend evolves over time. Enjoy!
The spreadsheet file for this Traders’ Tip can be downloaded here.
To successfully download it, follow these steps:
- Right-click on the Excel file link ZeroInOnMacd.xlsm,
then
- Select “save as” (or “save target as”) to place
a copy of the spreadsheet file on your hard drive.
—Ron McAllister
Excel and VBA programmer
rpmac_xltt@sprynet.com
BACK TO LIST
Originally published in the May 2016 issue of
Technical Analysis of STOCKS & COMMODITIES magazine.
All rights reserved. © Copyright 2016, Technical Analysis, Inc.


