TRADERS’ TIPS
July 2016

For this month’s Traders’ Tips, the focus is John Ehlers’ article
in this issue, “The Super Passband Filter.” Here, we present
the July 2016 Traders’ Tips code with possible implementations in various
software.
The Traders’ Tips section is provided to help the reader implement
a selected technique from an article in this issue or another recent issue.
The entries here are contributed by software developers or programmers for
software that is capable of customization.

TRADESTATION: JULY 2016
In “The Super Passband Filter” in this issue, author John Ehlers describes
a new oscillator he’s developed to help minimize computational lag. Ehlers
calls this new oscillator a super passband filter. He has designed it to reject
very low-frequency components and thus display as an oscillator as well as
reject high-frequency components so as to minimize noise.
For convenience, we are providing TradeStation code for super passband filter
indicators. In addition, we are providing EasyLanguage code for a TradeStation
strategy based on the super passband filter calculation.
//Super Passband Filter
// (c) 2016 John F. Ehlers
// TASC JUL 2016
inputs:
	Period1( 40 ),
	Period2( 60 ) ;
variables:
	a1( 0 ),
	a2( 0 ),
	PB( 0 ),
	count( 0 ),
	RMS( 0 ) ;

a1 = 5 / Period1 ;
a2 = 5 / Period2 ;

PB = (a1 - a2) * Close + (a2*(1 - a1) - a1 * (1 - a2))
	* Close[1] + ((1 - a1) + (1 - a2))*PB[1] - (1 - a1)
	* (1 - a2)*PB[2] ;

RMS = 0;
for count = 0 to 49
	begin
	RMS = RMS + PB[count]*PB[count] ;
	end ;

RMS = SquareRoot( RMS / 50 ) ;

Plot1( PB, "Super PB" ) ;
Plot2( 0, "Zero Line" ) ;
Plot3( RMS, "+RMB" ) ;
Plot7(-RMS, "-RMS" ) ;


Strategy: Super Passband Filter

//Super Passband Filter
// (c) 2016 John F. Ehlers
// TASC JUL 2016
inputs:
	Period1( 40 ),
	Period2( 60 ),
	UseZeroLineTarget( true ),
	UseReversalStop( true );

variables:
	a1( 0 ),
	a2( 0 ),
	PB( 0 ),
	count( 0 ),
	RMS( 0 ) ;

a1 = 5 / Period1 ;
a2 = 5 / Period2 ;

PB = (a1 - a2) * Close + (a2*(1 - a1) - a1 * (1 - a2))
	* Close[1] + ((1 - a1) + (1 - a2))*PB[1] - (1 - a1)
	* (1 - a2)*PB[2] ;

RMS = 0;
for count = 0 to 49
	begin
	RMS = RMS + PB[count]*PB[count] ;
	end ;

RMS = SquareRoot( RMS / 50 ) ;

if PB crosses over -RMS then
	Buy next bar at Market
else if PB crosses under RMS then
	Sell Short next bar at Market ;

if UseZeroLineTarget then
	begin
	if PB crosses over 0 then
		Sell next bar at Market
	else if PB crosses under 0 then
		Buy to cover next bar at Market ;
	end ;

If UseReversalStop then
	begin
	if PB crosses under -RMS then
		Sell next bar at Market
	else if PB crosses over RMS then
		Buy to cover next bar at Market ;
	end ;
To download the EasyLanguage code, please visit our TradeStation and EasyLanguage
support forum. The code can be found here: https://community.tradestation.com/Discussions/Topic.aspx?Topic_ID=142776.
The ELD filename is “TASC_JUL2016.ELD.”
For more information about EasyLanguage in general please see https://www.tradestation.com/EL-FAQ.
A sample chart is shown in Figure 1.

FIGURE 1: TRADESTATION. Here is an example of the super
passband filter indicator and strategy applied to a daily chart of the S&P
500 index.
This article is for informational purposes. No type of trading or investment
recommendation, advice, or strategy is being made, given, or in any manner
provided by TradeStation Securities or its affiliates.
—Doug McCrary
TradeStation Securities, Inc.
www.TradeStation.com
BACK TO LIST

METASTOCK: JULY 2016
In “The Super Passband Filter” in this issue, John Ehlers presents his indicator
called the super passband filter and suggests ways to trade it. The MetaStock
formula given here for the indicator allows you to set whatever time periods
are desired for the filter. The buy & sell signal formula has set those
time periods as variables on the first two lines. If you wish to use different
time periods, you must change those two lines in all four formulas or else
the signals will not align.
Indicator:
Passband Filter
p1:= Input("short time periods", 1, 100, 40);
p2:= Input("long time periods", 2, 200, 60);
a1:= 5/p1;
a2:= 5/p2;
PB:= (a1-a2)*C + (a2*(1-a1)-a1*(1-a2))*Ref(C,-1) +
((1-a1) + (1-a2))*PREV - (1-a1)*(1-a2)*Ref(PREV,-1);
RMSa:= Sum( pb*pb, 50);
RMS:= Sqrt(RMSa/50);
pb;
0;
RMS;
-RMS
Trading Signals:
Enter Long:
p1:= 40;
p2:= 60;
a1:= 5/p1;
a2:= 5/p2;
PB:= (a1-a2)*C + (a2*(1-a1)-a1*(1-a2))*Ref(C,-1) +
((1-a1) + (1-a2))*PREV - (1-a1)*(1-a2)*Ref(PREV,-1);
RMSa:= Sum( pb*pb, 50);
RMS:= Sqrt(RMSa/50);
el:= Cross(pb,-RMS);
xl:= pb < Ref(pb, -1);
trade:= If(el, 1, If(xl, 0, PREV));
Cross(trade, 0.5)


Exit Long:
p1:= 40;
p2:= 60;
a1:= 5/p1;
a2:= 5/p2;
PB:= (a1-a2)*C + (a2*(1-a1)-a1*(1-a2))*Ref(C,-1) +
((1-a1) + (1-a2))*PREV - (1-a1)*(1-a2)*Ref(PREV,-1);
RMSa:= Sum( pb*pb, 50);
RMS:= Sqrt(RMSa/50);
el:= Cross(pb,-RMS);
xl:= pb < Ref(pb, -1);
trade:= If(el, 1, If(xl, 0, PREV));
Cross(0.5,trade)


Enter Short:
p1:= 40;
p2:= 60;
a1:= 5/p1;
a2:= 5/p2;
PB:= (a1-a2)*C + (a2*(1-a1)-a1*(1-a2))*Ref(C,-1) +
((1-a1) + (1-a2))*PREV - (1-a1)*(1-a2)*Ref(PREV,-1);
RMSa:= Sum( pb*pb, 50);
RMS:= Sqrt(RMSa/50);
es:= Cross(RMS,pb);
xs:= pb > Ref(pb, -1);
trade:= If(es, 1, If(xs, 0, PREV));
Cross(trade, 0.5)


Exit Short:
p1:= 40;
p2:= 60;
a1:= 5/p1;
a2:= 5/p2;
PB:= (a1-a2)*C + (a2*(1-a1)-a1*(1-a2))*Ref(C,-1) +
((1-a1) + (1-a2))*PREV - (1-a1)*(1-a2)*Ref(PREV,-1);
RMSa:= Sum( pb*pb, 50);
RMS:= Sqrt(RMSa/50);
es:= Cross(RMS,pb);
xs:= pb > Ref(pb, -1);
trade:= If(es, 1, If(xs, 0, PREV));
Cross(0.5, trade)
—William Golson
MetaStock Technical Support
www.metastock.com
BACK TO LIST

eSIGNAL: JULY 2016
For this month’s Traders’ Tip, we’ve provided the study SuperPassband.efs based
on the formula described in John Ehlers’ article in this issue, “The Super
Passband Filter.” In the article, Ehlers presents a method for filtering data
and how to apply the study to your trading.
The study contains formula parameters that may be configured through the edit
chart window (right-click on the chart and select “edit chart”). A sample
chart is shown in Figure 2.

FIGURE 2: eSIGNAL. Here is an example of the SuperPassband
study plotted on a daily chart of SPY.
To discuss this study or download a complete copy of the formula code, please
visit the EFS Library Discussion Board forum under the forums link
from the support menu at www.esignal.com or
visit our EFS KnowledgeBase at https://www.esignal.com/support/kb/efs/.
The eSignal formula script (EFS) is also available for copying & pasting
below.
/*********************************
Provided By:
eSignal (Copyright c eSignal), a division of Interactive Data
Corporation. 2016. All rights reserved. This sample eSignal
Formula Script (EFS) is for educational purposes only and may be
modified and saved under a new file name.  eSignal is not responsible
for the functionality once modified.  eSignal reserves the right
to modify and overwrite this EFS file with each new release.

Description:
    The Super Passband Filter by John F. Ehlers

Version:            1.00  05/05/2016

Formula Parameters:                     Default:
EMA Short Period                        40
EMA Long Period                         60
RMS Period                              50


Notes:
The related article is copyrighted material. If you are not a subscriber
of Stocks & Commodities, please visit www.traders.com.

**********************************/

var fpArray = new Array();

function preMain(){

    setPriceStudy(false);
    setCursorLabelName("SuperPB", 0);
    setDefaultBarFgColor(Color.RGB(0,148,255), 0);
    setCursorLabelName("+ RMS", 1);
    setDefaultBarFgColor(Color.RGB(255,155,0), 1);
    setCursorLabelName("- RMS", 2);
    setDefaultBarFgColor(Color.RGB(255,155,0), 2);

    var x=0;
    fpArray[x] = new FunctionParameter("EMAShort", FunctionParameter.NUMBER);
	with(fpArray[x++]){
        setName("EMA Short Period");
        setLowerLimit(1);
        setDefault(40);
    }
    fpArray[x] = new FunctionParameter("EMALong", FunctionParameter.NUMBER);
	with(fpArray[x++]){
        setName("EMA Long Period");
        setLowerLimit(1);
        setDefault(60);
    }
    fpArray[x] = new FunctionParameter("RMSPeriod", FunctionParameter.NUMBER);
	with(fpArray[x++]){
        setName("RMS Period");
        setLowerLimit(1);
        setDefault(50);
    }
}

var bInit = false;
var bVersion = null;
var a1 = 0;
var a2 = 0;
var xClose = null;
var xPB = null;
var xRMS = null;

function main(EMAShort, EMALong, RMSPeriod) {

    if (bVersion == null) bVersion = verify();
    if (bVersion == false) return;

    if(getBarState() == BARSTATE_ALLBARS){
        bInit = false;
    }

    if (getCurrentBarCount() < EMALong) return;

    if (!bInit){
        a1 = 5 / EMAShort;
        a2 = 5 / EMALong;
        xClose = close();
        addBand(0, PS_DASH, 1, Color.RGB(96,96,96), 4);
        xPB = efsInternal("Calc_PassBand", xClose, a1, a2);
        xRMS = efsInternal("Calc_RMS",xPB, RMSPeriod);
        bInit = true;
    }

    if (xPB.getValue(0) == null || xRMS.getValue(0) == null) return;

    return [xPB.getValue(0), xRMS.getValue(0), (-xRMS.getValue(0))];

}

function Calc_PassBand(Close, a1, a2){

    var PB = null;
    var PB_1 = ref(-1);
    var PB_2 = ref(-2);

    PB = (a1 - a2) * Close.getValue(0)
        + (a2 * (1-a1) - a1 * (1 - a2)) * Close.getValue(-1)
        + ((1 - a1) + (1 - a2)) * PB_1 - (1 - a1)*(1 - a2) * PB_2;

    return PB;
}

function Calc_RMS(PB, Period){

    var RMS = null;
    for (var i = 0; i < Period; i++){
        RMS = RMS + PB.getValue(-i) * PB.getValue(-i);
    }
    RMS = Math.sqrt(RMS / Period);

    return RMS;
}

function verify(){

    var b = false;
    if (getBuildNumber() < 779){

        drawTextAbsolute(5, 35, "This study requires version 10.6 or later.",
            Color.white, Color.blue, Text.RELATIVETOBOTTOM|Text.RELATIVETOLEFT|Text.BOLD|Text.LEFT,
            null, 13, "error");
        drawTextAbsolute(5, 20, "Click HERE to upgrade.@URL=https://www.esignal.com/download/default.asp",
            Color.white, Color.blue, Text.RELATIVETOBOTTOM|Text.RELATIVETOLEFT|Text.BOLD|Text.LEFT,
            null, 13, "upgrade");
        return b;
    }
    else
        b = true;

    return b;
}
—Eric Lippert
eSignal, an Interactive Data company
800 779-6555, www.eSignal.com
BACK TO LIST

THINKORSWIM: JULY 2016
In “The Super Passband Filter” in this issue, John Ehlers addresses the problem
of frequencies in indicators that are too low or too high. The common practice
to refine frequency is to enable smart filters. However, good filters take
lots of computational power. So Ehlers shows us how to use filters while keep
computing power relatively low.
We have recreated Ehlers’ study using our proprietary scripting language, thinkscript.
We have made the loading process extremely easy. Simply click on the link https://tos.mx/zeAlsQ and
choose view thinkScript. Choose to rename your study EhlersSuperPassbandFilter.
You can adjust the parameters of this strategy within the edit studies window
to fine-tune your variables.
In Figure 3, you see a chart of SPY, the ETF built to track the S&P 500,
along with the EhlersSuperPassbandFilter added. For use of the study, traders
should focus on the red line crossing one of the yellow lines. For more information
about the filter, please refer to Ehlers’ article in this issue.

FIGURE 3: THINKORSWIM. Here is a chart of SPY along with
the EhlersSuperPassbandFilter added, showing the red line crossing one of
the yellow lines.
—thinkorswim
A division of TD Ameritrade, Inc.
www.thinkorswim.com
BACK TO LIST

WEALTH-LAB: JULY 2016
Author John Ehlers continues to please readers with more nearly-zero lag filters—this
time, it’s the super passband oscillator, which he describes in his article
in this issue, “The Super Passband Filter.”
Following the trading idea in his article, we are presenting a simple WealthScript
system that can be applied selectively (only long side or both sides):
- Buy on the filter crossing above its -RMS line
- Short on the filter crossing below its RMS line
- Exit long when the filter either crosses below its RMS
or crosses below -RMS (which signifies a false entry signal)
- Cover short when the filter either crosses above its -RMS
or crosses above RMS (which signifies a false entry signal)
Our tests suggest that this new nearly-zero lag filter looks promising for
countertrend trades and for buying on significant dips (see Figure 4). To execute
this trading system, Wealth-Lab users need to install (or update) the latest
version of the TASCIndicators library from the extensions section
of our website if they haven't already done so, and then restart Wealth-Lab.

Figure 4: WEALTH-LAB. This sample Wealth-Lab 6 chart
illustrates entries made by a system based on John Ehlers’ super passband
filter.
Wealth-Lab Code
using System;
using System.Collections.Generic;
using System.Text;
using System.Drawing;
using WealthLab;
using WealthLab.Indicators;
using TASCIndicators;

namespace WealthLab.Strategies
{
	public class TASC201607 : WealthScript
	{
		private StrategyParameter paramPeriod1;
		private StrategyParameter paramPeriod2;
		private StrategyParameter paramGoShort;

		public TASC201607()
		{
			paramPeriod1 = CreateParameter("Period1", 40, 10, 100, 10);
			paramPeriod2 = CreateParameter("Period2", 60, 20, 300, 10);
			paramGoShort = CreateParameter("Go short?", 0, 0, 1, 1);
		}

		protected override void Execute()
		{
			int Period1 = paramPeriod1.ValueInt;
			int Period2 = paramPeriod2.ValueInt;
			bool goShort = paramGoShort.ValueInt == 1 ? true : false;

			var spb = SuperPassband.Series(Close,40,60);
			var rms = SuperPassbandRMS.Series(Close,40,60);
			var mrms = rms*-1;

			var pbPane = CreatePane(30,true,true);
			PlotSeries(pbPane,spb,Color.Red,WealthLab.LineStyle.Solid,1);
			DrawHorzLine(pbPane,0,Color.Blue,WealthLab.LineStyle.Solid,1);
			PlotSeriesFillBand(pbPane,rms,mrms,Color.Yellow,Color.Transparent,WealthLab.LineStyle.Solid,1);

			for(int bar = Math.Max(Period1,Period2); bar < Bars.Count; bar++)
			{
				SetBackgroundColor(bar,Color.Black);

				if (IsLastPositionActive)
				{
					Position p = LastPosition;
					if( p.PositionType == PositionType.Long )
					{
						if( CrossUnder(bar, spb, rms) || CrossUnder(bar, spb, mrms) )
							SellAtMarket(bar+1, p);
					}
					else
					{
						if( CrossOver(bar, spb, mrms) || CrossOver(bar, spb, rms))
							CoverAtMarket(bar+1, p);
					}
				}
				else
				{
					if( CrossOver(bar, spb, mrms))
						BuyAtMarket(bar+1);
					else
						if( CrossUnder(bar, spb, rms) && goShort )
							ShortAtMarket(bar+1);
				}
			}
		}
	}
}
—Eugene, Wealth-Lab team
MS123, LLC
www.wealth-lab.com
BACK TO LIST

NEUROSHELL TRADER: JULY 2016
John Ehlers’ super passband oscillator described in his article in this issue,
“The Super Passband Filter,” can be easily implemented with a few of NeuroShell
Trader’s 800+ indicators. Simply select new indicator from the insert
menu and use the indicator wizard to set up the following indicators:
PB:	ExpAvg1-ExpAvg2(Close,16,24)
RMS:	SqrRt(Divide(Sum(Pow(PB,2),50),50))
-RMS:	Neg(RMS)
Users of NeuroShell Trader can go to the STOCKS & COMMODITIES section
of the NeuroShell Trader free technical support website to download a copy
of this or any previous Traders’ Tips.
A sample chart is shown in Figure 5.

FIGURE 5: NEUROSHELL TRADER. This sample NeuroShell Trader
chart shows the PassBand, RMS and –RMS indicators.
—Marge Sherald, Ward Systems Group, Inc.
301 662-7950, sales@wardsystems.com
www.neuroshell.com
BACK TO LIST

TRADERSSTUDIO: JULY 2016
The TradersStudio code for John Ehlers’ article in this issue, “The Super
Passband Filter,” can be found at www.TradersEdgeSystems.com/traderstips.htm.
The following code files are contained in the download:
- Function: Ehlers_SPB—Returns the Ehlers Super PassBand
values
- Function: Ehlers_RMS—Returns the Ehlers RMS value
- Indicator plot: Ehlers_SPB_Ind—Plots the Ehlers SPB indicator
on a chart
- System: Ehlers_SPB_sys—An example, not in the article,
created by Richard Denning, that shows how the indicator might be used in
creating a trading system.
I tried various rules for the shorting but could not find one that returns
a profit, consequently I added a parameter that shuts off the shorting. Figure
6 shows the equity curve for the example system (long only) from 1999 through
2014 trading one share per signal of the NASDAQ 100 stocks.

FIGURE 6: TRADERSSTUDIO. Here is a sample equity curve
for the system from 1999 through 2014 trading one share per signal of the
NASDAQ 100 stocks.
'THE SUPER PASBAND FILTER
'Author: John Ehlers, TASC July 2016
'Coded by: Richard Denning 5/11/16
'TradersEdgeSystems.com

'returns the Ehlers Super PassBand value:
Function Ehlers_SPB(Period1, Period2)
    Dim a1
    Dim a2
    Dim PB As BarArray

    a1 = 5 / Period1
    a2 = 5 / Period2
    PB = (a1 - a2)*Close + (a2*(1 - a1) - a1*(1 - a2))*Close[1] + ((1 - a1) + (1 - a2))*PB[1] - (1 - a1)*(1 - a2)*PB[2]
    Ehlers_SPB = PB
End Function
'-----------------------------------------------------------------------------------------------------------------------
'returns the Ehlers RMS value:
Function Ehlers_RMS(Period1,Period2)
    Dim PB As BarArray
    Dim RMS As BarArray
    Dim count
    PB = Ehlers_SPB(Period1,Period2)

RMS = 0
    For count = 0 To 49
        RMS = RMS + PB[count]*PB[count]
    Next
    RMS = Sqr(RMS / 50)
Ehlers_RMS = RMS
End Function
'-----------------------------------------------------------------------------------------------------------------------
'plots the Ehlers_SPB and RMS indicators:
Sub Ehlers_SPB_Ind(Period1,Period2)
   plot1(Ehlers_SPB(Period1,Period2))
   plot2(Ehlers_RMS(Period1,Period2))
   plot3(-Ehlers_RMS(Period1,Period2))
   plot4(0)
End Sub
'------------------------------------------------------------------------------------------------------------------------
'example system created by Richard Denning using the Ehlers SPB & RMS indicators:
'Note the following system is not in the article but is an example
'   of how the indicator might be used in a system
Sub Ehlers_SPB_sys(Period1,Period2,TrendLen,longOnly)
'default: Period1=40, Period2=60, longOnly=1
   Dim myRMS As BarArray
   Dim mySPB As BarArray
   Dim NDX As BarArray
   mySPB = Ehlers_SPB(Period1,Period2)
   myRMS = Ehlers_RMS(Period1,Period2)
   NDX = C Of independent1
   If CrossesOver(mySPB,-myRMS)And C>Average(C,TrendLen) And NDX>Average(NDX,TrendLen) Then Buy("LE",1,0,Market,Day)
   If CrossesUnder(mySPB,myRMS) Then ExitLong("LX","",1,0,Market,Day)
   If CrossesUnder(mySPB,0) Then ExitLong("LX_SE","LE",1,0,Market,Day)
   If CrossesUnder(mySPB,0) And longOnly<>1 And C<Average(C,TrendLen) And NDX<Average(NDX,TrendLen) Then Sell("SE",1,0,Market,Day)
   If CrossesOver(mySPB,-myRMS) Then ExitShort("SX_myRMS","SE",1,0,Market,Day)
   If CrossesOver(mySPB,0) Then ExitShort("SX_0","SE",1,0,Market,Day)
End Sub
'----------------------------------------------------------------------------------------------------------------------------------
—Richard Denning
info@TradersEdgeSystems.com
for TradersStudio
BACK TO LIST

NINJATRADER: JULY 2016
The filter discussed in “The Super Passband Filter” by John Ehlers in this
issue is available for download at www.ninjatrader.com/SC/July2016SC.zip.
Once you have it downloaded, from within the NinjaTrader Control Center window,
select the menu File → Utilities → Import NinjaScript and select
the downloaded file. This file is for NinjaTrader Version 7.
You can review the indicators’ source code by selecting the menu Tools → Edit
NinjaScript → Indicator from within the NinjaTrader Control Center window
and selecting the SuperPassBandFile file.

FIGURE 7: NINJATRADER. The SuperPassBandFilter is displayed
on an SPY daily chart ending in May 2016.
NinjaScript uses compiled DLLs that run native, not interpreted, which provides
you with the highest performance possible.
—Raymond Deux & Jess Pennell
NinjaTrader, LLC
www.ninjatrader.com
BACK TO LIST

UPDATA: JULY 2016
Our Traders’ Tip for this month is based on “The Super Passband Filter” in
this issue by John Ehlers.
In the article, Ehlers seeks to filter out both high and low frequencies from
market data, eliminating distracting “wiggles” from the resultant signal with
minimal lag effect. This indicator achieves this with two differenced exponential
moving averages (EMAs) of varying periods. Trigger points for the filter are
added with a root mean square (RMS) envelope over the signal line.

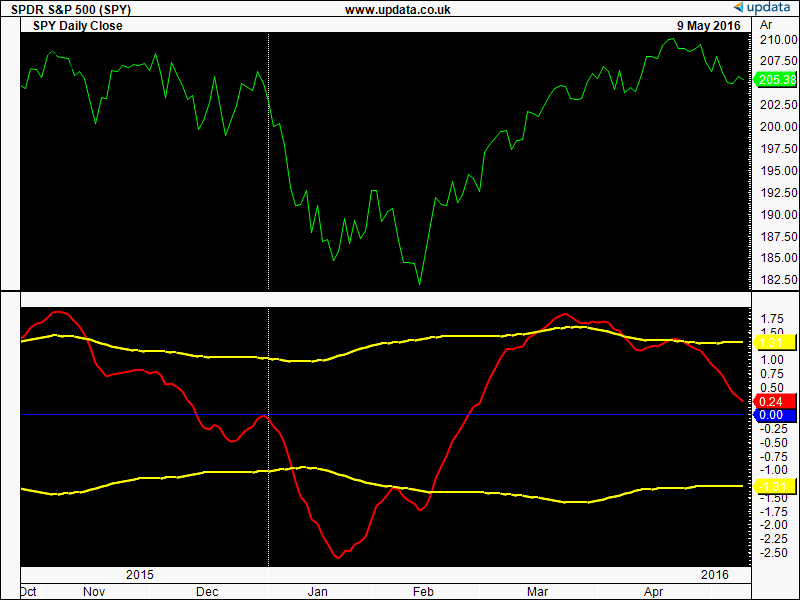
FIGURE 8: UPDATA. Here, the super passband filter is
applied to the SPY ETF of daily resolution.
The Updata code for this article can be found in the Updata library and may
be downloaded by clicking the custom menu and indicator Library.
Those who cannot access the library due to a firewall may paste the code shown
here into the Updata custom editor and save it.
'Super PassBand Filter
PARAMETER "Period 1" @PERIOD1=40
PARAMETER "Period 2" @PERIOD2=60
NAME "" ""
DISPLAYSTYLE 4LINES
INDICATORTYPE CHART
PLOTSTYLE THICK2 RGB(255,0,0)
PLOTSTYLE2 THICK2 RGB(255,255,0)
PLOTSTYLE3 THICK2 RGB(255,255,0)
COLOUR4 RGB(0,0,255)
@A1=0
@A2=0
@PB=0
#COUNT=0
@RMS=0

FOR #CURDATE=MAX(@PERIOD1,@PERIOD2) TO #LASTDATE
   @A1=5/@PERIOD1
   @A2=5/@PERIOD2
   @PB=(@A1-@A2)*CLOSE+(@A2*(1-@A1)-@A1*(1-@A2))*CLOSE(1)+((1-@A1)+(1-@A2))*HIST(@PB,1)      ...-((1-@A1)*(1-@A2)*HIST(@PB,2))
   @RMS=0
   FOR #COUNT=0 TO 49
       @RMS=@RMS+(HIST(@PB,#COUNT)*HIST(@PB,#COUNT))
   NEXT
   @PLOT=@PB
   @PLOT2=EXPBASE(@RMS/50,0.5)
   @PLOT3=-EXPBASE(@RMS/50,0.5)
   @PLOT4=0
NEXT
—Updata support team
support@updata.co.uk
www.updata.co.uk
BACK TO LIST

AMIBROKER: JULY 2016
In “The Super Passband Filter” in this issue, John Ehlers presents a passband
filtering technique based on subtraction of two exponential moving averages
(EMAs). It is worth noting that mathematically, such a filter is similar to
the classic MACD indicator. The difference is the way that the smoothing factor
is calculated. Ehlers uses a smoothing factor of 5/period while the classic
EMA uses factor of 2/(period+1). So the relationship between passband filter parameters and the classic MACD is given by:
PeriodMACD = -1 + PeriodPassBand/2.5;

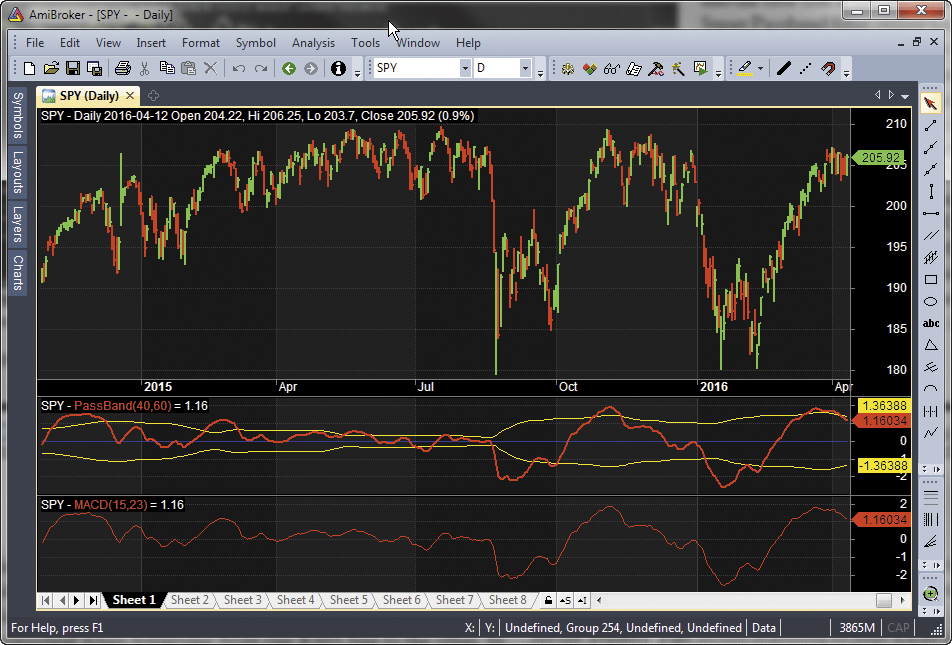
FIGURE 9: AMIBROKER. The Ehlers super passband (red) is shown in the middle pane together with RMS lines (yellow). A classic MACD with periods of 15 and 23 is shown in the bottom pane. Both produce the same values.
A ready-to-use formula that implements the super passband filter as described
in Ehlers’ article is shown here. To use the formula, enter the code in the
formula editor and press apply to display the passband indicator.
AmiBroker code
Period1 = Param("Period1", 40, 1, 100 );
Period2 = Param("Period2", 60, 1, 100 );

a1 = 5 / Period1;
a2 = 5 / Period2;

// pass band by difference of EMA's
// essentially it is 're-invented' MACD
PB = AMA( C, a1 ) - AMA( C, a2 );

RMS = sqrt( MA( PB * PB, 50 ) );

Plot( PB, "PassBand" + _PARAM_VALUES(), colorRed, styleThick );
Plot( RMS, "", colorYellow );
Plot( -RMS, "", colorYellow );
Plot( 0, "", colorBlue, styleNoLabel );
—Tomasz Janeczko, AmiBroker.com
www.amibroker.com
BACK TO LIST
MICROSOFT EXCEL: JULY 2016
In “The Super Passband Filter” in this issue, author John Ehlers presents
an indicator with a very quick reaction profile.
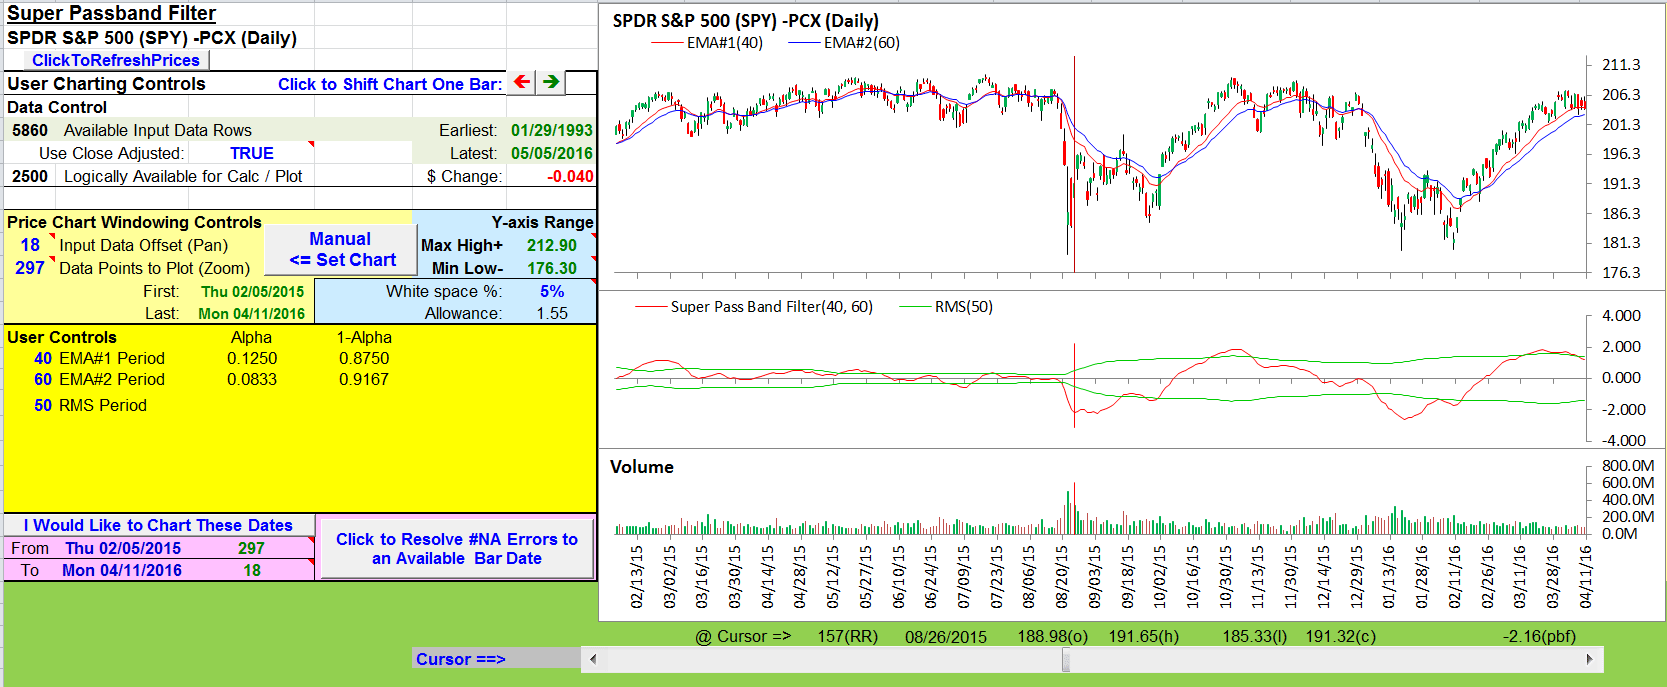
By replicating Figure 3 from Ehlers’ article (Figure 10) and playing with
the cursor, we can see that the lowest and highest points on the indicator
are never more than one bar behind the lowest or highest closes, marking a
change in significant localized trends. Hard to get much closer than that,
eh?

FIGURE 10: EXCEL. Here is an approximation of Figure
3 from John Ehlers’ article in this issue, “The Super Passband Filter.”
Ehlers suggests using crossover points of the filter value and an RMS envelope
of the super bandpass filter as a means of generating long or short entry signals.
For those crossovers where a trend appears to be in progress, this seems to
work well. In sideways patterns where a trend is not well established, this
technique can lead to whipsaws.
This indicator can give the trader a very early warning of trend changes.
For safety, one should look for additional entry confirmations to control risk.
A note about the EMA calculations used in this article: In this filter, Ehlers
is using a more aggressive alpha calculation to build his EMAs than is used
in either of the perhaps more familiar EMA versions. This EMA is significantly
more reactive to the most recent input value than a standard EMA or a Wilders’
EMA.
Generalized EMA formula = price today * α + EMA yesterday * (1- α)
Here is the formula for a more standard EMA, as found in many software packages:
α = 2 / (N+1)
	Using N = 40: α = 2 / (N+1) = 0.04878, and (1 - α) = 0.95121
Here is the formula for Wilders’ EMA:
α = 1/N
	Using N = 40: α = 1/N = 0.02500, and (1 - α) = 0.97500
And finally, here is the formuala as used in the super bandpass filter:
α = 5/N
	Using N = 40: α = 5/N = 0.12500, and (1 - α) = 0.87500
The spreadsheet file for this Traders’ Tip can be downloaded here.
To successfully download it, please follow these steps:
- Right-click on the Excel
file link, then
- Select “save as” (or “save target as”) to place
a copy of the spreadsheet file on your hard drive.
—Ron McAllister
Excel and VBA programmer
rpmac_xltt@sprynet.com
BACK TO LIST
Originally published in the July 2016 issue of
Technical Analysis of STOCKS & COMMODITIES magazine.
All rights reserved. © Copyright 2016, Technical Analysis, Inc.


