TRADERS’ TIPS
August 2016

For this month’s Traders’ Tips, the focus is Vitali Apirine’s
article in this issue, “The Middle-High-Low Moving Average.” Here,
we present the August 2016 Traders’ Tips code with possible implementations
in various software.
The Traders’ Tips section is provided to help the reader implement
a selected technique from an article in this issue or another recent issue.
The entries here are contributed by software developers or programmers for
software that is capable of customization.

TRADESTATION: AUGUST 2016
In “The Middle-High-Low Moving Average” in this issue, author Vitali Apirine
describes a different way to calculate moving averages based on the middle
of the high-low range rather than the typical moving average based on closing
prices. He calls this technique the MHL moving average. The article describes
a method of combining the MHL moving average with a traditional moving average
to generate trend following crossover signals. Here, we are providing the TradeStation
code for the MHL moving average. In addition, we have provided the EasyLanguage
code for a TradeStation strategy based on the author’s description of its application.
Indicator: MHL Moving Average
// TASC Aug 2016
// Article: MHL MA
// By: Vitali Apirine

inputs:
	MHLLength( 10 ),
	MovAvgLength( 50 ),
	AvgType( 1 ) ;

variables:
	HighestHigh( 0 ),
	LowestLow( 0 ),
	MHL( 0 ),
	SMAMHL( 0 ),
	SMAValue( 0 ),
	EMAMHL( 0 ),
	EMAValue( 0 ),
	MHLValue( 0 ),
	AvgValue( 0 ) ;

HighestHigh = Highest( High, MHLLength ) ;
LowestLow = Lowest( Low, MHLLength ) ;
MHL = ( HighestHigh + LowestLow ) / 2 ;

SMAMHL = Average( MHL, MovAvgLength ) ;
SMAValue = Average( Close, MovAvgLength ) ;

EMAMHL = XAverage( MHL, MovAvgLength ) ;
EMAValue = XAverage( Close, MovAvgLength ) ;

Switch ( AvgType )
	begin
	Case 1 :
		begin
		MHLValue = SMAMHL ;
		AvgValue = SMAValue ;
		end ;
	Case 2 :
		begin
		MHLValue = EMAMHL ;
		AvgValue = EMAValue ;
		end ;
	Default :
		begin
		MHLValue = SMAMHL ;
		AvgValue = SMAValue ;
		end ;
	end ;

if CurrentBar > MaxBarsBack then
	begin
	Plot1( MHLValue, "Avg MHL" ) ;
	Plot2( AvgValue, "Avg" ) ;
	end ;


Strategy: MHL Moving Average
// TASC Aug 2016
// Article: MHL MA
// By: Vitali Apirine

inputs:
	MHLLength( 10 ),
	MovAvgLength( 50 ),
	AvgType( 1 ) ;

variables:
	HighestHigh( 0 ),
	LowestLow( 0 ),
	MHL( 0 ),
	SMAMHL( 0 ),
	SMAValue( 0 ),
	EMAMHL( 0 ),
	EMAValue( 0 ),
	MHLValue( 0 ),
	AvgValue( 0 ) ;

HighestHigh = Highest( High, MHLLength ) ;
LowestLow = Lowest( Low, MHLLength ) ;
MHL = ( HighestHigh + LowestLow ) / 2 ;

SMAMHL = Average( MHL, MovAvgLength ) ;
SMAValue = Average( Close, MovAvgLength ) ;

EMAMHL = XAverage( MHL, MovAvgLength ) ;
EMAValue = XAverage( Close, MovAvgLength ) ;

Switch ( AvgType )
	begin
	Case 1 :
		begin
		MHLValue = SMAMHL ;
		AvgValue = SMAValue ;
		end ;
	Case 2 :
		begin
		MHLValue = EMAMHL ;
		AvgValue = EMAValue ;
		end ;
	Default :
		begin
		MHLValue = SMAMHL ;
		AvgValue = SMAValue ;
		end ;
	end ;

if CurrentBar > MaxBarsBack then
	begin
	if AvgValue crosses over MHLValue then
		Buy next bar at Market
	else if AvgValue crosses under MHLValue then
		SellShort next bar at Market ;
	end ;
To download the EasyLanguage code, please visit our TradeStation and EasyLanguage
support forum. The code from this article can be found at https://community.tradestation.com/Discussions/Topic.aspx?Topic_ID=142776.
The ELD filename is “TASC_AUG2016.ELD.”
For more information about EasyLanguage in general, please see https://www.tradestation.com/EL-FAQ.
A sample chart is shown in Figure 1.

FIGURE 1: TRADESTATION. The MHL moving average indicator
and strategy applied to a daily chart of the S&P 500 index.
This article is for informational purposes. No type of trading or investment
recommendation, advice, or strategy is being made, given, or in any manner
provided by TradeStation Securities or its affiliates.
—Doug McCrary
TradeStation Securities, Inc.
www.TradeStation.com
BACK TO LIST

TC2000: AUGUST 2016
Vitali Apirine’s middle-high-low (MHL) moving averages described in his article
in this issue can be set up easily in TC2000 using custom indicators.
Figure 2 shows the exponential (top) and simple (bottom) price and MHL averages
for CBOE. The MHL plots are the average of the high-low range for the last
10 bars (MAXH10+MINL10) / 2. You can change the high-low range periods by editing
the formulas and changing range from 10 bars to whatever you choose.
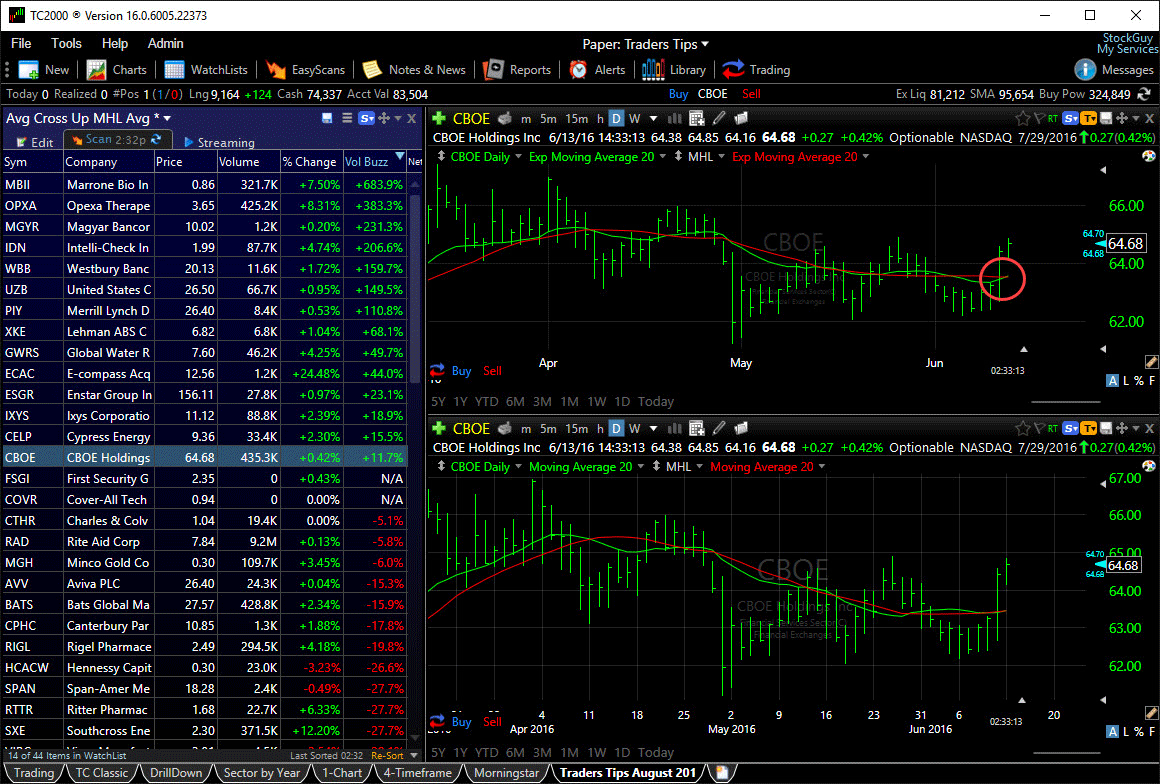
FIGURE 2: TC2000. Here is a chart of CBOE showing the
moving averages of price (green) and the moving averages of the MHL plots
(red).
Once you have the MHL plots in place, you can add simple and exponential moving
averages which will allow you to set up scans to find the double crossovers.
Once you have everything set up, you can adjust the opacity of the MHL plots
so that they are hidden as we did in Figure 2.
If you would like a copy of this layout already set up with the plots in place,
just send an email to support@tc2000.com and
we’ll be happy to send it to you.
You can try the simulated trading yourself at www.TC2000.com.
—Patrick Argo
Worden Brothers, Inc.
www.TC2000.com
BACK TO LIST

METASTOCK: AUGUST 2016
Vitali Apirine’s article in this issue, “The Middle-High-Low Moving Average,”
introduces an indicator of the same name. The MetaStock formula that is included
in the article by the author is written to always return the average for the
Dow Jones Industrial Average. Following is a version that will calculate on
the base instrument of a chart:
tp1:= Input("High-Low range periods", 3, 15, 3);
tp2:= Input("Moving average Length", 3, 200, 10);
r:= (HHV(H, tp1) + LLV(L, tp1))/2;
Mov( r, tp2, S)
—William Golson
MetaStock Technical Support
www.metastock.com
BACK TO LIST

eSIGNAL: AUGUST 2016
For this month’s Traders’ Tip, we’ve provided the study MHL_MA.efs based
on the formula described in Vitali Apirine’s article in this issue, “The Middle-High-Low
Moving Average.” In the article, Apirine presents a moving average based on
the middle of the high–low range.
The eSignal study contains formula parameters that may be configured through
the edit chart window (right-click on the chart and select “edit chart”).
A sample chart is shown in Figure 3.

FIGURE 3: eSIGNAL. Here is an example of the MHL_MA study
plotted on a daily chart of $SPX.
To discuss this study or download a complete copy of the formula code, please
visit the EFS library discussion board forum under the forums link
from the support menu at www.esignal.com or
visit our EFS KnowledgeBase at https://www.esignal.com/support/kb/efs/.
The eSignal formula script (EFS) is also available for copying & pasting
here:
var fpArray = new Array();

function preMain(){
    setPriceStudy(true);
    setStudyTitle("MHL");
    setCursorLabelName("MHL",0);
    setCursorLabelName("MA",1);
    setDefaultBarFgColor(Color.RGB(0,148,255), 0);
    setDefaultBarFgColor(Color.RGB(255,155,0), 1);

    var x = 0;
    fpArray[x] = new FunctionParameter("Lookback", FunctionParameter.NUMBER)
        with(fpArray[x++]){
        setName("Lookback");
        setDefault(15);
        setLowerLimit(1);
    }

    fpArray[x] = new FunctionParameter("AvgLength", FunctionParameter.NUMBER)
        with(fpArray[x++]){
        setName("Avg Length");
        setDefault(35);
        setLowerLimit(1);
    }

    fpArray[x] = new FunctionParameter("Smoothing", FunctionParameter.STRING)
        with(fpArray[x++]){
        setName("Smoothing");
        addOption("sma");
        addOption("ema");
        setDefault("sma");
    }

    fpArray[x] = new FunctionParameter("isPlot", FunctionParameter.BOOLEAN)
        with(fpArray[x++]){
        setName("Show Average");
        setDefault(true);
    }
}

var bVersion = null;
var bInit = false;
var xMA = null;
var xBaseMA = null;

function main(Lookback, AvgLength, Smoothing, isPlot){
    if (bVersion == null) bVersion = verify();
    if (bVersion == false) return;

    if (getBarState() == BARSTATE_ALLBARS){
        bInit = false;
    }

    if(!bInit){
        xMA = eval(Smoothing)(AvgLength, middleDonchian(Lookback));
        xBaseMA = eval(Smoothing)(AvgLength);
        bInit = true;
    }

    if (xMA.getValue(0) != null){
        if (isPlot) return [xMA.getValue(0), xBaseMA.getValue(0)];
        else return xMA.getValue(0);
    }
}

function verify(){
    var b = false;
    if (getBuildNumber() < 719){

        drawTextAbsolute(5, 35, "This study requires version 12.1 or later.",
            Color.white, Color.blue, Text.RELATIVETOBOTTOM|Text.RELATIVETOLEFT|Text.BOLD|Text.LEFT,
            null, 13, "error");
        drawTextAbsolute(5, 20, "Click HERE to upgrade.@URL=https://www.esignal.com/download/default.asp",
            Color.white, Color.blue, Text.RELATIVETOBOTTOM|Text.RELATIVETOLEFT|Text.BOLD|Text.LEFT,
            null, 13, "upgrade");
        return b;
    }
    else
        b = true;

    return b;
}
—Eric Lippert
eSignal, an Interactive Data company
800 779-6555, www.eSignal.com
BACK TO LIST

WEALTH-LAB: AUGUST 2016
The middle-high-low moving average described in Vitali Apirine’s article in
this issue is a double-smoothed indicator. It’s simply a moving average applied
to the middle of the high–low range. As with any moving average, it can help
determine the direction of a trend, and it can be applied following the same
guidelines for using a moving average. Although our rendition uses either the
SMA or EMA to smooth the raw MHA, power users can utilize any of the many moving
averages already available in Wealth-Lab.
After updating the TASCIndicators library to v2016.07 or later, users will
find the MHLMA indicator under the “TASC Magazine Indicators” group. The MHLMA
can be plotted on a chart (Figure 4) and used as an entry or exit condition
in a rule-based strategy without having to program any code yourself.

FIGURE 4: WEALTH-LAB. This sample chart illustrates application
of the system’s rules on a daily chart of the RUT (Russell 2000).
This Wealth-Lab strategy lets you choose between SMA or EMA to build the MHLMA
as well as to set the highest/lowest range and smoothing lookback periods through
the parameter sliders on the bottom-left of the screen.
Wealth-Lab strategy code (C#):

using System;
using System.Collections.Generic;
using System.Text;
using System.Drawing;
using WealthLab;
using WealthLab.Indicators;
using TASCIndicators;

namespace WealthLab.Strategies
{
	public class TASC201608 : WealthScript
	{
		private StrategyParameter slider1;
		private StrategyParameter slider2;
		private StrategyParameter slider3;

		public TASC201608()
		{
			slider1 = CreateParameter("MHL Period",3,2,300,20);
			slider2 = CreateParameter("MA Period",10,2,300,20);
			slider3 = CreateParameter("SMA(0) or EMA (1)",0,0,1,1);
		}

		protected override void Execute()
		{
			int movAvgPeriod = slider2.ValueInt;
			bool isEMA = slider3.ValueInt == 0 ? false : true;

			var mhl = MHLMA.Series(Bars,slider1.ValueInt,slider2.ValueInt, isEMA ? WhichMA.EMA : WhichMA.SMA);
			DataSeries ema = EMA.Series(Close,movAvgPeriod,EMACalculation.Modern);
			DataSeries sma = SMA.Series(Close,movAvgPeriod);

			PlotSeries(PricePane,mhl,Color.Red,LineStyle.Solid,1);
			PlotSeries(PricePane,isEMA ? ema : sma,Color.DarkGreen,LineStyle.Solid,1);

			for(int bar = GetTradingLoopStartBar(1); bar < Bars.Count; bar++)
			{
				if (IsLastPositionActive)
				{
					if( CrossUnder(bar,isEMA?ema:sma,mhl) )
						SellAtMarket(bar+1, LastPosition);
				}
				else
				{
					if( CrossOver(bar,isEMA?ema:sma,mhl) )
						BuyAtMarket(bar+1, isEMA.ToString());
				}
			}
		}
	}
}
—Eugene, Wealth-Lab team
www.wealth-lab.com
BACK TO LIST

AMIBROKER: AUGUST 2016
In “The Middle-High-Low Moving Average” in this issue, author Vitali Apirine
presents a new application of moving averages. A ready-to-use formula that
implements the MHL moving average is shown here (and is available for copying
and pasting from Traders.com). To use the formula, enter the code in the formula
editor and press apply to display a chart (Figure 5).
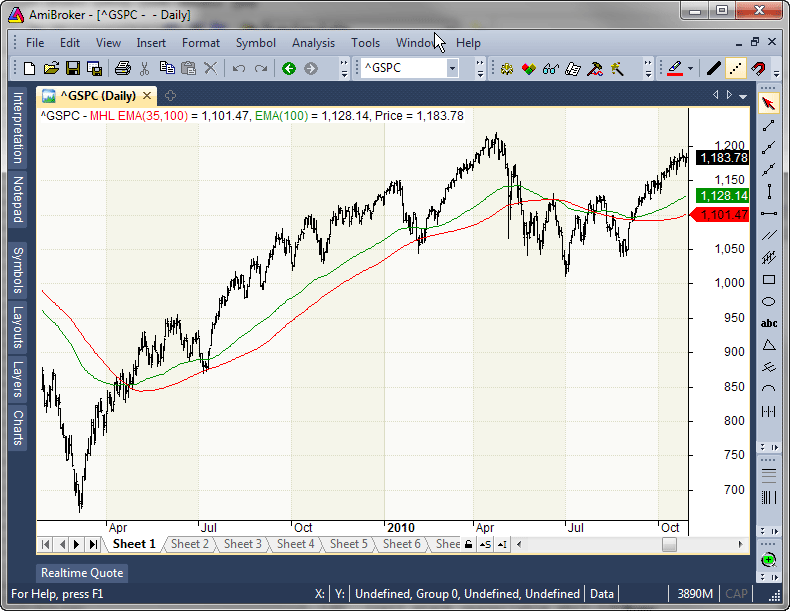
FIGURE 5: AMIBROKER. Here is an S&P 500 chart with
the EMA(100) as the green line and the MHL EMA(35,100).
period = Param("Period", 35, 2, 100 );
smooth = Param("Smooth", 100, 2, 100 );

MHL = 0.5 * ( HHV( H, period ) + LLV( L, period ) );

Plot( EMA( MHL, smooth ), "MHL EMA" + _PARAM_VALUES(), colorRed );

// standard EMA and bar chart
Plot( EMA( C, smooth ), StrFormat("EMA(%g)", smooth ), colorGreen );
Plot( C, "Price", colorDefault, styleBar );
—Tomasz Janeczko, AmiBroker.com
www.amibroker.com
BACK TO LIST

NEUROSHELL TRADER: AUGUST 2016
The middle-high-low moving averages described by Vitali Apirine in his article
in this issue can be easily implemented with a few of NeuroShell Trader’s 800+
indicators. Simply select new indicator from the insert menu
and use the indicator wizard to create the following indicators:
MHL SMA:	MovAvg( PriceMidpoint( High, Low, 10), 20)
MHL EMA:	ExpAvg( PriceMidpoint( High, Low, 10), 20)
Users of NeuroShell Trader can go to the Stocks & Commodities section
of the NeuroShell Trader free technical support website to download a copy
of this or any previous Traders’ Tips.
A sample chart is shown in Figure 6.

FIGURE 6: NEUROSHELL TRADER. This NeuroShell Trader chart
shows the MHL SMA and the MHL EMA.
—Marge Sherald, Ward Systems Group, Inc.
301 662-7950, sales@wardsystems.com
www.neuroshell.com
BACK TO LIST

THINKORSWIM: AUGUST 2016
In his article in this issue, “The Middle-High-Low Moving Average,” Vitali
Apirine alters the game when it comes to using moving averages. His article
focuses on the difference between using traditional moving average studies
and his study, which uses an average based on the average of the range of the
period.
We have recreated his study using our proprietary scripting language, thinkscript.
We have made the loading process extremely easy—simply follow the two links https://tos.mx/AWwM4I (for
the strategy) and https://tos.mx/2NuXCR (for
the study) and choose to view thinkScript strategy and study,
respectively. Choose to rename your study “MiddleHighLowMA.” You can adjust
the parameters of this strategy within the edit studies window to
fine-tune your variables.
In the example shown in Figure 7, you see a chart of Edwards Life Sciences
(EW) with the MiddleHighLow study and strategy added. We have also added a
200-day simple moving average shown in blue. You can see that the strategy
is built to backtest and place simulated trades based on the green MiddleHighLow
line crossing the red MiddleHighLow line.

FIGURE 7: THINKORSWIM. Here you see a chart of Edwards
Life Sciences (EW) with the MiddleHighLow study and strategy added. A 200-day
simple moving average has been added and is shown in blue. The strategy is
designed to place simulated trades based on the green MiddleHighLow line
crossing the red MiddleHighLow line.
For more information on this technique, please see Apirine’s article in this
issue.
—thinkorswim
A division of TD Ameritrade, Inc.
www.thinkorswim.com
BACK TO LIST

AIQ: AUGUST 2016
The AIQ code based on Vitali Apirine’s article in this issue, “The Middle-High-Low
Moving Average,” is provided at www.TradersEdgeSystems.com/traderstips.htm and
is also shown here.
!THE MIDDLE-HIGH-LOW MOVING AVERAGE
!Author: Vitali Apirine, TASC August 2016
!Coded by: Richard Denning 6/9/16
!www.TradersEdgeSystems.com

! ABBREVIATIONS:
C 	is [close].
C1	is valresult(C,1).
H 	is [high].
L 	is [low].
O 	is [open].

!INPUTS:
MMAlen is 3.
MMAsmo is 10.

!INDICTOR CODE FOR MIDDLE HIGH LOW MOVING AVERAGE:
MR is (highresult(H,MMAlen) + lowresult(L,MMAlen))/2.
MMA is expavg(MR,MMAsmo).   !PLOT
Figure 8 shows the MMA(3,10) plotted on a chart of AAPL together with an EMA(10).

FIGURE 8: AIQ. Here, an MMA(3,10) moving average (stepped
line) is shown together with an EMA(10) moving average (smooth line).
—Richard Denning
info@TradersEdgeSystems.com
for AIQ Systems
BACK TO LIST

TRADERSSTUDIO: AUGUST 2016
The TradersStudio code based on Vitali Apirine’s article in this issue, “The
Middle-High-Low Moving Average,” can be found at www.TradersEdgeSystems.com/traderstips.htm and
is also shown below.
The following code files are provided in the download from www.TradersEdgeSystems.com/traderstips.htm:
- Function: MMA—Returns the middle-high-low moving average values
- Indicator plot: MMA_IND—Plots the MMA indicator on a chart.
In Figure 9, I show the MMA(3,10) indicator plotted on a chart of AAPL together
with the EMA(10).

FIGURE 9: TRADERSSTUDIO. Shown here are the MMA(3,10)
and EMA(10) on a chart of AAPL.
The code is shown here:
'THE MIDDLE-HIGH-LOW MOVING AVERAGE
'Author: Vitali Apirine, TASC August 2016
'Coded by: Richard Denning 6/9/16
'www.TradersEdgeSystems.com

'RETURNS THE VALUE OF THE MMA:
function MMA(mmaLen,mmaSmo)
'INPUTS:
'MMAlen = 3
'MMAsmo = 10

Dim MR As BarArray

'CODE FOR MIDDLE HIGH LOW MOVING AVERAGE:
MR = (Highest(H,mmaLen) + Lowest(L,mmaLen))/2
MMA = XAverage(MR,mmaSmo)

End Function

'---------------------------------------------
'INDICATOR PLOT FOR MMA:
sub MMA_IND(mmaLen,mmaSmo)
plot1(MMA(mmaLen,mmaSmo))
End Sub
—Richard Denning
info@TradersEdgeSystems.com
for TradersStudio
BACK TO LIST

NINJATRADER: AUGUST 2016
The MHL indicator, as discussed in “The Middle-High-Low Moving Average” by
Vitali Apirine in this issue, is available for download at www.ninjatrader.com/SC/August2016SC.zip.
Once it is downloaded, from within the NinjaTrader Control Center window,
select the menu File → Utilities → Import NinjaScript and select
the downloaded file. This file is for NinjaTrader Version 7.
You can review the indicators’ source code by selecting the menu Tools → Edit
NinjaScript → Indicator from within the NinjaTrader Control Center window
and selecting the MHL file.
A sample chart implementing the indicators is shown in Figure 10.

FIGURE 10: NINJATRADER. The MHL is displayed on the S&P
500 index using the option for EMA. The SMA option under the MHL settings
can be selected in the Indicators menu of the chart for use instead of the
EMA.
—Raymond Deux, & Patrick Hodges
NinjaTrader, LLC
www.ninjatrader.com
BACK TO LIST

UPDATA: AUGUST 2016
Our Traders’ Tip for this month is based on the article by Vitali Apirine
in this issue, “The Middle-High-Low Moving Average.” (See Figure 11.)
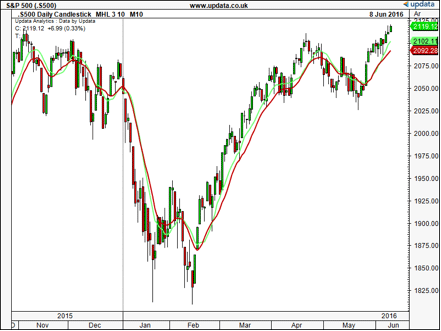
FIGURE 11: UPDATA. The MHL average (in red) with a simple
average (green) are shown for comparison, as applied to the S&P 500 index
of daily resolution.
The author combines two types of averages—an exponential smoothing, and a
bespoke average of the middle of a period’s high–low range—to create a trend-following
indicator.
The Updata code for this article is in the Updata library and may be downloaded
by clicking the custom menu and then indicator library. Those
who cannot access the library due to a firewall may paste the code shown here
into the Updata custom editor and save it.
PARAMETER "MHL Period" #MHLPERIOD=3
PARAMETER "Exp. Period" #EXPPERIOD=10
NAME MHL
DISPLAYSTYLE LINE
INDICATORTYPE TOOL
PLOTSTYLE THICK2 RGB(200,0,0)
FOR #CURDATE=MAX(#EXPPERIOD,#MHLPERIOD) TO #LASTDATE
   @PLOT=SGNL((PHIGH(HIGH,#MHLPERIOD)+PLOW(LOW,#MHLPERIOD))*0.5,#EXPPERIOD,E)
NEXT
—Updata support team
support@updata.co.uk
www.updata.co.uk
BACK TO LIST
MICROSOFT EXCEL: AUGUST 2016
In “The Middle-High-Low Moving Average” in this issue, author Vitali Apirine
presents a new twist on using moving averages of trading ranges.
To see how this sausage gets made, let’s look at plots of the bare MHL and
its ingredients. Using lookback periods of 3, 15, and 35 helps to visualize
the corresponding response lag (Figures 12, 13, & 14).

FIGURE 12: EXCEL, MHL(3) COMPONENTS

FIGURE 13: EXCEL, MHL(15) COMPONENTS

FIGURE 14: EXCEL, MHL(35) COMPONENTS
Now let’s put the MHL in play by replicating a couple of examples from Apirine’s
article.
Figure 15 (replicating Figure 6 from Apirine’s article) shows the value of
crossovers in the direction of the prevailing trend.
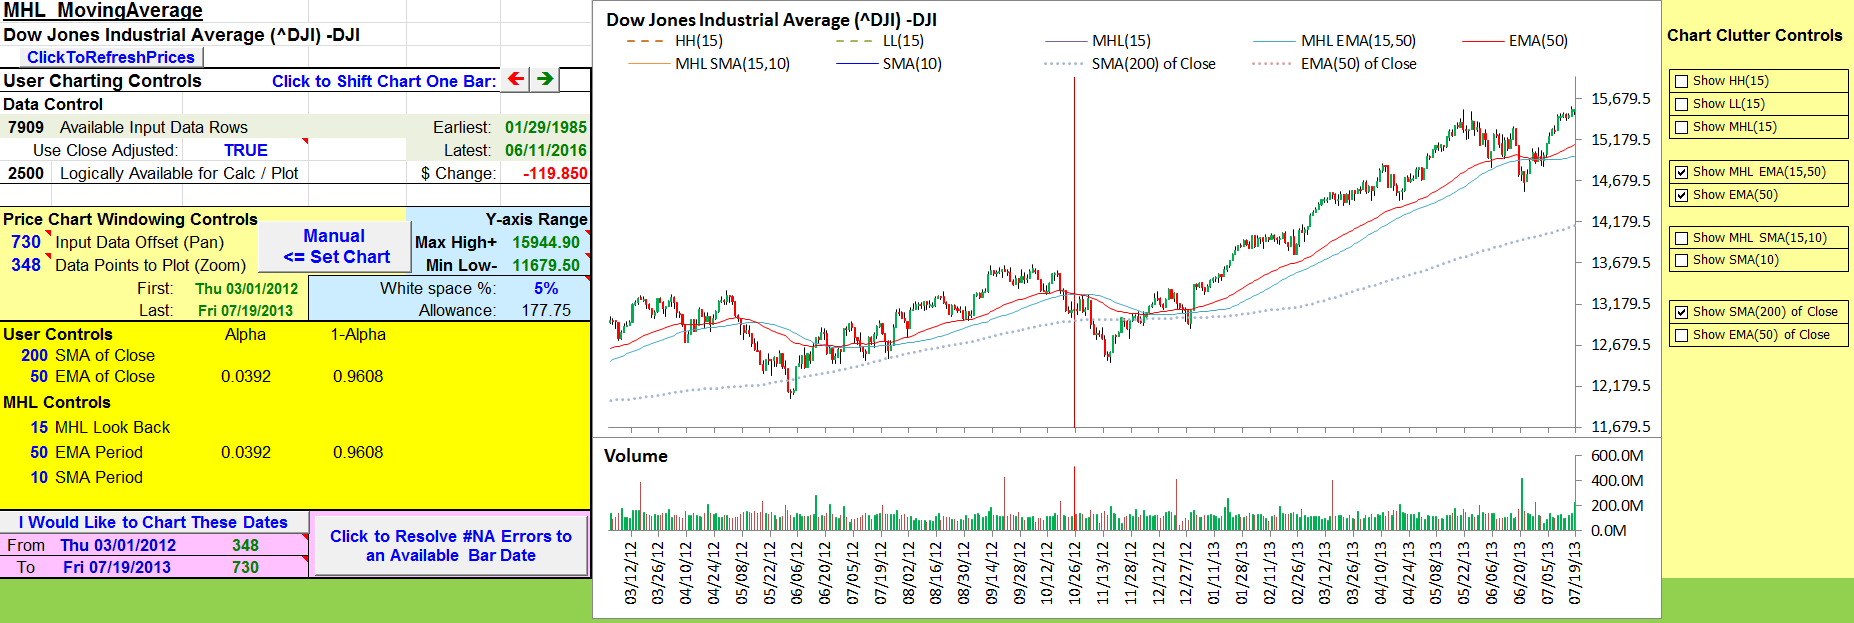
FIGURE 15: EXCEL, TREND. We can see that crossovers work
better with the trend.
Figure 16 (replicating Figure 7 from Apirine’s article) demonstrates the power
of a breakout from a double bottom when combined with an MHL crossover signal.
Here, the cursor marks where the chart shown in Apirine’s article ended. I
extended the chart a bit to the right to emphasize the potential of this combination.
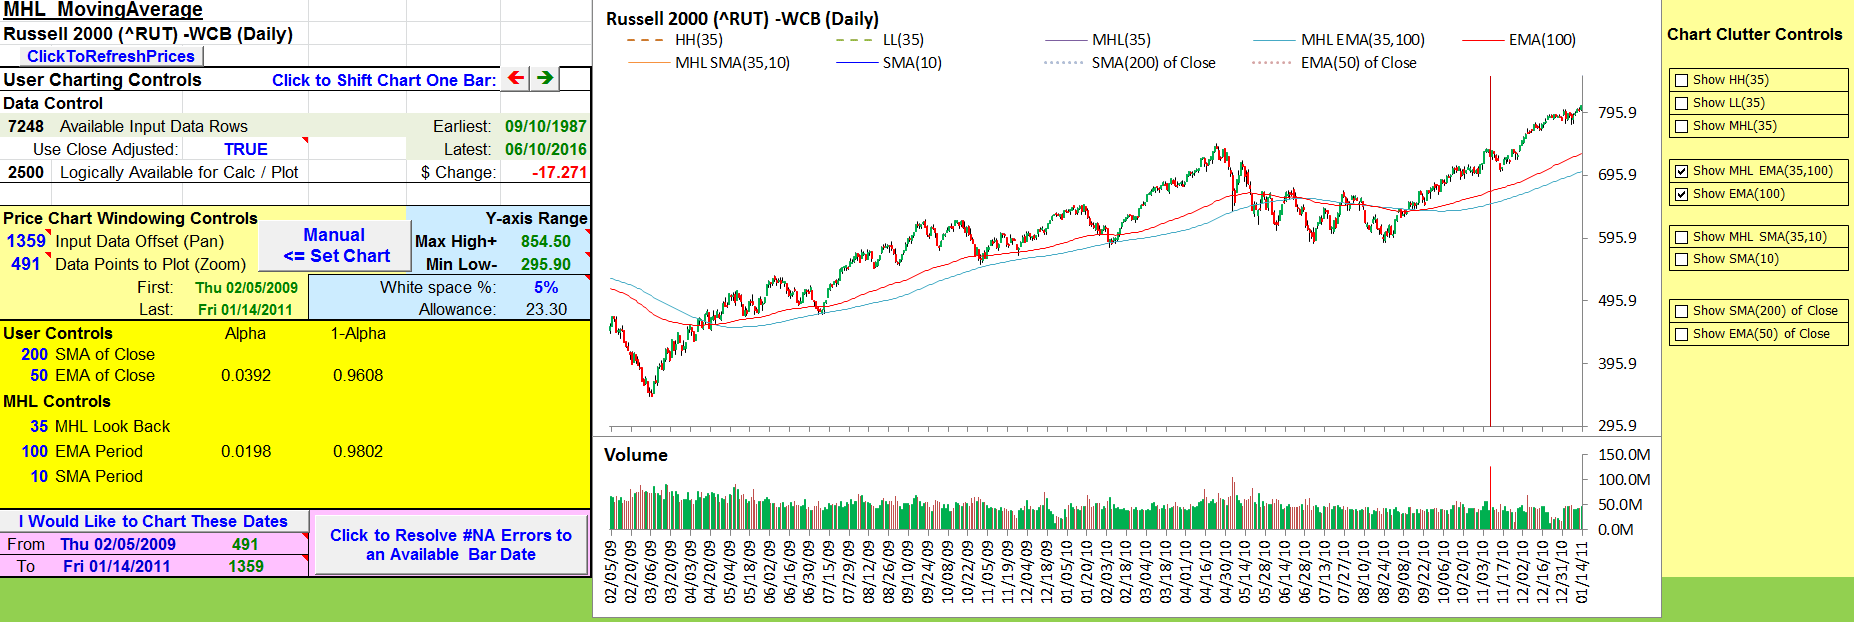
FIGURE 16: EXCEL, DOUBLE BOTTOM. Here’s an example of
combining crossovers with chart patterns (in this case, a double bottom).
To get a good understanding of this unique indicator, try the following steps:
- Retrieve historical data for a symbol of your choice.
- Pick a combination of control values and clutter controls.
- Walk the chart backward and forward using the click to shift chart one
bar buttons to get a feel for how what you see at each step might influence
your trading decisions.
As always, prudent risk management and stops should be applied if you want
to try trading based on signals generated with this tool.
See the notes tab of the spreadsheet for dates and symbols that may
be used to approximate the charts found in Apirine’s article.
The spreadsheet file for this Traders’ Tip can be downloaded here.
To successfully download it, follow these steps:
- Right-click on the Excel
file link, then
- Select “save as” (or “save target as”) to place
a copy of the spreadsheet file on your hard drive.
—Ron McAllister
Excel and VBA programmer
rpmac_xltt@sprynet.com
BACK TO LIST
Originally published in the August 2016 issue of
Technical Analysis of STOCKS & COMMODITIES magazine.
All rights reserved. © Copyright 2016, Technical Analysis, Inc.


