TRADERS’ TIPS
December 2016
For this month’s Traders’ Tips, the focus is Domenico D’Errico’s article in this issue, “Pair Trading With A Twist.” Here, we present the December 2016 Traders’ Tips code with possible implementations in various software.
The Traders’ Tips section is provided to help the reader implement a selected technique from an article in this issue or another recent issue. The entries here are contributed by software developers or programmers for software that is capable of customization.

TRADESTATION: DECEMBER 2016
In “Pair Trading With A Twist” in this issue, author Domenico D’Errico describes several approaches to pair-trading strategies that he has developed. He defines “pair trading” as matching a long position with a short position in two separate but related securities. Here, we are providing the TradeStation EasyLanguage code for the ratio indicator as well as the pair-trading strategy based on the author’s concepts.
TradeStation offers a number of tools to assist the trader with testing and implementing strategies such as these. The built-in Algo–Pairs Trading indicator allows the trading of multiple symbols from a single chart, and Portfolio Maestro allows you to backtest the system and view the results in a single performance report.
To download the EasyLanguage code for the strategy, please visit our TradeStation and EasyLanguage support forum. The code can be found at https://community.tradestation.com/Discussions/Topic.aspx?Topic_ID=142776. The ELD filename is “TASC_DEC2016.ELD.”
Indicator: SpreadMA

// TASC DEC 2016
// Pairs Trading With A Twist
// Domenico D'Errico

using elsystem ;
using elsystem.drawing ;
using elsystem.drawingobjects ;

inputs:
	int FastLength( 12 ),
	int SlowLength( 40 ),
	int LinRegLength( 20 ),
	double LinRedStdDevs( 2 ),
	int UpColor( blue ),
	int DnColor( red ),
	int WickColor( white ) ;

variables:
	double SprdRatioO( 0 ),
	double SprdRatioH( 0 ),
	double SprdRatioL( 0 ),
	double SprdRatioC( 0 ),
	double FastAvg( 0 ),
	double SlowAvg( 0 ),
	int PlotColor( 0 ),
	double LRV( 0 ),
	double LRVAgo( 0 ),
	double UpperTL( 0 ),
	double UpperTLAgo( 0 ),
	double LowerTL( 0 ),
	double LowerTLAgo( 0 ),
	double Sdevs( 0 ),
	trendline TLine( null ),
	trendline UpperTLine( null ),
	trendline LowerTLine( null ) ;

method void CreateTLs ()
	begin
	TLine =
	trendline.Create(
	DTPoint.Create( BarDateTime[1], SprdRatioC ),
	DTPoint.Create( BarDateTime, SprdRatioC ) ) ;
	UpperTLine =
	trendline.Create(
	DTPoint.Create( BarDateTime[1], SprdRatioC ),
	DTPoint.Create( BarDateTime, SprdRatioC ) ) ;
	LowerTLine =
	trendline.Create(
	DTPoint.Create( BarDateTime[1], SprdRatioC ),
	DTPoint.Create( BarDateTime, SprdRatioC ) ) ;

	TLine.Color = Color.Yellow ;
	TLine.Lock = true ;
	TLine.ShowInPlotSubgraph = true ;
	TLine.ExtLeft = false ;
	TLine.ExtRight = false ;
	TLine.Weight = Weight.Weight2 ;

	UpperTLine.Color = Color.Yellow ;
	UpperTLine.Lock = true ;
	UpperTLine.ShowInPlotSubgraph = true ;
	UpperTLine.ExtLeft = false ;
	UpperTLine.ExtRight = false ;
	UpperTLine.Weight = Weight.Weight2 ;

	LowerTLine.Color = Color.Yellow ;
	LowerTLine.Lock = true ;
	LowerTLine.ShowInPlotSubgraph = true ;
	LowerTLine.ExtLeft = false ;
	LowerTLine.ExtRight = false ;
	LowerTLine.Weight = Weight.Weight2 ;


	drawingobjects.Add( TLine ) ;
	drawingobjects.Add( UpperTLine ) ;
	drawingobjects.Add( LowerTLine ) ;
	end ;

method void updateTLs()
	begin
	TLine.SetEndPoint( DTPoint.Create(
	BarDateTime, LRV ) );
	TLine.SetStartPoint( DTPoint.Create(
	BarDateTime[LinRegLength], LRVAgo ) ) ;

	UpperTLine.SetEndPoint(
	DTPoint.Create(
	BarDateTime, UpperTL ) );
	UpperTLine.SetStartPoint( DTPoint.Create(
	BarDateTime[LinRegLength], UpperTLAgo ) ) ;

	LowerTLine.SetEndPoint( DTPoint.Create(
	BarDateTime, LowerTL ) );
	LowerTLine.SetStartPoint( DTPoint.Create(
	BarDateTime[LinRegLength], LowerTLAgo ) ) ;
	end ;

once
	begin
	CreateTLs () ;
	end ;

if Open Data2 <> 0 then
	SprdRatioO = Open Data1 / Open Data2 ;
if High Data2 <> 0 then
	SprdRatioH = High Data1 / High Data2 ;
if Low Data2 <> 0 then
	SprdRatioL = Low Data1 / Low Data2 ;
if Close Data2 <> 0 then
	SprdRatioC = Close Data1 / Close Data2 ;

FastAvg = Average( SprdRatioC, FastLength ) ;
SlowAvg = Average( SprdRatioC, SlowLength ) ;

LRV = LinearRegValue(
SprdRatioC, LinRegLength, 0 );
LRVAgo = LinearRegValue(
SprdRatioC, LinRegLength, LinRegLength - 1 );
SDevs = StdDev(
SprdRatioC, LinRegLength ) * LinRedStdDevs ;

UpperTL = LRV + SDevs ;
UpperTLAgo = LRVAgo + SDevs ;
LowerTL = LRV - SDevs ;
LowerTLAgo = LRVAgo - SDevs ;

if SprdRatioC > SprdRatioO then
	PlotColor = UpColor
else
	PlotColor = DnColor ;

Plot1( SprdRatioO, "SprdRatioO", PlotColor ) ;
Plot2( SprdRatioC, "SprdRatioC", PlotColor ) ;
Plot3( SprdRatioH, "SprdRatioH", WickColor ) ;
Plot4( SprdRatioL, "SprdRatioL", WickColor ) ;

if CurrentBar >= MaxBarsBack then
	begin
	Plot5( FastAvg, "FastAvg" ) ;
	Plot6( SlowAvg, "SlowAvg" ) ;
	end ;

if LastBarOnChartEx then
	updateTLs() ;


Strategy: PairsStrategy

// TASC DEC 2016
// Pairs Trading With A Twist
// Domenico D'Errico

// Set up chart with 3 data streams
// For instance if trading XLE / SPY
// Chart1: Data1 XLE, Data2 XLE, Data3 SPY
// Chart2: Data1 SPY, Data2 XLE, Data3 SPY

// TrendFollow_123
// 1 = Trend Following
// 2 = Mean Reverting
// 3 = Trend and Pullback

inputs:
	int FastLength( 12 ),
	int SlowLength( 40 ),
	int TrendFollow_123( 1 ),
	double PosDollarAmount( 10000 ) ;

variables:
	double SprdRatioC( 0 ),
	double FastAvg( 0 ),
	double SlowAvg( 0 ),
	double TradeSize( 0 ),
	bool TradingRefSymbol( false ) ;

once
	begin
	TradingRefSymbol
	= Symbol of Data1 = Symbol of Data3 ;
	end ;

if Close Data3 <> 0 then
	SprdRatioC = Close Data2 / Close Data3 ;

FastAvg = Average( SprdRatioC, FastLength ) ;
SlowAvg = Average( SprdRatioC, SlowLength ) ;
TradeSize = Floor( PosDollarAmount / Close ) ;

if TrendFollow_123 = 1 then //Trend Following
	begin
	if FastAvg crosses over SlowAvg then
		begin
		if TradingRefSymbol then
			SellShort TradeSize shares
			next bar at Market
		else
			Buy TradeSize shares
			next bar at Market ;
		end
	else if FastAvg crosses under SlowAvg then
		begin
		Sell next bar at Market ;
		Buy to Cover next bar at Market ;
		end ;
	end
else if TrendFollow_123 = 2 then //Mean Reverting
	begin
	if SprdRatioC crosses under FastAvg then
		begin
		if TradingRefSymbol then
			SellShort TradeSize shares
			next bar at Market
		else
			Buy TradeSize shares
			next bar at Market ;
		end ;
	if SprdRatioC crosses over FastAvg then
		begin
		Sell next bar at Market ;
		Buy to Cover next bar at Market ;
		end ;
	end
else if TrendFollow_123 = 3 then //Trend & Pullback
	begin
	if FastAvg > SlowAvg and SprdRatioC
	crosses under FastAvg then
		begin
		if TradingRefSymbol then
			SellShort TradeSize shares
			next bar at Market
		else
			Buy TradeSize shares
			next bar at Market ;
		end ;
	if 	FastAvg < SlowAvg and SprdRatioC
	crosses over FastAvg then
		begin
		Sell next bar at Market ;
		Buy to Cover next bar at Market ;
		end ;
	end ;
For more information about EasyLanguage in general, please see https://www.tradestation.com/EL-FAQ.
A sample chart is shown in Figure 1.

FIGURE 1: TRADESTATION. Here, the pair-trading strategy and spread indicator are applied to weekly XLE/SPY charts.
This article is for informational purposes. No type of trading or investment recommendation, advice or strategy is being made, given or in any manner provided by TradeStation Securities or its affiliates.
—Doug McCrary
TradeStation Securities, Inc.
www.TradeStation.com
BACK TO LIST

eSIGNAL: DECEMBER 2016
For this month’s Traders’ Tip, we’ve provided the study Pair_Trading.efs based on the formula described in Domenico D’Errico’s article in this issue, “Pair Trading With A Twist.” In the article, the author presents a strategy for trading stock pairs.
The eSignal study contains formula parameters that may be configured through the edit chart window (right-click on the chart and select “edit chart”). A sample chart is shown in Figure 2.

FIGURE 2: eSIGNAL. Here is an example of the Pair_Trading.efs study plotted on a daily chart of IBM.
To discuss this study or download a complete copy of the formula code, please visit the EFS library discussion board forum under the forums link from the support menu at www.esignal.com or visit our EFS KnowledgeBase at https://www.esignal.com/support/kb/efs/. The eSignal formula script (EFS) is also available for copying & pasting below.
/*********************************
Provided By:
eSignal (Copyright c eSignal), a division of Interactive Data
Corporation. 2016. All rights reserved. This sample eSignal
Formula Script (EFS) is for educational purposes only and may be
modified and saved under a new file name.  eSignal is not responsible
for the functionality once modified.  eSignal reserves the right
to modify and overwrite this EFS file with each new release.

Description:
    Pair Trading With A Twist by Domenico D'Errico

Version:            1.00  10/10/2016

Formula Parameters:                     Default:
Correlating symbol                      null
Fast MA                                 4
Slow MA                                 40
BG Color Condition                      Trend Following


Notes:
The related article is copyrighted material. If you are not a subscriber
of Stocks & Commodities, please visit www.traders.com.

**********************************/


var fpArray = new Array();

function preMain(){
    if (isWatchList()){
        setCursorLabelName("Trend Following",0);
        setCursorLabelName("Mean Rev",1);
        setCursorLabelName("Trend&Pullback",2);
        setDefaultBarFgColor(Color.white,0);
        setDefaultBarFgColor(Color.white,1);
        setDefaultBarFgColor(Color.white,2);
    }
    else {
        setDefaultPrecision(4);
        setCursorLabelName("Fast MA", 1);
        setCursorLabelName("Slow MA", 2);
        setDefaultBarFgColor(Color.RGB(255,106,0), 1);
        setDefaultBarFgColor(Color.RGB(255,0,110), 2);
        setDefaultBarThickness(3,0);
    }
    setIntervalsBackfill(true);
    var x = 0;
    fpArray[x] = new FunctionParameter("Leg2", FunctionParameter.STRING);
        with (fpArray[x++]){
        setName("Correlating symbol");
        addOption(" ");
        addOption("SPY");
        setDefault("SPY");
        }
    fpArray[x] = new FunctionParameter("FastMA", FunctionParameter.NUMBER);
        with (fpArray[x++]){
        setName("Fast MA");
        setLowerLimit(1);
        setDefault(4);
        }
    fpArray[x] = new FunctionParameter("SlowMA", FunctionParameter.NUMBER);
        with (fpArray[x++]){
        setName("Slow MA");
        setLowerLimit(1);
        setDefault(40);
        }
        fpArray[x] = new FunctionParameter("BgCColor", FunctionParameter.STRING);
        with (fpArray[x++]){
        setName("BG Color Condition");
        addOption("Trend Following");
        addOption("Mean Reverting");
        addOption("Trend Pullback");
        setDefault("Trend Following");
        }

}

var bVersion = null;
var bInit = false;
var xFastSMA = null;
var xRatioClose = null;
var xSlowSMA = null;
var sTFStrategy = null;
var sMRStrategy = null;
var sTBStrategy = null;
var upColor = null;
var sTBStrategy_1 = null;

function main (Leg2, FastMA, SlowMA, BgCColor){
    if (bVersion == null) bVersion = verify();
    if (bVersion == false) return;

    if (getBarState() == BARSTATE_ALLBARS)
        bInit = false;

    if (getCurrentBarCount() <= SlowMA) return;

    if (!bInit){
        sTFStrategy = null;
        sMRStrategy = null;
        sTBStrategy = null;
        upColor = Color.RGB(0,60,0);

        var sSpread = getSymbol() + " / " + Leg2;
        xRatioClose = close(sym(sSpread));
        if (!isWatchList())
            setCursorLabelName(sSpread, 0);

        xFastSMA = sma(FastMA, xRatioClose);
        xSlowSMA = sma(SlowMA, xRatioClose);

        bInit = true;
    }

    if(getBarState() == BARSTATE_NEWBAR)
        sTBStrategy_1 = sTBStrategy;

    var nFastSMA = xFastSMA.getValue(0);
    var nSlowSMA = xSlowSMA.getValue(0);
    var nRatioClose = xRatioClose.getValue(0);

    if (nFastSMA > nSlowSMA)
        sTFStrategy = "UP";
    else if (nFastSMA < nSlowSMA)
        sTFStrategy = null;

    if (nRatioClose < nFastSMA)
        sMRStrategy = "Mean Rev UP";
    else if (nRatioClose > nFastSMA)
        sMRStrategy = null;

    if (sTBStrategy_1 == null){
        if (nFastSMA > nSlowSMA && nRatioClose < nFastSMA)
            sTBStrategy = "UP";
        else sTBStrategy = sTBStrategy_1
    }

    if (sTBStrategy_1 != null){
        if (nFastSMA < nSlowSMA && nRatioClose > nFastSMA)
        sTBStrategy = null;
        else sTBStrategy = sTBStrategy_1;
    }


    if (isWatchList()){
        if (sTFStrategy != null) setBarBgColor(upColor,0);
        if (sMRStrategy != null) setBarBgColor(upColor,1);
        if (sTBStrategy != null) setBarBgColor(upColor,2);

        return [sTFStrategy, sMRStrategy, sTBStrategy];
    }
    else {
        if ((BgCColor == "Trend Following" && sTFStrategy != null) ||
            (BgCColor == "Mean Reverting" && sMRStrategy != null) ||
            (BgCColor == "Trend Pullback" && sTBStrategy != null))
            setBarBgColor(upColor,0);

        return [nRatioClose, nFastSMA, nSlowSMA];
    }
}

function verify(){
    var b = false;
    if (getBuildNumber() < 2455){

        drawTextAbsolute(5, 35, "This study requires version 11.3 or later.",
            Color.white, Color.blue, Text.RELATIVETOBOTTOM|Text.RELATIVETOLEFT|Text.BOLD|Text.LEFT,
            null, 13, "error");
        drawTextAbsolute(5, 20, "Click HERE to upgrade.@URL=https://www.esignal.com/download/default.asp",
            Color.white, Color.blue, Text.RELATIVETOBOTTOM|Text.RELATIVETOLEFT|Text.BOLD|Text.LEFT,
            null, 13, "upgrade");
        return b;
    }
    else
        b = true;

    return b;
}
—Eric Lippert
eSignal, an Interactive Data company
800 779-6555, www.eSignal.com
BACK TO LIST

THINKORSWIM: DECEMBER 2016
In “Pair Trading With A Twist” in this issue, author Domenico D’Errico investigates an updated method of an old trading technique. Historically, most pair traders have used statistical regression or correlation models and mean reversion for entry and exit points. D’Errico’s article notes that this does not always produce satisfactory results and so he looks to add technical analysis, namely moving averages, to increase the probability of success.
We took this strategy and built it using our proprietary scripting language, thinkscript. To allow greater flexibility in the pairs being traded, we broke the strategy into two different strategies that when used congruently provide entry and exit points for both the long and short securities traded in the pair—one to give signals on the chart for the long symbol of the pair and a second for entries on the symbol of the pair to be shorted.
We have made the loading process extremely easy; simply click on the links https://tos.mx/JPHf0f and https://tos.mx/hz2WBd then choose to view thinkScript strategy. Choose to rename your study “PairTraidingLong” for the first link and “PairTraidingShort” for the second.
To use these for entry and exit points, two charts will be required (either detached or in a grid). On the first chart, enter the symbol of the pair that will be traded long. Then add the strategy PairTradingLong from the edit studies → strategies window. Then click the gear on the strategy and enter the symbol of the pair that will be shorted into the “second symbol” field. Complete the reverse on the second chart, with the symbol of the pair to be shorted entered as the symbol for the chart, and the symbol to be traded long entered as the “second symbol” for the PairTradingShort strategy. Entry and exit points for each of the symbols of the pair will be displayed on the corresponding chart (Figures 3 & 4).
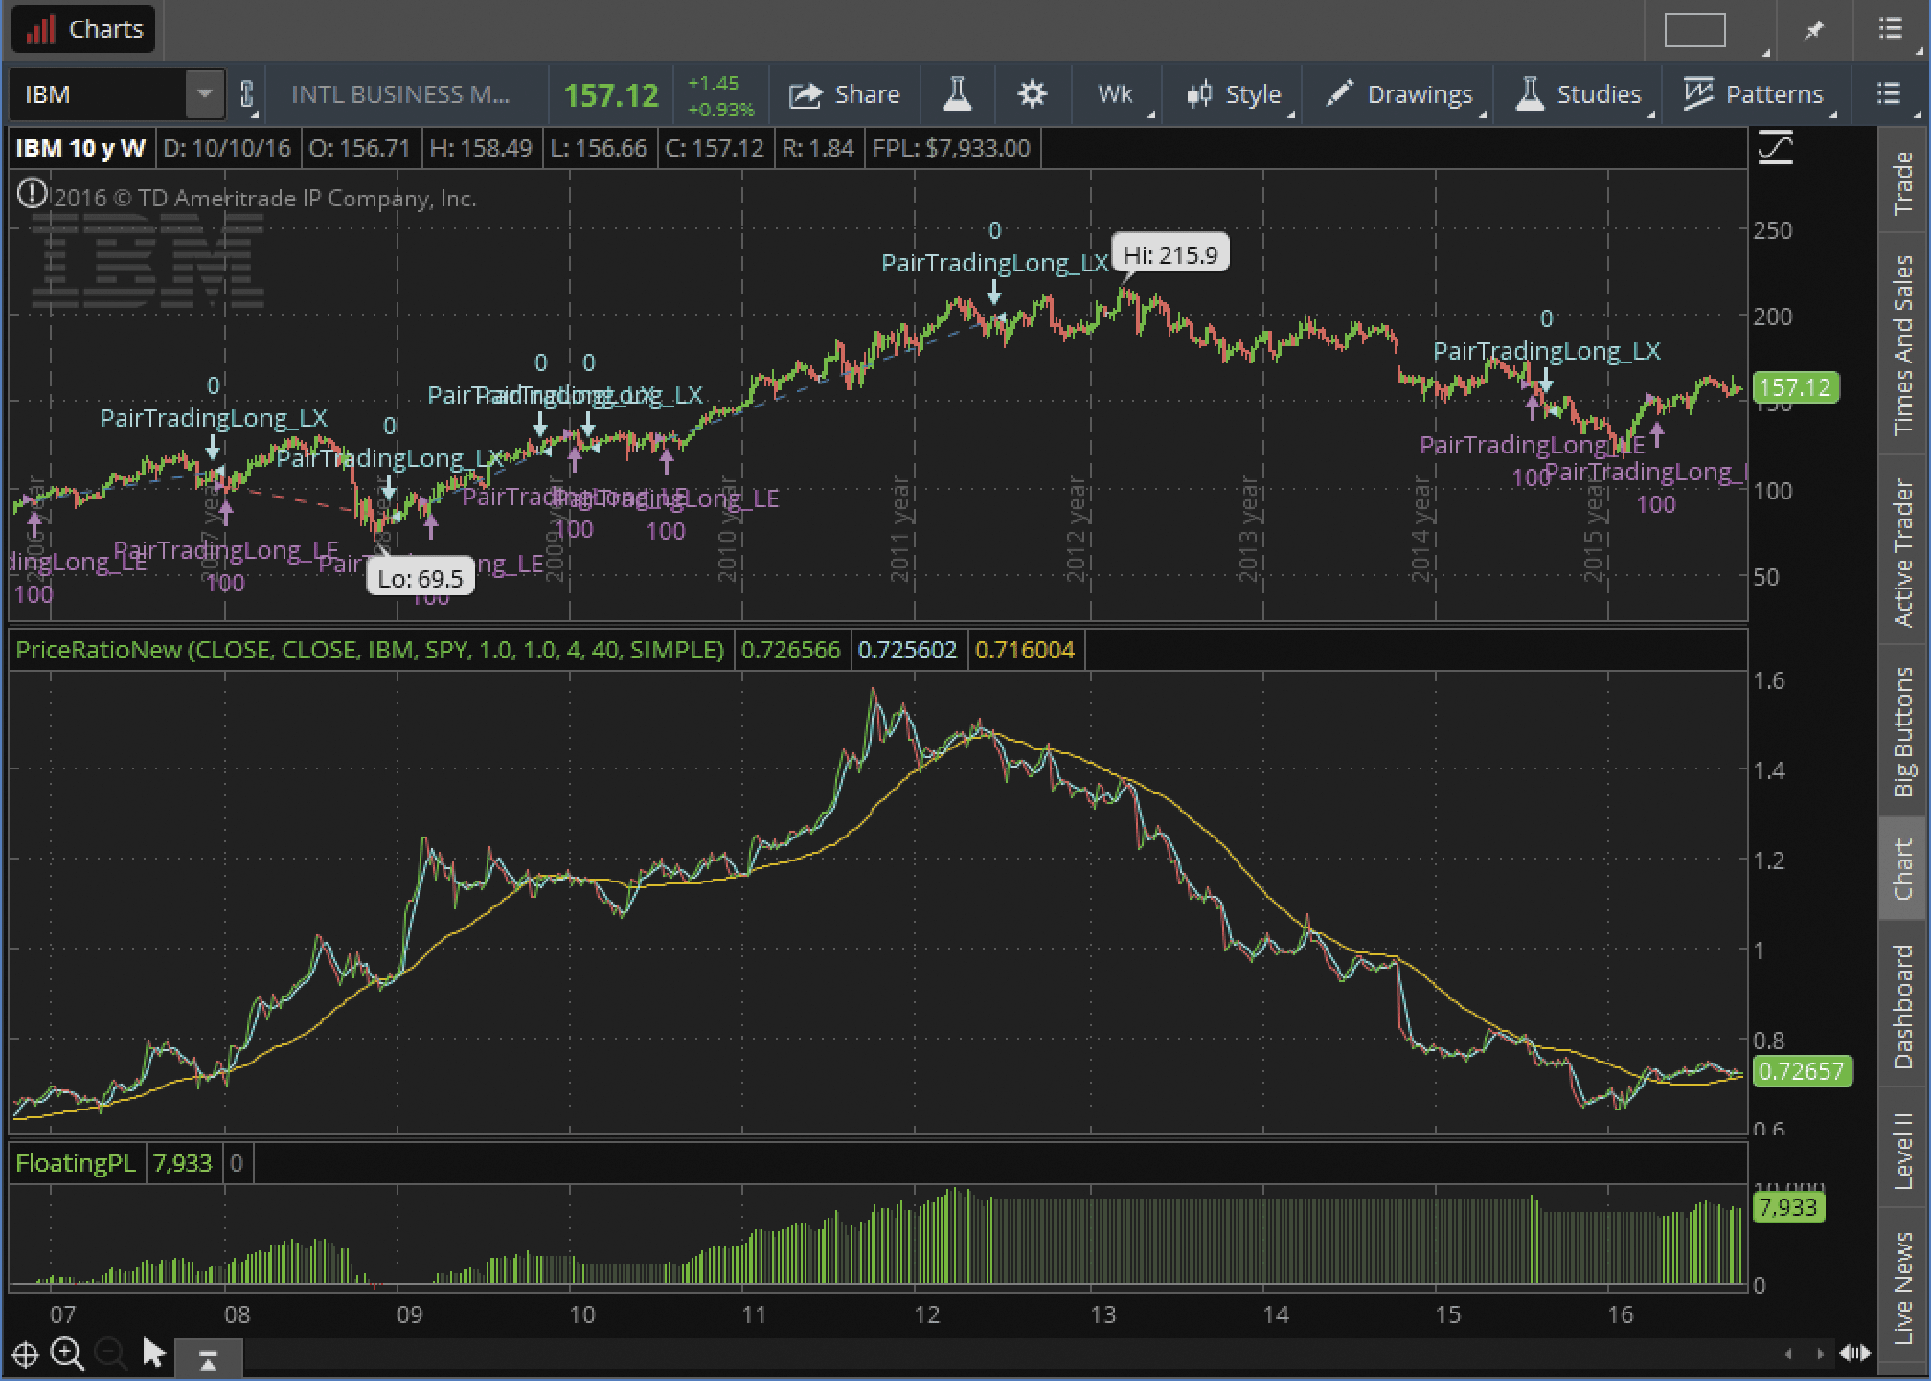
FIGURE 3: THINKORSWIM. Here, signals are shown for the long symbol (IBM) of the pair, with the short symbol of the pair (SPY) as the secondary symbol. Below in Figure 4, signals for the short symbol in the pair are shown.
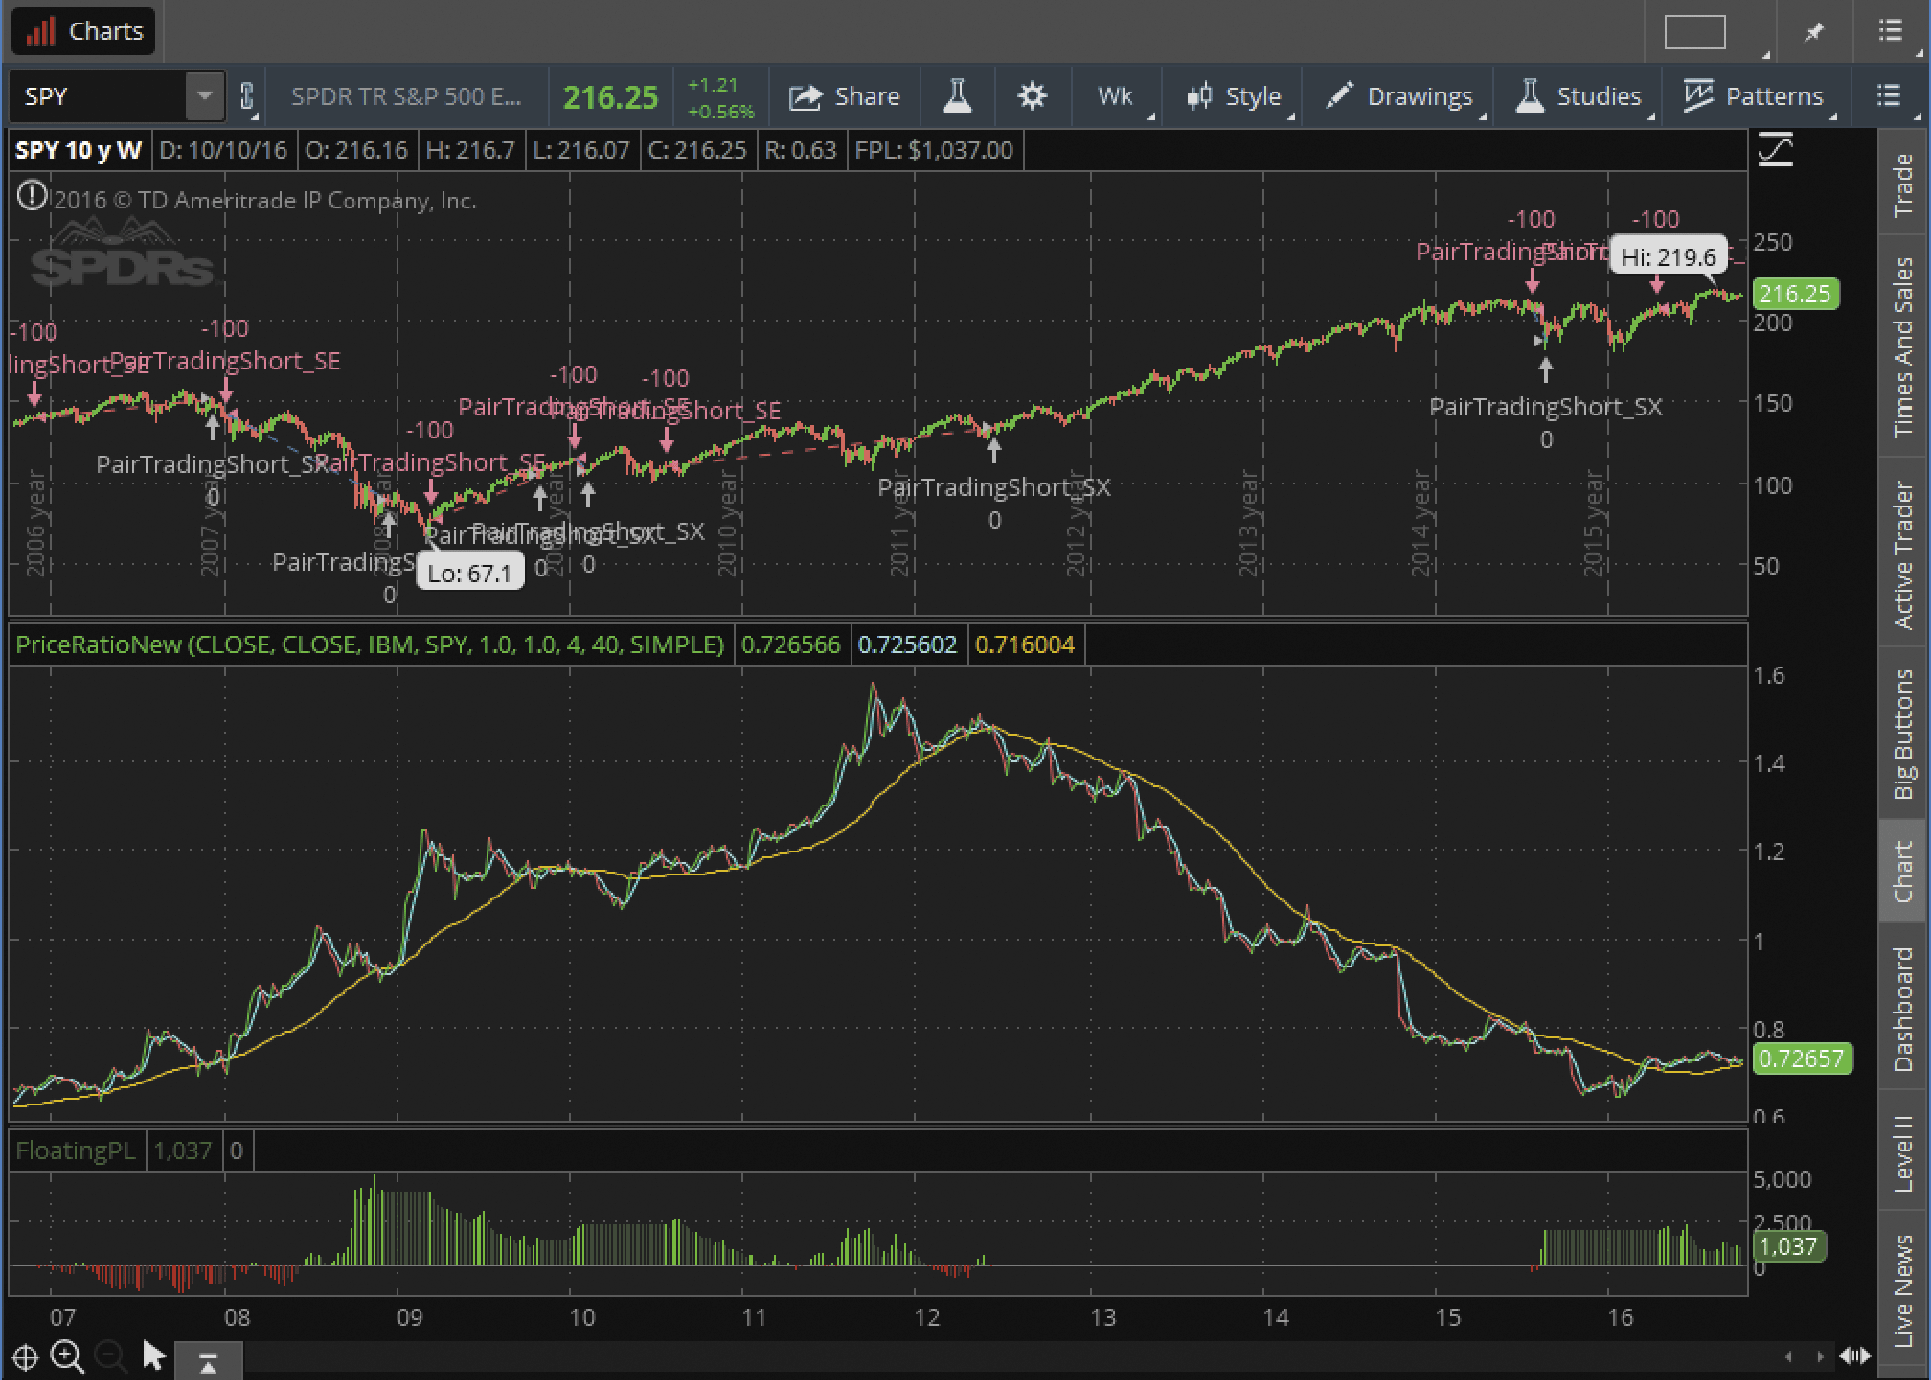
FIGURE 4: THINKORSWIM. In this chart, the primary symbol (SPY) is the short symbol of the pair, with signals shown on the chart. The secondary symbol (IBM) is the long.
—thinkorswim
A division of TD Ameritrade, Inc.
www.thinkorswim.com
BACK TO LIST

WEALTH-LAB: DECEMBER 2016
To help traders using Wealth-Lab draw their own conclusions on how Domenico D’Errico’s pair-trading strategies work, which were discussed in his article in this issue (“Pair Trading With A Twist”), we’ve coded all three pair-trading ideas into one system. To build your stock pair versus the SPY, run it on a single symbol’s chart, which is an S&P 500 component. It’s possible to apply the strategy to any instrument.
To switch between mean-reverting, trend & pullback, and trend-following modes, you can drag the respective slider strategy mode on the bottom left part of the screen. Likewise, it’s possible to adjust the fast and slow moving average periods. Wealth-Lab will apply changed parameters so you have a chance to see how entries & exits change interactively on the chart (Figure 5).

FIGURE 5: WEALTH-LAB. This chart stacks three chart panes: individual stocks’ candlesticks (top), the price ratio with its moving averages (middle), and the first stock of the pair (bottom). Trade arrows are displayed in the bottom pane.
If you need more trading ideas, you could compare the strategies from D’Errico’s article to similar pair-trading strategies presented in previous S&C articles that are already available for download from our website, wealth-lab.com, that were covered in past Traders’ Tips columns. These articles include “Pairs Trading” (March 2001 S&C), “Developing A Multilevel Strategy” (September 2012 S&C), “Timing The Market With Pairs Logic” (March 2014 S&C), and “Market-Neutral VIX-Based Pair Strategy” (Active Trader magazine, October 2010).
On a closing note, to scan for different pair combinations in any markets, you can use a study such as the one created by a Wealth-Lab community member. Named correlation matrix, it calculates and displays the correlations of all symbols in a watchlist.
The Wealth-Lab code is shown below.
using System;
using System.Collections.Generic;
using System.Text;
using System.Drawing;
using WealthLab;
using WealthLab.Indicators;

namespace WealthLab.Strategies
{
	public class TASC201612 : WealthScript
	{
		StrategyParameter fastPeriod;
		StrategyParameter slowPeriod;
		StrategyParameter strategyMode;

		public TASC201612()
		{
			fastPeriod = CreateParameter("Fast Period", 4, 1, 100, 1);
			slowPeriod = CreateParameter("Slow Period", 40, 20, 300, 5);
			strategyMode = CreateParameter("Strategy Mode", 0, -1, 1, 1);
		}

		protected override void Execute()
		{
			// Enter your pair symbols here
			string stock1, stock2, longSymbol, shortSymbol;
			longSymbol = stock1 = Bars.Symbol;
			shortSymbol = stock2 = "SPY";

			int MAPeriod = fastPeriod.ValueInt, MAPeriod2 = slowPeriod.ValueInt, mode = strategyMode.ValueInt;

			// Compute DataSeries
			DataSeries close1, close2, open1, open2, high1, high2, low1, low2;
			SetContext( stock1, true );
			Bars bars1 = Bars;
			close1 = Close; open1 = Open; high1 = High; low1 = Low;
			SetContext( stock2, true );
			Bars bars2 = Bars;
			close2 = Close; open2 = Open; high2 = High; low2 = Low;
			RestoreContext();

			DataSeries Ratio = close1 / close2; Ratio.Description = "Ratio";
			DataSeries RatioO = open1 / open2; RatioO.Description = "RatioOpen";
			DataSeries RatioH = high1 / high2; RatioH.Description = "RatioHigh";
			DataSeries RatioL = low1 / low2; RatioL.Description = "RatioLow";
			DataSeries RatioSMA = SMA.Series( Ratio, MAPeriod ); RatioSMA.Description = "Ratio Fast SMA";
			DataSeries RatioSMA2 = SMA.Series( Ratio, MAPeriod2 ); RatioSMA2.Description = "Ratio Slow SMA";

			// Graphics
			ChartPane RatioPane = CreatePane( 6000, true, true );
			ChartPane StocksPane = CreatePane( 2000, true, true );
			PlotSymbol(StocksPane,bars1,Color.Green,Color.Red);
			PlotSymbol(StocksPane,bars2,Color.Green,Color.Red);
			HideVolume();
			PlotSyntheticSymbol( RatioPane, "Price Ratio " + stock1 + "/" + stock2 + " as OHLC", RatioO, RatioH, RatioL, Ratio, new DataSeries("Bogus"), Color.Navy, Color.Salmon );
			PlotSeries( RatioPane, RatioSMA, Color.Gray, WealthLab.LineStyle.Solid, 2 );
			PlotSeries( RatioPane, RatioSMA2, Color.Salmon, WealthLab.LineStyle.Solid, 2 );

			for(int bar = MAPeriod; bar < Bars.Count; bar++)
			{
				// Trend following strategy
				if( mode == 1 )
				{
					if( IsLastPositionActive )
					{
						if (CrossUnder(bar, RatioSMA, RatioSMA2 ))
							ExitAtClose(bar, Position.AllPositions);
					}
					else
					{
						if( CrossOver(bar, RatioSMA, RatioSMA2 ) )
						{
							longSymbol = stock1;
							shortSymbol = stock2;
							SetContext( longSymbol, true );
							BuyAtClose( bar, "TF Buy " + shortSymbol );
							SetContext( shortSymbol, true );
							ShortAtClose( bar, "TF Short " + longSymbol );
						}
					}
				}
				else
					// Mean reverting strategy
					if( mode == -1 )
				{
					if( IsLastPositionActive )
					{
						if (Ratio[bar] > RatioSMA[bar])
							ExitAtClose(bar, Position.AllPositions);
					}
					else
					{
						if (Ratio[bar] < RatioSMA[bar])
						{
							longSymbol = stock1;
							shortSymbol = stock2;
							SetContext( longSymbol, true );
							BuyAtClose( bar, "MR Buy " + shortSymbol );
							SetContext( shortSymbol, true );
							ShortAtClose( bar, "MR Short " + longSymbol );
						}
					}
				}
				else // Trend pullback strategy
					if( mode == 0 )
				{
					if( IsLastPositionActive )
					{
						if( (RatioSMA[bar] < RatioSMA2[bar]) && (Ratio[bar] > RatioSMA[bar]) )
							ExitAtClose(bar, Position.AllPositions);
					}
					else
					{
						if( (RatioSMA[bar] > RatioSMA2[bar]) && (Ratio[bar] < RatioSMA[bar]) )
						{
							longSymbol = stock1;
							shortSymbol = stock2;
							SetContext( longSymbol, true );
							BuyAtClose( bar, "PB Buy " + shortSymbol );
							SetContext( shortSymbol, true );
							ShortAtClose( bar, "PB Short " + longSymbol );
						}
					}
				}

				RestoreContext();
			}
		}
	}
}
—Eugene, Wealth-Lab team
MS123, LLC
www.wealth-lab.com
BACK TO LIST

NEUROSHELL TRADER: DECEMBER 2016
The mean-reverting pair-trading system described by Domenico D’Errico in his article in this issue, “Pair Trading With A Twist,” can be easily implemented in NeuroShell Trader through use of the pair-trading indicators from the Advanced Indicator Set 3 add-on.
To identify which instruments should be traded in a pair, you can use a neural network to select one stock from a group of stocks to predict another. The trick is to limit the neural net to one input and it will find the best pair.
Once the pair is identified, the trading strategy will determine when the prediction crosses the actual price of the predicted stock to generate trading signals. Simply select “New trading strategy” from the insert menu and enter the following in the appropriate locations of the trading strategy wizard:
TRADING RULES

BUY LONG CONDITIONS: [All of which must be true]
     A=B(ProxyEntry(Close,AMERICAN TOWER CORP Close,Verizon Communications Close,AMERICAN TOWER CORP Close,Prediction: 0 bar AMERICAN TOWER CORP Close,4.61),1)

SELL LONG CONDITIONS: [All of which must be true]
     ProxyExit(Close,AMERICAN TOWER CORP Close,Prediction: 0 bar AMERICAN TOWER CORP Close,0.38,12.95)

SELL SHORT CONDITIONS: [All of which must be true]
     A=B(ProxyEntry(Close,AMERICAN TOWER CORP Close,Verizon Communications Close,AMERICAN TOWER CORP Close,Prediction: 0 bar AMERICAN TOWER CORP Close,4.61),-1)

COVER SHORT CONDITIONS: [All of which must be true]
     ProxyExit(Close,AMERICAN TOWER CORP Close,Prediction: 0 bar AMERICAN TOWER CORP Close,0.38,12.95)

POSITION SIZING METHOD:
     Fixed Dollar
          5,000.00 Dollars
If you have NeuroShell Trader Professional, you can also choose whether the parameters should be optimized. After backtesting the trading strategy, use the detailed analysis button to view the backtest and trade-by-trade statistics for the strategy.
For more detailed information on how to implement the use of proxy pair-trading indicators in NeuroShell Trader, please refer to the February 2010 article in Stocks & Commodities, “Neural Network Pair Trading.”
Users of NeuroShell Trader can go to the Stocks & Commodities section of the NeuroShell Trader free technical support website to download a copy of this or any previous Traders’ Tips.
A sample chart is shown in Figure 6.
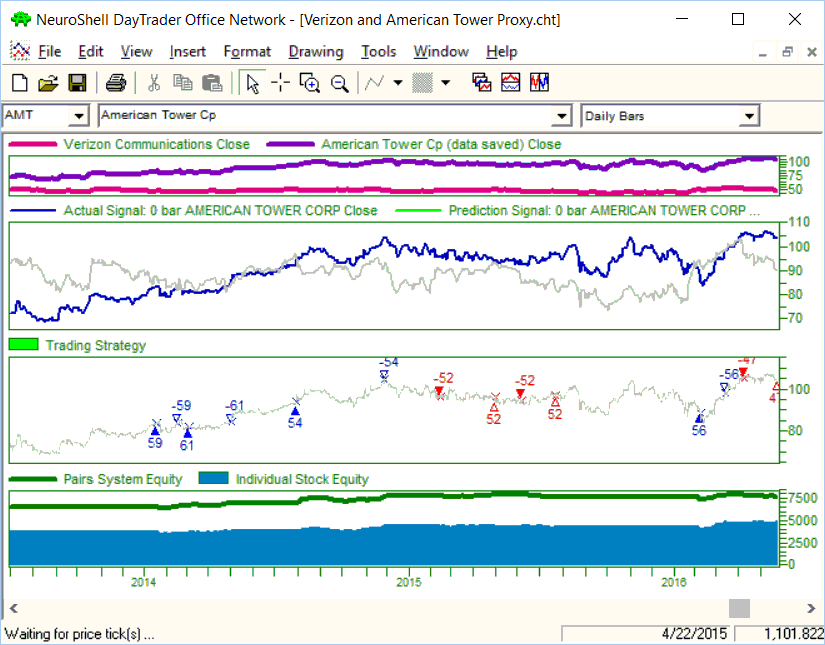
FIGURE 6: NEUROSHELL TRADER. This NeuroShell Trader chart displays the pair-trading system as implemented in NeuroShell Trader.
—Marge Sherald, Ward Systems Group, Inc.
301 662-7950, sales@wardsystems.com
www.neuroshell.com
BACK TO LIST

NINJATRADER: DECEMBER 2016
The NinjaTrader coding based on “Pair Trading With A Twist” by Domenico D’Errico in this issue is available for download at www.ninjatrader.com/SC/December2016SC.zip.
Once you have it downloaded, from within the NinjaTrader Control Center window, select the menu File → Utilities → Import NinjaScript and select the downloaded file. This file is for NinjaTrader Version 7.
You can review the strategies’ source code by selecting the menu Tools → Edit NinjaScript → Strategy from within the NinjaTrader Control Center window and selecting either the “Trend Following,” “Mean-Reverting,” or “Trend & Pullback” file.
NinjaScript uses compiled DLLs that run native, not interpreted, which provides you with the highest performance possible.
A sample chart implementing the strategy is shown in Figure 7.

FIGURE 7: NINJATRADER. The trend-following strategy is shown on an IBM weekly chart with the spread candlestick moving averages as well as the spread moving average cross histogram.
—Raymond Deux & Patrick Hodges
NinjaTrader, LLC
www.ninjatrader.com
BACK TO LIST

UPDATA: DECEMBER 2016
Our Traders’ Tip for this month is based on the article in this issue by Domenico D’Errico, “Pair Trading With A Twist.”
In the article, D’Errico outlines the benefits of trading a spread of two similar products that are correlated in returns, and then using the pair to enter mean-reversion strategies when at an extreme. The key to a good strategy is finding a stable pair that mean-reverts. Perhaps cointegration tests would serve better here than correlation-based pair selection.
The Updata code based on this article is in the Updata library and may be downloaded by clicking the custom menu and system library. Those who cannot access the library due to firewall issues may ask our helpdesk for a copy.
A sample chart implementing the strategy is shown in Figure 8.
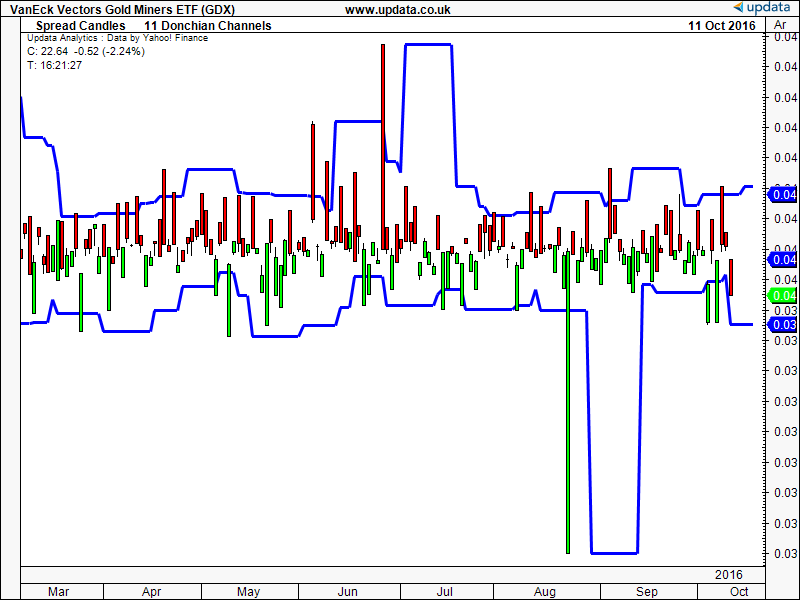
FIGURE 8: UPDATA. This chart shows the spread candles as applied to the GDX/GDM ETF pair in daily resolution.
PARAMETER "Select Ticker" ~TICKER=Select
NAME "Spread Candles" ""
DISPLAYSTYLE Candle
INDICATORTYPE Chart Replace
@SpreadOpen=0
@SpreadHigh=0
@SpreadLow=0
@SpreadClose=0

FOR #CURDATE=0 TO #LASTDATE

    If #CURDATE>0 AND Open>0 AND Open(~TICKER,0) >0

       @SpreadOpen=Open/Open(~TICKER,0)
       @SpreadClose=Close/Close(~TICKER,0)

       @SpreadHigh=Max(Close/Close(~TICKER,0),Max(Open/Open(~TICKER,0),Max(High/High(~TICKER,0),Low/Low(~TICKER,0))))
       @SpreadLow=Min(Close/Close(~TICKER,0),Min(Open/Open(~TICKER,0),Min(High/High(~TICKER,0),Low/Low(~TICKER,0))))
       @PlotOpen=@SpreadOpen
       @PlotHigh=@SpreadHigh
       @PlotLow=@SpreadLow
       @Plot=@SpreadClose

    EndIf

NEXT
—Updata support team
support@updata.co.uk
www.updata.co.uk
BACK TO LIST
Originally published in the December 2016 issue of
Technical Analysis of STOCKS & COMMODITIES magazine.
All rights reserved. © Copyright 2016, Technical Analysis, Inc.


