TRADERS’ TIPS
March 2017
For this month’s Traders’ Tips, the focus is Ken Calhoun’s article in this issue, “Golden Cross Breakouts.” Here, we present the March 2017 Traders’ Tips code with possible implementations in various software.
The Traders’ Tips section is provided to help the reader implement a selected technique from an article in this issue or another recent issue. The entries here are contributed by software developers or programmers for software that is capable of customization.

TRADESTATION: MARCH 2017
In “Golden Cross Breakouts” in this issue, author Ken Calhoun describes his methodology for trading using the popular chart pattern commonly known as the golden cross. He defines the golden cross as a 50-period simple moving average crossing above a 200-period simple moving average. The author suggests using this indicator in conjunction with other price-action patterns.
The TradeStation platform has many built-in indicators that can be evaluated along with the golden cross. Here, we are providing TradeStation EasyLanguage code for a golden cross strategy based on the author’s concepts. We have also included an indicator that can be used in the TradeStation Scanner application to help identify trading opportunities.
Indicator: Golden Cross Breakouts
// TASC MAR 2017
// Golden Cross Breakouts
// Ken Calhoun

inputs:
	FastLength( 50 ),
	SlowLength( 200 ),
	MaxBarsSinceCross( 10 ),
	MinPercentRange( 25 ) ;

variables:
	FastAvgValue( 0 ),
	SlowAvgValue( 0 ),
	BarsSinceCross( 0 ),
	PercentRange( 0 ) ;

FastAvgValue = Average( Close, FastLength ) ;
SlowAvgValue = Average( Close, SlowLength ) ;

PercentRange = 100 * ( Highest( High, FastLength ) - Lowest( Low, FastLength ) )/ Close ;

if FastAvgValue > SlowAvgValue then
	BarsSinceCross += 1
else
	BarsSinceCross = 0 ;

Plot1( BarsSinceCross ) ;

if BarsSinceCross > 0
	and BarsSinceCross <= MaxBarsSinceCross
	and PercentRange >= MinPercentRange then
		Alert ;


Strategy: Golden Cross Breakouts
// TASC MAR 2017
// Golden Cross Breakouts
// Ken Calhoun

inputs:
	FastLength( 50 ),
	SlowLength( 200 ),
	TrailAmountDollars( 2 ),
	BreakoutLookBack( 20 ),
	VolumeMultRequired( 1.5 ) ;

variables:
	FastAvgValue( 0 ),
	SlowAvgValue( 0 ),
	BarVolume( 0 ),
	AvgVolume( 0 ),
	BreakOutPrice( 0 ),
	EntryOK( false ),
	MP( 0 ),
	TT( 0 ) ;

MP = MarketPosition ;
TT = TotalTrades ;

FastAvgValue = Average( Close, FastLength ) ;
SlowAvgValue = Average( Close, SlowLength ) ;

if BarType >= 2 and BarType < 5 then
	BarVolume = Volume
else
	BarVolume = Ticks ;

AvgVolume = Average( BarVolume, FastLength ) ;

if FastAvgValue crosses over SlowAvgValue then
	begin
	BreakOutPrice = Highest( High, BreakoutLookBack ) ;
	EntryOK = true ;
	end ;

if MP <> MP[1]
	or TT <> TT[1]
	or FastAvgValue crosses under SlowAvgValue then
	EntryOK = false ;

if EntryOK
	and Close > BreakOutPrice
	and BarVolume >= AvgVolume * VolumeMultRequired then
		Buy next bar at Market ;

if Close crosses below FastAvgValue then
	Sell next bar at Market ;

SetStopShare ;
SetDollarTrailing( TrailAmountDollars ) ;
To download the EasyLanguage code for the indicator and strategy, please visit our TradeStation and EasyLanguage support forum. The code can be found here: https://community.tradestation.com/Discussions/Topic.aspx?Topic_ID=147651. The ELD filename is “TASC_MAR2017.ELD.”
For more information about EasyLanguage in general, please see https://www.tradestation.com/EL-FAQ.
A sample chart is shown in Figure 1.

FIGURE 1: TRADESTATION SCANNER. Here, the golden cross breakout strategy is applied to a daily chart of Blackstone Group LP along with a TradeStation Scanner results list of candidate symbols.
This article is for informational purposes. No type of trading or investment recommendation, advice, or strategy is being made, given, or in any manner provided by TradeStation Securities or its affiliates.
—Doug McCrary
TradeStation Securities, Inc.
www.TradeStation.com
BACK TO LIST

METASTOCK: MARCH 2017
Ken Calhoun’s article in this issue, “Golden Cross Breakouts,” presents a trading system based on a popular pattern. The MetaStock formulas that implement the buy and sell signals for the pattern are given here:
Buy signal
Cross( Mov( C, 50, S), Mov( C, 200, S) )

Sell signal
bsig:= Cross( Mov( C, 50, S), Mov( C, 200, S) );
ssig:= Cross( Mov( C, 200, S), Mov( C, 50, S) );
stop:= C - 2;
trade:= If( PREV<=0, If( bsig, stop, 0),
If( ssig, -1, If( L  < PREV, -2, Max(PREV, stop))));
trade < 0
—William Golson
MetaStock Technical Support
www.metastock.com
BACK TO LIST

TC2000: MARCH 2017
The golden cross breakout strategy described by Ken Calhoun in his column in this issue titled “Golden Cross Breakouts” can be easily applied in TC2000 version 17 using the new EasyScan columns and enhanced custom formula language.
We used the new scan columns and enhanced formula language in version 17 to scan for stocks between $20 and $70 where the 50-day simple moving average has crossed up through the 200-day moving average within the last 10 days.
The formula for the golden cross uses the new “XUP” function in the custom formula language: XUP(AVGC50,AVGC200,10). This returns “true” when AVGC50 (50-period simple moving average) was less than AVGC200 10 days ago and it is now greater than AVGC200.
The sample chart in Figure 2 shows the golden cross (point 1) that occurred six days previous. Using the simulated trading features in TC2000, we entered a long position of 100 shares of FOX at $29.01 and set a trailing stop at the 50-day moving average (point 2).
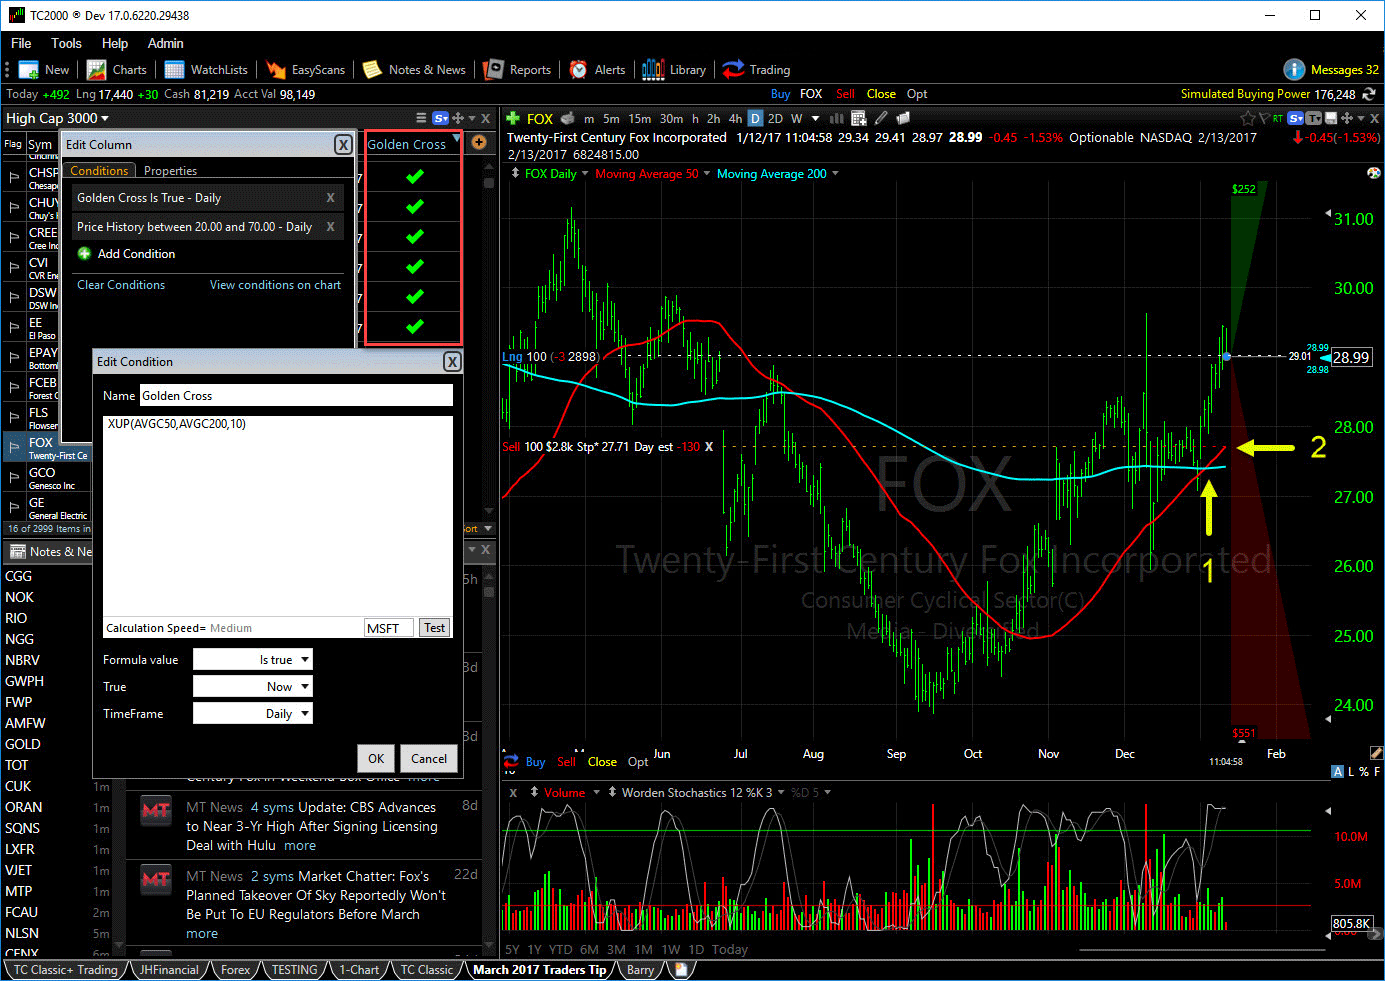
FIGURE 2: TC2000. Here is a chart of FOX showing the daily timeframe. The golden cross column shows checkmarks on stocks with golden crossovers in the last 10 days. The column properties show the golden cross condition and the condition for price being between $20 and $70.
You can try the simulated trading yourself at www.TC2000.com.
—Patrick Argo
Worden Brothers, Inc.
www.TC2000.com
BACK TO LIST

eSIGNAL: MARCH 2017
For this month’s Traders’ Tip, we’ve provided the study GoldenCrossBkout.efs based on the formula described in Ken Calhoun’s article in this issue, “Golden Cross Breakouts.” In it, the author presents a strategy of trading the golden cross, which is when the 50-day moving average crosses above the 200-day moving average.
The eSignal study contains formula parameters that may be configured through the edit chart window (right-click on the chart and select “edit chart”). A sample chart is shown in Figure 3.

FIGURE 3: eSIGNAL. Here is an example of the GoldenCrossBreakout study plotted on a daily chart of Spirit AeroSystems Holdings (SPR).
To discuss this study or download a complete copy of the formula code, please visit the EFS Library discussion board forum under the forums link from the support menu at www.esignal.com or visit our EFS KnowledgeBase at https://www.esignal.com/support/kb/efs/. The eSignal formula script (EFS) is also available here:
/*********************************
Provided By:
eSignal (Copyright c eSignal), a division of Interactive Data
Corporation. 2017. All rights reserved. This sample eSignal
Formula Script (EFS) is for educational purposes only and may be
modified and saved under a new file name.  eSignal is not responsible
for the functionality once modified.  eSignal reserves the right
to modify and overwrite this EFS file with each new release.

Description:
    Golden Cross Breakouts by Ken Calhoun

Version:            1.00  01/10/2017

Formula Parameters:                     Default:
Fast MA Length                          50
Slow MA Length                          200
Trailing Stop                           2.0


Notes:
The related article is copyrighted material. If you are not a subscriber
of Stocks & Commodities, please visit www.traders.com.

**********************************/

var fpArray = new Array();

function preMain(){

    setPriceStudy(true);
    setStudyTitle("Golden Cross Breakouts");

    setDefaultBarFgColor(Color.red, 0);
    setDefaultBarFgColor(Color.green, 1);

    var x=0;
    fpArray[x] = new FunctionParameter("FastMALen", FunctionParameter.NUMBER);
	with(fpArray[x++]){
        setLowerLimit(1);
        setDefault(50);
        setName("Fast Average");
    }
    fpArray[x] = new FunctionParameter("SlowMALen", FunctionParameter.NUMBER);
	with(fpArray[x++]){
        setLowerLimit(1);
        setDefault(200);
        setName("Slow Average");
    }
    fpArray[x] = new FunctionParameter("TrlStop", FunctionParameter.NUMBER);
	with(fpArray[x++]){
        setLowerLimit(0.01);
        setDefault(2.0);
        setName("Trailing Stop");
    }
}

var bVersion = null;
var bInit = false;
var xFastMA = null;
var xSlowMA = null;
var xHigh = null;
var xLow = null;
var bIsLong = false;
var vHighestHigh = null;
var vStopPrice = null;

function main(FastMALen, SlowMALen, TrlStop){

    if (bVersion == null) bVersion = verify();
    if (bVersion == false) return;

    if(getBarState() == BARSTATE_ALLBARS){
        setCursorLabelName("SMA("+FastMALen+")", 0);
        setCursorLabelName("SMA("+SlowMALen+")", 1);
        bInit = false;
    }

    if (!bInit){
        xFastMA = sma(FastMALen);
        xSlowMA = sma(SlowMALen)
        xHigh = high();
        xLow = low();
        bIsLong = false;
        bInit = true;
    }

    var nLow = xLow.getValue(0);
    var nHigh = xHigh.getValue(0);
    var nFastMA = xFastMA.getValue(0);
    var nFastMA1 = xFastMA.getValue(-1);
    var nSlowMA = xSlowMA.getValue(0);
    var nSlowMA1 = xSlowMA.getValue(-1);

    if(nSlowMA1 == null) return;

    if (bIsLong){
        if (nHigh > vHighestHigh && (nLow - TrlStop) > vStopPrice) {
            vStopPrice = (nLow - TrlStop);
            vHighestHigh = nHigh
        }
        else if (nLow <= vStopPrice){
            bIsLong = false;
            drawTextRelative(0, AboveBar1, "\u00EA", Color.red, null, Text.PRESET|Text.CENTER, "Wingdings", 10, "Exit"+rawtime(0));
            drawText("Suggested Long Exit at "+formatPriceNumber(vStopPrice),BottomRow1,Color.red,Text.LEFT,"Text Exit"+rawtime(0));
        }
    }

    if (nFastMA > nSlowMA && nFastMA1 <= nSlowMA1) {
        drawTextRelative(0, BelowBar1, "\u00E9", Color.green, null, Text.PRESET|Text.CENTER, "Wingdings", 10, "Long"+rawtime(0));
        drawText("Suggested Long Entry at "+formatPriceNumber(close(0)),TopRow1,Color.green,Text.LEFT,"Text"+rawtime(0));
        bIsLong = true;
        vStopPrice = (nLow - TrlStop);
        vHighestHigh = nHigh;
    }

    return [nFastMA, nSlowMA];
}

function verify(){
    var b = false;
    if (getBuildNumber() < 779){

        drawTextAbsolute(5, 35, "This study requires version 12.1 or later.",
            Color.white, Color.blue, Text.RELATIVETOBOTTOM|Text.RELATIVETOLEFT|Text.BOLD|Text.LEFT,
            null, 13, "error");
        drawTextAbsolute(5, 20, "Click HERE to upgrade.@URL=https://www.esignal.com/download/default.asp",
            Color.white, Color.blue, Text.RELATIVETOBOTTOM|Text.RELATIVETOLEFT|Text.BOLD|Text.LEFT,
            null, 13, "upgrade");
        return b;
    }
    else
        b = true;

    return b;
}
—Eric Lippert
eSignal, an Interactive Data company
800 779-6555, www.eSignal.com
BACK TO LIST

THINKORSWIM: MARCH 2017
In “Golden Cross Breakouts” by Ken Calhoun in this issue, we get a lesson on a classic market condition with some in-depth information. The idea of the article is that these well-understood tools and rules can be used with new strategies.
We took this strategy and built it using our proprietary scripting language, thinkscript. We have made the loading process extremely easy. Simply click on the link https://tos.mx/szjMnh and then choose to view thinkScript strategy.

FIGURE 4: THINKORSWIM. Here, the GoldenCrossBreakoutsLE strategy is shown on a six-month daily chart of Spirit Aerosystems (SPR).
In Figure 4, you can see the GoldenCrossBreakoutsLE strategy added to a six-month daily chart of Spirit Aerosystems (SPR). Based on Calhoun’s article, when the 50-day moving average (the blue line) crosses above the 200-day moving average (the pink line), it is a buy signal. The strategy on thinkorswim charts start calculating the trade from this point. We have also added the prebuilt TrailingStopLX strategy to help chartists understand about taking profits or protecting capital. See the article in this issue for more details on the strategy.
—thinkorswim
A division of TD Ameritrade, Inc.
www.thinkorswim.com
BACK TO LIST

WEALTH-LAB: MARCH 2017
The golden cross system for swing trading described by Ken Calhoun in his article in this issue, “Golden Cross Breakouts,” can be recreated in Wealth-Lab entirely from the building blocks known as rules in a drag-and-drop manner. No coding is required.
Figure 5 illustrates the necessary conditions and the order in which they should be stacked. When you combine the rules as shown in Figure 5, the system will exit with a dollar-based trailing exit or after an opposite event—the crossunder of 50-day and 200-day moving averages (MAs).
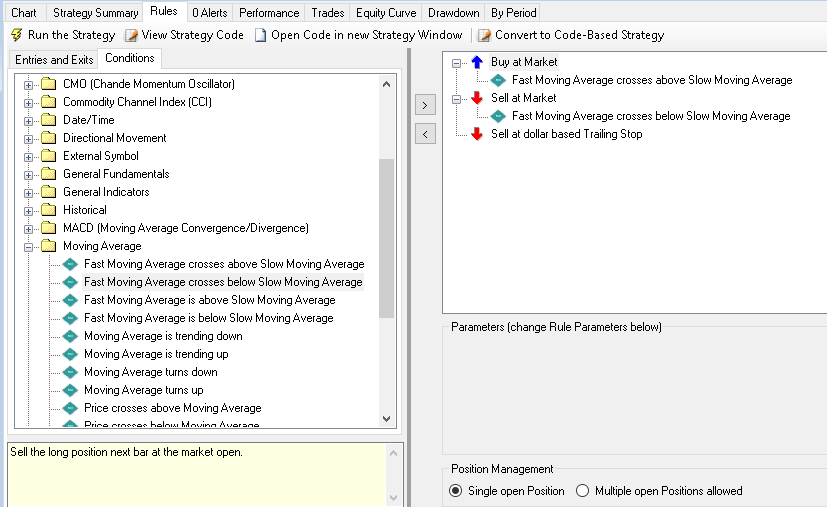
FIGURE 5: WEALTH-LAB. Here is a guideline for setting up the example system using drag-and-drop rules.
To add more interactivity, click a nearby parameter to expose it as a parameter slider. This way, its value can be changed by dragging the slider on the bottom-left part of the screen. When you run the system on the chart of a single stock (as opposed to a multisymbol portfolio), Wealth-Lab automatically and conveniently applies changed parameters so you have a chance to see how entries and exits change interactively on the chart.
On a closing note, to apply the system to stocks of a different price range, you might want to either replace the rule with a percent-based or ATR-based trailing stop, or simply change the trailing dollar value.
A sample chart implementation is shown in Figure 6.
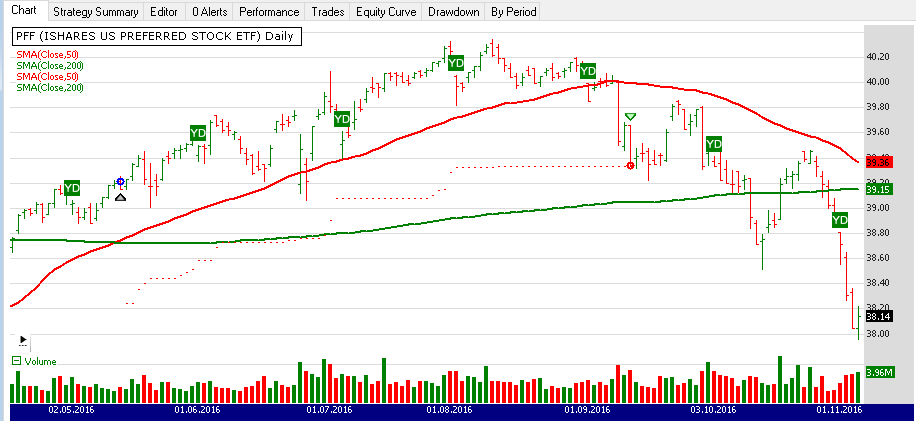
FIGURE 6: WEALTH-LAB. Here, the system is applied to a matching ETF (PFF).
—Eugene, Wealth-Lab team
www.wealth-lab.com
BACK TO LIST

AMIBROKER: MARCH 2017
In “Golden Cross Breakouts” in this issue, author Ken Calhoun shows a simple swing trade strategy based on the golden cross pattern, which is 50-period simple moving average (SMA) crossing over a 200-period SMA.
A ready-to-use AmiBroker formula is presented here that replicates the chart shown in the article with the moving averages and trading system with the golden cross entry and two-point trailing stop.
sm = MA( C, 50 );
lm = MA( C, 200 );

GoldenCross = Cross( sm, lm );

// Buy when GoldenCross occurs
Buy = GoldenCross;
Sell = 0; // exit by stop only
// trailing stop based on close prices
ApplyStop( stopTypeTrailing, stopModePoint, 2, False );
Equity( 1 ); // evaluate stops

// charts
Plot( C, "Price", colorDefault, styleCandle );
Plot( sm, "MA50", colorRed );
Plot( lm, "MA200", colorBlue );

// buy/sell arrows
PlotShapes( IIf( Buy,  shapeUpArrow,   0 ), colorGreen, 0, L );
PlotShapes( IIf( Sell, shapeDownArrow, 0 ), colorRed,   0, H );
A sample chart is shown in Figure 7.
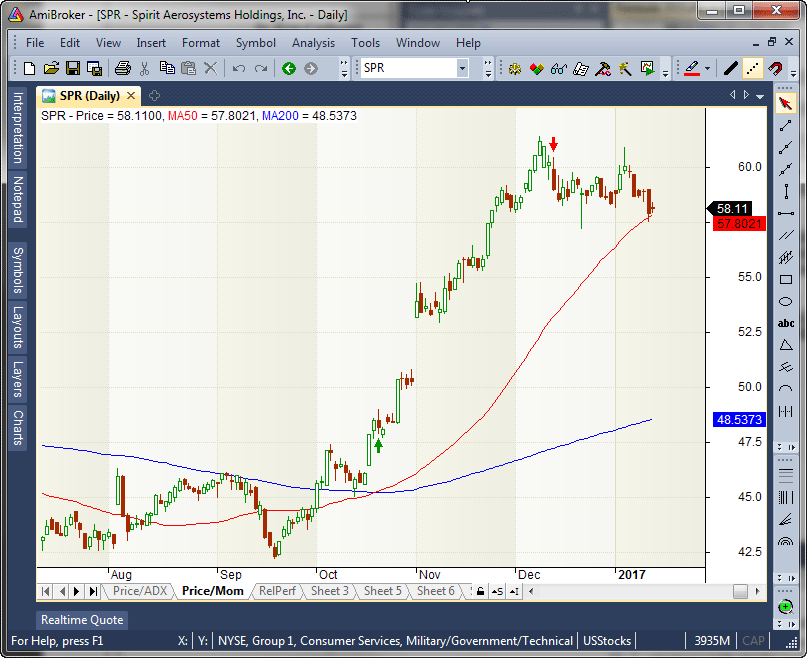
FIGURE 7: AMIBROKER. Entry and exit points are shown with arrows on a daily candlestick chart of SPR (Spirit Aerosystems) with 50/200 day moving averages, replicating the chart from Ken Calhoun’s article in this issue.
—Tomasz Janeczko, AmiBroker.com
www.amibroker.com
BACK TO LIST

NEUROSHELL TRADER: MARCH 2017
A golden cross breakout trading system such as the one described by Ken Calhoun in “Golden Cross Breakouts” in this issue can be easily implemented in NeuroShell Trader.
Simply select new trading strategy from the insert menu and enter the following in the appropriate locations of the trading strategy wizard:
BUY LONG CONDITIONS: [all of which must be true]
     Avg Crossover Above (Close, 50, 200)

LONG TRAILING STOP PRICES:
     TrailPricePnts( Trading Strategy, 2)
If you have NeuroShell Trader Professional, you can also choose whether the parameters should be optimized. After backtesting the trading strategy, use the detailed analysis button to view the backtest and trade-by-trade statistics for the strategy.
Users of NeuroShell Trader can go to the STOCKS & COMMODITIES section of the NeuroShell Trader free technical support website to download a copy of this or any previous Traders’ Tips.
A sample chart is shown in Figure 8.

FIGURE 8: NEUROSHELL TRADER. Here is a sample NeuroShell Trader chart showing the golden cross trading system for SPR.
—Marge Sherald, Ward Systems Group, Inc.
301 662-7950, sales@wardsystems.com
www.neuroshell.com
BACK TO LIST

AIQ: MARCH 2017
The AIQ code based on Ken Calhoun’s article in this issue, “Golden Cross Breakouts,” can be found at www.TradersEdgeSystems.com/traderstips.htm.
I tested the author’s system using the NASDAQ 100 list of stocks from the year 2000 through 1/11/2017. I also coded an alternative exit that held positions much longer. Figure 9 shows the author’s system and exit, and Figure 10 shows the same golden cross entry but with my alternative exit. My alternative exit has the following rules:
- Sell when the 50-day moving average crosses through the 200-day moving average, or
- Sell using a profit-protect type of trailing stop set to trigger when profit is greater than or equal to 15%, then exit if profit drops to 1% (do not let a profit of X% turn into a loss).
The alternative exit significantly extended the average holding period from 32 calendar days to 304 calendar days and reduced the number of trades from 7,782 to 936. The ROI and reward-to-risk ratio were both better with the alternative exit.

FIGURE 9: AIQ. Here are sample summary test results for the strategy described in Ken Calhoun’s article in this issue.

FIGURE 10: AIQ. Here are sample summary test results for the same entries as in Figure 9 for the golden cross strategy but using my alternative exit rules.
!GOLDEN CROSS BREAKOUTS
!Author: Ken Calhoun, TASC March 2017
!Coded by: Richard Denning, 1/8/17
!www.TradersEdgeSystems.com

!INPUTS:
len1 is 50.
len2 is 200.
stopamt is 2.
minPrice is 5.
maxPrice is 70.

SMA1 is simpleavg([close],len1).
SMA2 is simpleavg([close],len2).

GoldenCrossUp if SMA1 > SMA2 and valrule(SMA1<SMA2,1).
Golden if SMA1 > SMA2.
PriceOK if simpleavg([close],10) >=minPrice and simpleavg([close],10)<=70.

Buy if Golden and PriceOK.
Sell if Golden=0 or [close] < {Position High Price}-stopamt.

Buy1 if Golden and PriceOK.
Sell1 if Golden=0. !and use built-in profit protect[1,15]
Again, the code and EDS file can be downloaded from www.TradersEdgeSystems.com/traderstips.htm.
—Richard Denning
info@TradersEdgeSystems.com
for AIQ Systems
BACK TO LIST

TRADERSSTUDIO: MARCH 2017
The TradersStudio code based on Ken Calhoun’s article in this issue, “Golden Cross Breakouts,” can be found at www.TradersEdgeSystems.com/traderstips.htm.
The following code file is provided in the download:
- System: GOLDEN_X—A system that buys on golden cross up and sells on golden cross down.
Figure 11 shows the equity curve trading 200 shares of each of the NASDAQ 100 list of stocks from March 2000 through June 2016. I did not use the two-point trailing stop for this test.

FIGURE 11: TRADERSSTUDIO. Here is a sample equity curve trading 200 shares of each of the NASDAQ 100 list of stocks from March 2000 through June 2016.
The code is shown here:
'GOLDEN CROSS BREAKOUTS
'Author: Ken Calhoun, TASC March 2017
'Coded by: Richard Denning, 1/8/17
'www.TradersEdgeSystems.com

Sub GOLDEN_X(len1, len2, stopamt, minPrice, maxPrice)
'INPUTS:
'len1 = 50
'len2 = 200
'stopamt = 2
'minPrice = 20
'maxPrice = 70
Dim SMA1 As BarArray
Dim SMA2 As BarArray
Dim Golden,PriceOK
SMA1 = Average(C,len1)
SMA2 = Average(C,len2)

Golden = SMA1 > SMA2
PriceOK = Average(TSCLose,10)>=minPrice And Average(TSCLose,10)<=maxPrice

If Golden And PriceOK Then Buy("LE",1,"",Market,Day)
If Golden=0 Then ExitLong("LX","",1,"",Market,Day)
'If C < (Highest(C,BarsSinceEntry,0))-stopamt Then ExitLong("LXstop","",1,"",Market,Day)

End Sub
—Richard Denning
info@TradersEdgeSystems.com
for TradersStudio
BACK TO LIST

NINJATRADER: MARCH 2017
The golden cross breakout strategy, as discussed in “Golden Cross Breakouts” by Ken Calhoun in this issue, is available for download at the following links for NinjaTrader 8 and NinjaTrader 7:
Once the file is downloaded, you can import the strategy into NinjaTader 8 from within the Control Center by selecting Tools → Import → NinjaScript Add-On and then selecting the downloaded file for NinjaTrader 8. To import into NinjaTrader 7, from within the Control Center window, select the menu File → Utilities → Import NinjaScript and select the downloaded file.
You can review the strategy’s source code in NinjaTrader 8 by selecting the menu New → NinjaScript Editor → Strategies from within the Control Center window and selecting the GoldenCrossBreakout file. You can review the strategy’s source code in NinjaTrader 7 by selecting the menu Tools → Edit NinjaScript → Strategy from within the Control Center window and selecting the GoldenCrossBreakout file.
NinjaScript uses compiled DLLs that run native, not interpreted, which provides you with the highest performance possible.
A sample chart implementing the strategy is shown in Figure 12.

FIGURE 12: NINJATRADER. The GoldenCrossBreakout strategy displays the long entry for the crossing of the 50 SMA over the 200 SMA on the SPR daily chart for October 2016.
—Raymond Deux & Patrick Hodges
NinjaTrader, LLC
www.ninjatrader.com
BACK TO LIST

UPDATA: MARCH 2017
Our Traders’ Tip for this month is based on Ken Calhoun’s column in this issue, “Golden Cross Breakouts.”
In the article, Calhoun proposes that this classical technical analysis setup be used in conjunction with other filters, such as rising volume, to better identify trends with the potential for persistence, with the suggestion that ETFs in the $20–$70 range are those products with better potential.
The Updata code for this article is in the Updata library and may be downloaded by clicking the custom menu and system library. Those who cannot access the library due to a firewall may paste the code here into the Updata custom editor and save it.
NAME Golden Crossover System

Parameter "Period 1" #PERIOD1=50
Parameter "Period 2" #PERIOD2=200

INDICATORTYPE TOOL
DISPLAYSTYLE 2LINES
PLOTSTYLE LINE RGB(255,0,0)
PLOTSTYLE2 LINE RGB(0,255,0)
SHOWEQUITYCURVE

FOR #CURDATE=#PERIOD2 to #LASTDATE
   IF HASX(MAVE(#PERIOD1),MAVE(#PERIOD2),UP)
      COVER
      BUY
   ELSEIF HASX(MAVE(#PERIOD1),MAVE(#PERIOD2),DOWN)
      SELL
      SHORT
   ENDIF
   @PLOT=MAVE(#PERIOD1)
   @PLOT2=MAVE(#PERIOD2)
NEXT
A sample chart is shown in Figure 13.
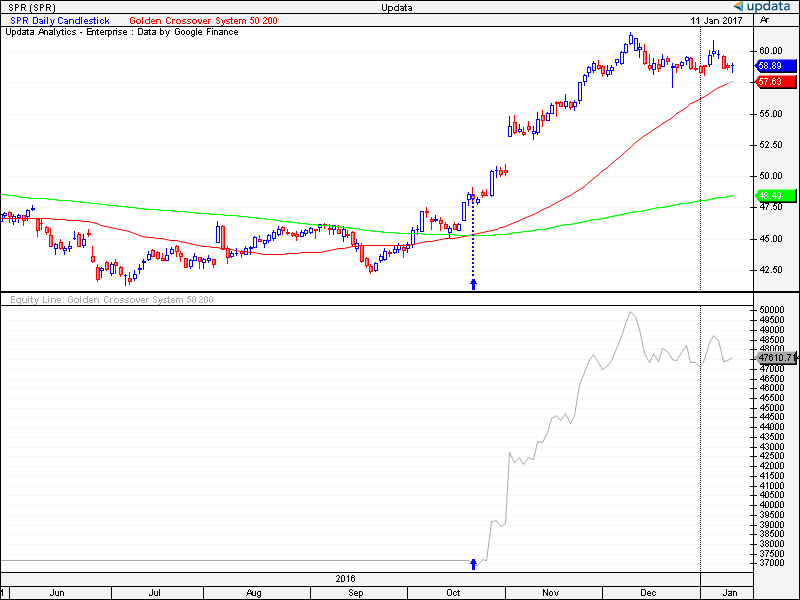
FIGURE 13: UPDATA. Here is an example of the golden cross breakout system applied to daily chart of Spirit Aerosystems Holdings Inc. (SPR).
—Updata support team
support@updata.co.uk
www.updata.co.uk
BACK TO LIST
MICROSOFT EXCEL: MARCH 2017
In “Golden Cross Breakouts” in this issue, author Ken Calhoun explains the workings of a simple trend-following trading system based on the golden cross chart formation.
For any given security, you may not find more than one golden cross in any given year, and some years you may not find any. Thus, you should expect to scan quite a few securities to find one.
But when you do find one, it can provide an interesting ride, as demonstrated by the Spirit Aerosystems Holdings example given in Figure 1 of Calhoun’s article in this issue.
As I write this in the middle of January 2017, I have access to a few more bars of data than were available when Calhoun produced Figure 1 for his article. So we can see a bit more of how this example played out (Figure 14).

FIGURE 14: EXCEL, GOLDEN CROSS TRADE. A two-point trailing stop was hit on 12/13/2016, and a 50-day moving average stop would have hit on 01/12/2017.
The golden cross signals a buy with the 50-bar average crossing above the 200-bar average on 10/20/2016.
In this trading simulation, we buy at the open of the next bar.
The price hits our two-point trailing stop on 12/13/2016 and we sell at the open of the next bar.
The Excel spreadsheet I have created for this issue (available here) is set up to process 2,500 bars, or just short of 10 years of historical data.
The transaction summary tab shown in Figure 15 shows that in that period, there were six trades including a couple of nice wins, a couple of so-so wins, and a couple that lost a bit. Gotta love those trailing stops!

FIGURE 15: EXCEL, EXAMPLE TRANSACTIONS SUMMARY. Over the course of nine years, we find six golden cross events, including a couple of nice wins.
Figure 16 takes a closer look at the 6/11/2009 trade, which began with a signal on 06/10/2009. The signal bar was very nearly the highest bar on the chart, and things moved downhill from there. The trailing stop pulled us out of this one. That was pretty much at the same point that a stop based on the 50-bar average would have hit.

FIGURE 16: EXCEL, ONE OF THE SMALL-LOSS TRADES. A strategy based on the golden cross makes for an interesting, simple trading system.
SUGGESTIONS
There are several keys to using the golden cross indicator:
- Access to 200-plus bars of recent historical data for a lot of symbols
- A mechanism to scan across this symbol universe and flag symbols showing a golden cross signal in the last several days. This may be a very small number of symbols much of the time
- Really good money management / position sizing for any trades taken based on this indicator
- Strict adherence to the stop-loss.
For those who are not shy about taking short positions, the death cross indicator is the exact mirror of the golden cross indicator. You would sell when the 50-bar average crosses below the 200-bar average and buy back when the two-point stop-loss hits.
Because the death cross alternates with the golden cross, there were five or six death cross signals buried in the data used to create my list of sample transactions.
The spreadsheet file for this Traders’ Tip can be downloaded below. To successfully download it, follow these steps:
- Right-click on the Excel file link (GoldenCrossBreakout.xlsm), then
- Select “save as” (or “save target as”) to place a copy of the spreadsheet file on your hard drive.
—Ron McAllister
Excel and VBA programmer
rpmac_xltt@sprynet.com
BACK TO LIST
Originally published in the March 2017 issue of
Technical Analysis of STOCKS & COMMODITIES magazine.
All rights reserved. © Copyright 2017, Technical Analysis, Inc.


