TRADERS’ TIPS
April 2017
For this month’s Traders’ Tips, the focus is Ken Calhoun’s
article from the February issue, “Volume-Weighted
Moving Average Breakouts.” Here, we present the April 2017 Traders’ Tips
code with possible implementations in various software.
The Traders’ Tips section is provided to help the reader implement
a selected technique from an article in this issue or another recent issue.
The entries here are contributed by software developers or programmers for
software that is capable of customization.

TRADESTATION: APRIL 2017
In “Volume-Weighted Moving Average Breakouts,” which appeared in the February
2017 issue of Technical Analysis of STOCKS & COMMODITIES, author
Ken Calhoun describes using a modified moving average calculation that combines
price and volume information. The author states that by including volume, this
technique can help avoid false breakouts.
Here, we are providing the TradeStation EasyLanguage code for the volume-weighted
moving average indicator. The indicator includes an additional simple moving
average (SMA), making it useful for scanning for crossovers using the TradeStation
Scanner. We have also provided a companion strategy as well as a function to
allow you to easily use the volume-weighted moving average calculation in your
own code.
Indicator: Volume-Weighted Moving Average
// Volume Weighted Moving Average
// TASC APR 2017
// Author: Ken Calhoun

inputs:
	Price( Close ),
	MALength( 70 ),
	VWMALength( 50 ) ;

variables:
	MAValue( 0 ),
	VWMAValue( 0 ) ;


VWMAValue = _MovingAvgVolumeWeighted(
	Price, VWMALength ) ;
MAValue = Average( Price, MALength ) ;

Plot1( VWMAValue, "VWMA" ) ;
Plot2( MAValue, "MA" ) ;

if VWMAValue crosses over MAValue then
	Alert( "VWMA cross above MA" ) ;


Strategy: _Volume-Weighted Moving Average
// Volume Weighted Moving Average
// TASC APR 2017
// Author: Ken Calhoun

inputs:
	Price( Close ),
	MALength( 70 ),
	VWMALength( 50 ),
	StopDollarsPerShare( 2 ),
	TrailEnableProftPosition( 200 ),
	TrailAmountPerShare( 2 ) ;

variables:
	MAValue( 0 ),
	VWMAValue( 0 ) ;

VWMAValue = _MovingAvgVolumeWeighted( Price,
	VWMALength ) ;
MAValue = Average( Price, MALength ) ;

if VWMAValue crosses over MAValue then
	Buy next bar at Market
else if VWMAValue crosses under MAValue then
	Sell next bar at Market ;

SetStopShare ;
SetStopLoss( StopDollarsPerShare ) ;

if MaxPositionProfit >=
	TrailEnableProftPosition then
	SetDollarTrailing( TrailAmountPerShare ) ;


Function: _MovingAvgVolumeWeighted
// Vol Weighted Mov Avg Function
// TASC APR 2017
// Author: Ken Calhoun

inputs:
	Price( NumericSeries ),
	Length( NumericSimple ) ;

variables:
	VSum( 0 ),
	PVSum( 0 ),
	AnyVol( 0 ) ;

if BarType >= 2 and BarType < 5 then
	AnyVol = Volume
else
	AnyVol = Ticks ;

VSum = Summation( AnyVol, Length ) ;
PVSum = Summation( Price * AnyVol,
	Length ) ;

if VSum <> 0 then
	_MovingAvgVolumeWeighted =
	PVSum / VSum ;
To download this EasyLanguage code for the indicator and function, please
visit our TradeStation and EasyLanguage support forum. The code for this article
can be found here at https://community.tradestation.com/Discussions/Topic.aspx?Topic_ID=147651.
The ELD filename is “TASC_APR2017.ELD.”
For more information about EasyLanguage in general, please see https://www.tradestation.com/EL-FAQ.
A sample chart is shown in Figure 1.
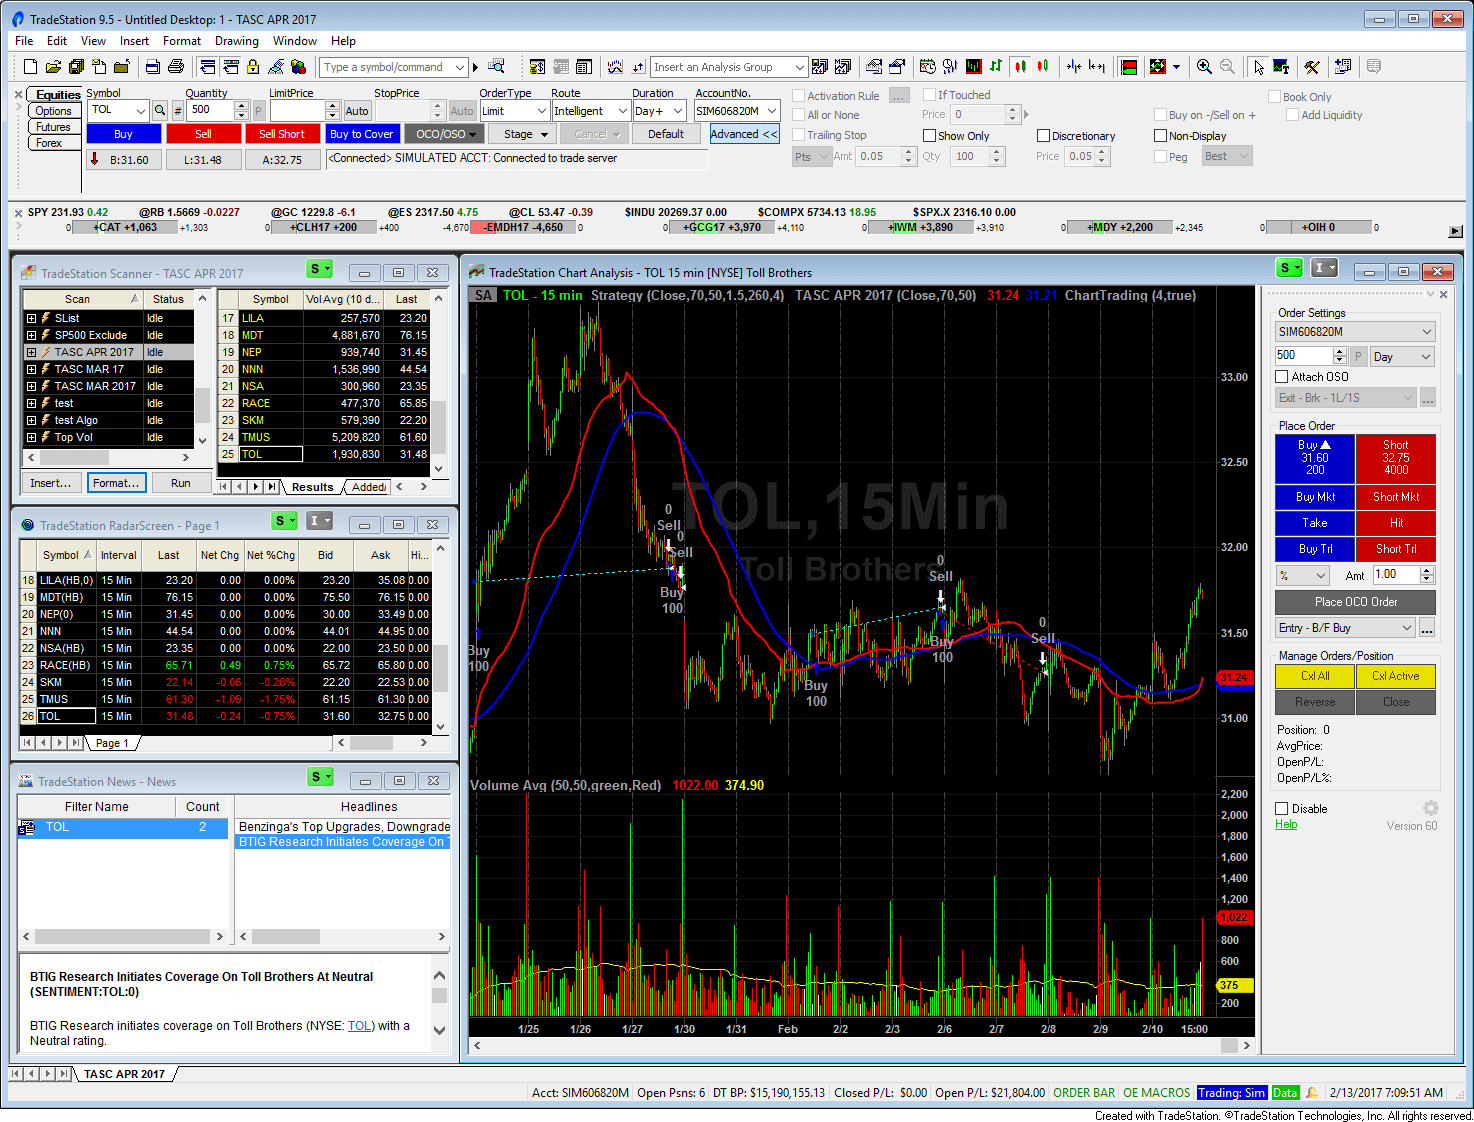
FIGURE 1: TRADESTATION. Here, the
volume-weighted moving average indicator and strategy are applied to a 15-minute
chart of Toll Brothers.
This article is for informational purposes. No type of trading or investment
recommendation, advice, or strategy is being made, given, or in any manner
provided by TradeStation Securities or its affiliates.
—Doug McCrary
TradeStation Securities, Inc.
www.TradeStation.com
BACK TO LIST

TC2000 Version 17: APRIL 2017
The VWMA strategy described by Ken Calhoun in his February 2017 S&C article
“Volume-Weighted Moving Average Breakouts” can be easily applied in TC2000
version 17 using the new EasyScan columns and enhanced custom formula language.
We used the new EasyScan features of version 17 to scan for stocks where the
50-bar VWMA has crossed up through the 70-bar simple moving average within
the last five bars on a 15-minute chart.
The chart in Figure 2 shows the VWMA crossover occurred within the last five
bars (circled in red).
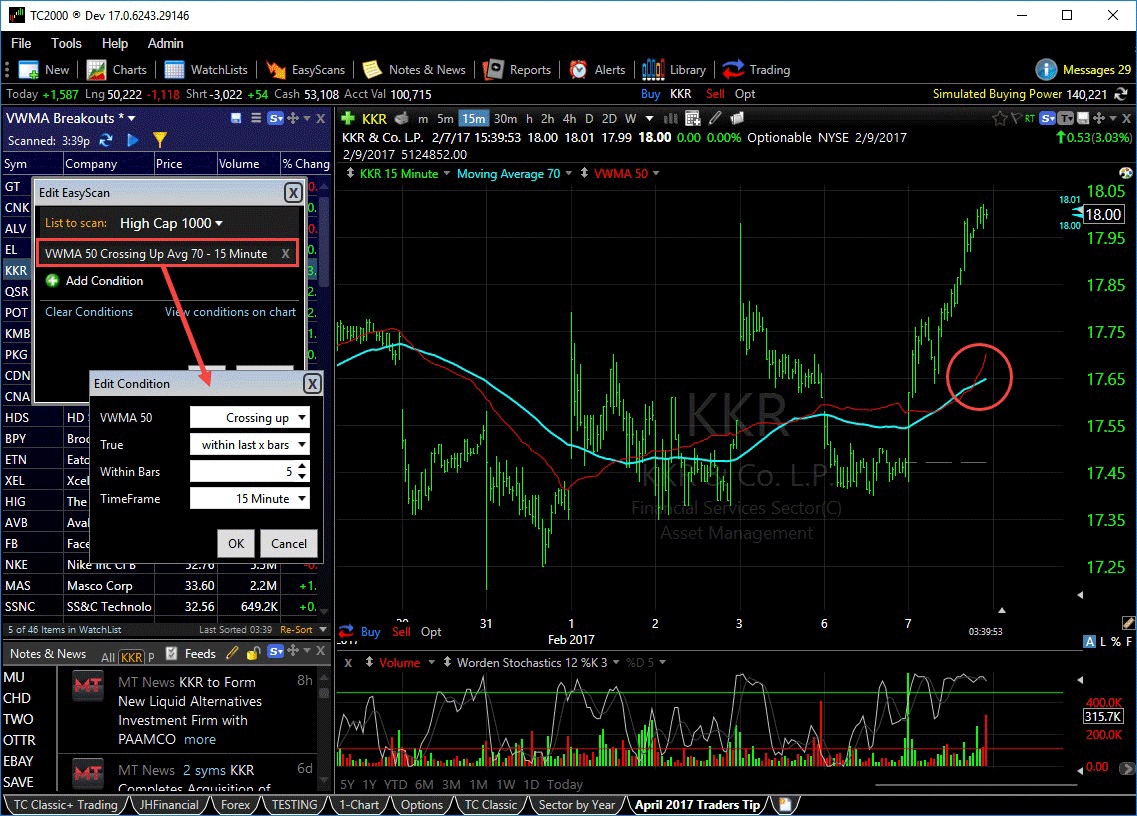
FIGURE 2: TC2000. This sample chart
of KKR shows a 15-minute timeframe. We scanned 1,000 high-cap stocks to find
where the crossover occurred within the last five bars. You can shorten or
lengthen the “within last x bars” setting to suit your needs.
If you would like a copy of this layout already set up with the scan and plots
in place, just send an email to support@tc2000.com and
we’ll be happy to send it to you.
—Patrick Argo
Worden Brothers, Inc.
www.TC2000.com
BACK TO LIST

METASTOCK: APRIL 2017
Ken Calhoun’s article in the February 2017 issue of Technical Analysis
of STOCKS & COMMODITIES, “Volume-Weighted Moving Average Breakouts,”
presented a trading system based on the volume-weighted moving average. The
MetaStock formulas for the buy and sell signals for this system are shown
here.
Buy Signal:
entry:= Cross( Mov(C, 50, VOL), Mov(C, 70, S) );
entry OR ( Mov(C, 50, VOL) > Mov(C, 70, S) AND
H > Ref(HighestSince(1, entry, H),-1))

Sell Signal:
Cross( Mov(C, 70, S), Mov(C, 50, VOL) )
—William Golson
MetaStock Technical Support
www.metastock.com
BACK TO LIST

eSIGNAL: APRIL 2017
For this month’s Traders’ Tip, we’re providing the study VWMA.efs based
on the formula described in Ken Calhoun’s article in the February 2017 issue,
“Volume-Weighted Moving Average Breakouts.”
In the article, the author presents a strategy of trading based on the crossover
of a 70-period and 50-period volume-weighted moving average on a 15-day 15-minute
chart.
The study contains formula parameters that may be configured through the edit
chart window (right-click on the chart and select “edit chart”). A sample
chart is shown in Figure 3.
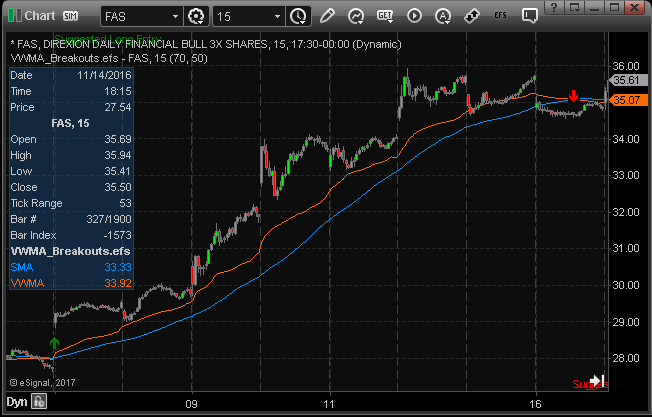
FIGURE 3: ESIGNAL. Here is an example
of the VWMA study plotted on a 15-minute chart of FAS.
To discuss this study or download a complete copy of the formula code, please
visit the EFS Library Discussion Board forum under the forums link
from the support menu at www.esignal.com or
visit our EFS KnowledgeBase at https://www.esignal.com/support/kb/efs/.
The eSignal formula script (EFS) is also available for copying & pasting
below.
/*********************************
Provided By:
eSignal (Copyright c eSignal), a division of Interactive Data
Corporation. 2016. All rights reserved. This sample eSignal
Formula Script (EFS) is for educational purposes only and may be
modified and saved under a new file name.  eSignal is not responsible
for the functionality once modified.  eSignal reserves the right
to modify and overwrite this EFS file with each new release.

Description:
    Volume-Weighted Moving Average by Ken Calhoun

Version:            1.00  02/10/2017

Formula Parameters:                     Default:
SMA Length                              70
WVMA Length                             50


Notes:
The related article is copyrighted material. If you are not a subscriber
of Stocks & Commodities, please visit www.traders.com.

**********************************/

var fpArray = new Array();

function preMain(){

    setPriceStudy(true);
    setDefaultBarFgColor(Color.RGB(255,106,0),1);
    setCursorLabelName("SMA", 0);
    setCursorLabelName("VWMA", 1);
    var x=0;
    fpArray[x] = new FunctionParameter("SMALength", FunctionParameter.NUMBER);
	with(fpArray[x++]){
        setLowerLimit(1);
        setUpperLimit(1000);
        setDefault(70);
        setName("SMA Length");
    }

    fpArray[x] = new FunctionParameter("VWMALength", FunctionParameter.NUMBER);
	with(fpArray[x++]){
        setLowerLimit(1);
        setUpperLimit(1000);
        setDefault(50);
        setName("VWMA Length");
    }
}

var bInit = false;
var bVersion = null;
var bIsLong = false;
var bWasLong = false;
var xSMA = null;
var xVWMA = null;

function main(SMALength, VWMALength){

    if (bVersion == null) bVersion = verify();
    if (bVersion == false) return;


    if (getBarState() == BARSTATE_ALLBARS){
        bInit = false;
    }

    if (!bInit){
        bIsLong = false;
        bWasLong = false;
        xSMA = sma(SMALength);
        xVWMA = vwma(VWMALength);
        bInit = true;
    }
    if (xSMA.getValue(-1) == null || xVWMA.getValue(-1) == null) return;

    var nSMA = xSMA.getValue(0);
    var nSMA_1 = xSMA.getValue(-1);
    var nVWMA = xVWMA.getValue(0);
    var nVWMA_1 = xVWMA.getValue(-1);


    if (nSMA > nVWMA && bIsLong){
        if (nSMA_1 <= nVWMA_1){
        drawTextRelative(0, AboveBar1, "\u00EA", Color.red, null, Text.PRESET|Text.CENTER, "Wingdings", 10, "Exit"+rawtime(0));
        drawText("Suggested Long Exit",BottomRow1,Color.red,Text.LEFT,"TextExit"+rawtime(0));
        bIsLong = false;
        }
        else {
            removeText("Long"+rawtime(0));
            removeText("Text"+rawtime(0));
        }
        bIsLong = false;
    }

    if (!bIsLong && nSMA < nVWMA){
        if (nSMA_1 > nVWMA_1){
            drawTextRelative(0,BelowBar1, "\u00E9", Color.green, null, Text.PRESET|Text.CENTER, "Wingdings", 10, "Long"+rawtime(0));
            drawText("Suggested Long Entry",TopRow1,Color.green,Text.LEFT,"Text"+rawtime(0));
            bIsLong = true;
            bWasLong = true;
        }
        else {
            removeText("Exit"+rawtime(0));
            removeText("TextExit"+rawtime(0));
            if (bWasLong)
                bIsLong = true;
        }

    }

    return [nSMA, nVWMA];
}


function verify(){
    var b = false;
    if (getBuildNumber() < 779){

        drawTextAbsolute(5, 35, "This study requires version 10.6 or later.",
            Color.white, Color.blue, Text.RELATIVETOBOTTOM|Text.RELATIVETOLEFT|Text.BOLD|Text.LEFT,
            null, 13, "error");
        drawTextAbsolute(5, 20, "Click HERE to upgrade.@URL=https://www.esignal.com/download/default.asp",
            Color.white, Color.blue, Text.RELATIVETOBOTTOM|Text.RELATIVETOLEFT|Text.BOLD|Text.LEFT,
            null, 13, "upgrade");
        return b;
    }
    else
        b = true;

    return b;
}
—Eric Lippert
eSignal, an Interactive Data company
800 779-6555, www.eSignal.com
BACK TO LIST

THINKORSWIM: APRIL 2017
In the article “Volume-Weighted Moving Average Breakouts” in the February
2017 issue of Technical Analysis of STOCKS & COMMODITIES, author
Ken Calhoun provides a concise, useful addition to the usual collection of
moving average studies. Not only does he add value to the concept of trading
off of averages, but he also lays out a trading strategy using his ideas.
We took this strategy and recreated it using our proprietary scripting language, thinkscript.
We have made the loading process extremely easy; simply click on the link https://tos.mx/ef1Xvj,
then choose to view thinkScript strategy.
In the image in Figure 4, you can see the VWMABreakouts strategy added to
a 10-day, 15-minute chart of FAS. Based on the article, when the VWMA 50-period
line (the blue line) crosses above the 50-period moving average (the pink line),
it is considered a buy signal.
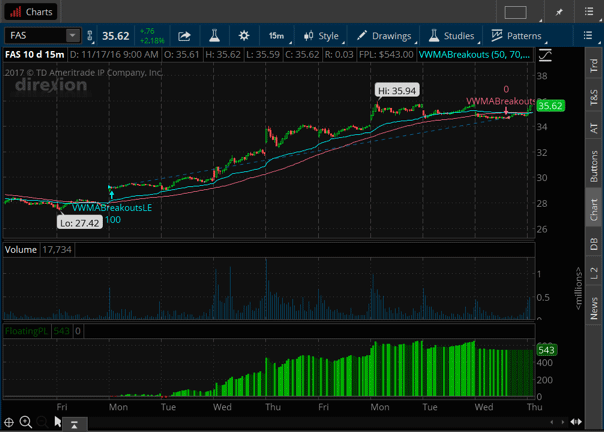
FIGURE 4: THINKORSWIM. Here, the
VWMABreakouts strategy is added to a 10-day, 15-minute chart of FAS. When
the 50-period VWMA (blue line) crosses above the 50-period moving average
(pink line), it is considered a buy signal.
This single strategy in thinkorswim contains the rules for entering the trade
as well as exiting. More detail about the volume-weighted moving average breakout
strategy can be found in the February 2017 issue of Technical Analysis
of STOCKS & COMMODITIES.
—thinkorswim
A division of TD Ameritrade, Inc.
www.thinkorswim.com
BACK TO LIST

WEALTH-LAB: APRIL 2017
The volume-weighted moving average (VWMA), which was discussed by Ken Calhoun
in his February 2017 article in S&C, “Volume-Weighted Moving Average Breakouts,”
offers an additional dimension to chart analysis by using volume in addition
to price. Typically, the VWMA is used in conjunction with a simple moving average
(SMA) of the same or different period.
Among the many cases where including the VWMA could be useful are:
- to help avoid false breakouts when there is no volume support
- confirmation of trend direction
- indication of a weakening trend when it moves below the SMA
- a profit-taking or exit signal when the distance between the VWMA and the
SMA tightens
- and more.
Another example of where including the VWMA could be useful is the swing-trading
setup that Calhoun outlines in his article, where the VWMA crossing above the
SMA may signal a potential bullish trend change, and the opposite crossunder
is used to close the position. We are providing some WealthScript code for
this strategy. A sample chart implementing the strategy is shown in Figure
5.
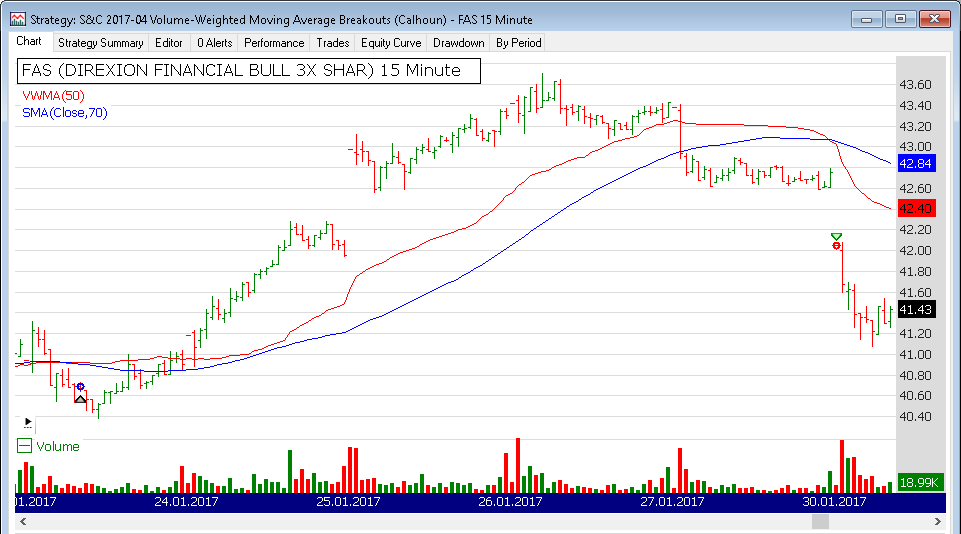
FIGURE 5: WEALTH-LAB. This sample
chart implementing the strategy highlights a successful trade in FAS.
In Wealth-Lab, you will find the VWMA indicator under the “TASC Magazine Indicators”
group after you update the Wealth-Lab TASCIndicators library to v2017.03 or
later. You can plot it on a chart or use it as an entry or exit condition in
a rule-based strategy without having to program any code yourself.
C# Code

using System;
using System.Collections.Generic;
using System.Text;
using System.Drawing;
using WealthLab;
using WealthLab.Indicators;
using TASCIndicators;

namespace WealthLab.Strategies
{
	public class MyStrategy : WealthScript
	{
		private StrategyParameter paramPeriodVWMA;
		private StrategyParameter paramPeriodSMA;

		public MyStrategy()
		{
			paramPeriodVWMA = CreateParameter("VWMA Period",50,2,300,1);
			paramPeriodSMA = CreateParameter("SMA Period",70,2,300,1);
		}

		protected override void Execute()
		{
			var sma = SMA.Series(Close,paramPeriodSMA.ValueInt);
			var vwma = VWMA.Series(Bars,paramPeriodVWMA.ValueInt);

			for(int bar = GetTradingLoopStartBar(1); bar < Bars.Count; bar++)
			{
				if (IsLastPositionActive)
				{
					if( CrossUnder(bar,vwma,sma))
						SellAtMarket(bar+1, LastPosition);
				}
				else
				{
					if( CrossOver(bar,vwma,sma))
						BuyAtMarket(bar+1);
				}
			}

			PlotSeries(PricePane,vwma,Color.Red,LineStyle.Solid,1);
			PlotSeries(PricePane,sma,Color.Blue,LineStyle.Solid,1);
		}
	}
}
—Eugene, Wealth-Lab team
MS123, LLC
www.wealth-lab.com
BACK TO LIST

NEUROSHELL TRADER: APRIL 2017
A volume-weighted moving average breakout trading system such as the one described
by Ken Calhoun in his February 2017 article in S&C, “Volume-Weighted Moving
Average Breakouts,” can be easily implemented in NeuroShell Trader. Simply
select new trading strategy from the insert menu and enter
the following in the appropriate locations of the trading strategy wizard:
BUY LONG CONDITIONS: [All of which must be true]

     CrossAbove(VolWgtAvg(Close,Volume,50),Avg(Close,70))

SELL LONG CONDITIONS: [All of which must be true]

     CrossBelow(VolWgtAvg(Close,Volume,50),Avg(Close,70))
If you have NeuroShell Trader Professional, you can also choose whether the
parameters should be optimized. After backtesting the trading strategy, use
the detailed analysis button to view the backtest and trade-by-trade
statistics for the strategy.
Users of NeuroShell Trader can go to the STOCKS & COMMODITIES section
of the NeuroShell Trader free technical support website to download a copy
of this or any previous Traders’ Tips.
A sample chart is shown in Figure 6.
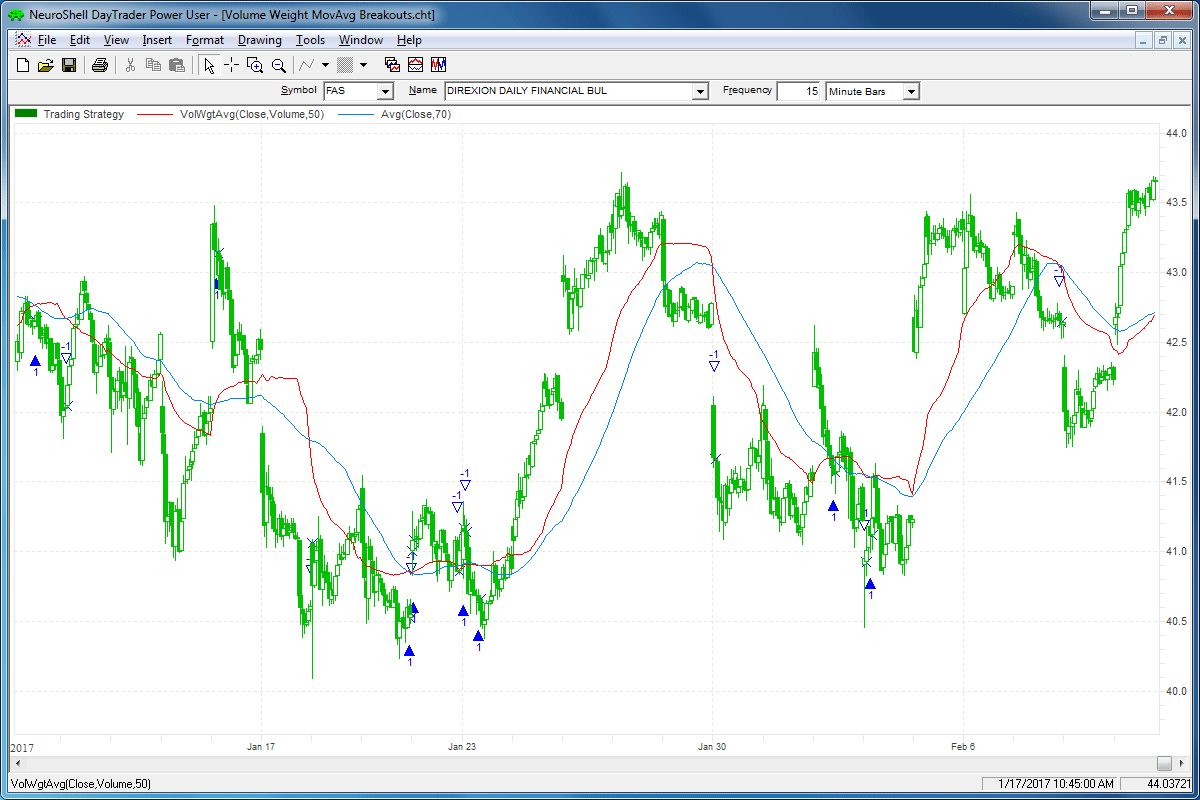
FIGURE 6: NEUROSHELL TRADER. This
NeuroShell Trader chart displays the volume-weighted moving average breakout
system for FAS.
—Marge Sherald, Ward Systems Group, Inc.
301 662-7950, sales@wardsystems.com
www.neuroshell.com
BACK TO LIST

AIQ: APRIL 2017
The AIQ code based on Ken Calhoun’s article in the February 2017 issue of Technical
Analysis of STOCKS & COMMODITIES, “Volume-Weighted Moving Average
Breakouts,” can be found at www.TradersEdgeSystems.com/traderstips.htm.
Please note that I tested the author’s system using the NASDAQ 100 list of
stocks on daily bars rather than intraday bars from 12/31/2008 thru 2/10/2017.
Figure 7 shows the resulting equity curve trading the author’s system with
the cross-down exit. Figure 8 shows the ASA report for this test. The annualized
return showed about a 17% return with a maximum drawdown of 19%.
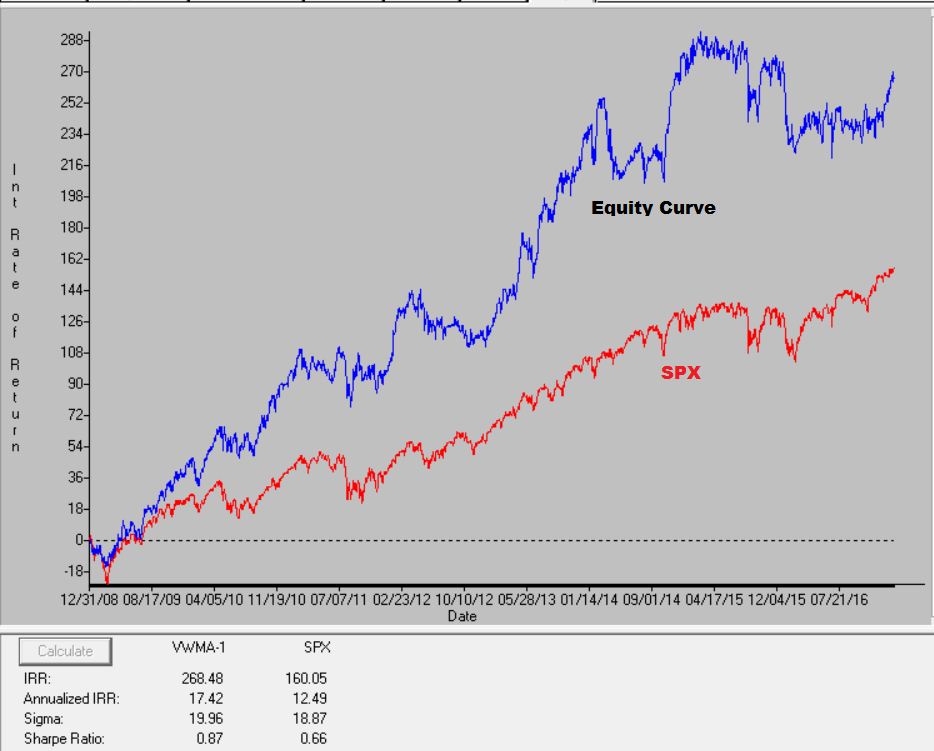
FIGURE 7: AIQ. Here are sample
test results from the AIQ Portfolio Manager taking three signals per day
and 10 concurrent positions maximum run on NASDAQ 100 stocks (daily bar data)
over the period 12/31/08 to 2/10/07.
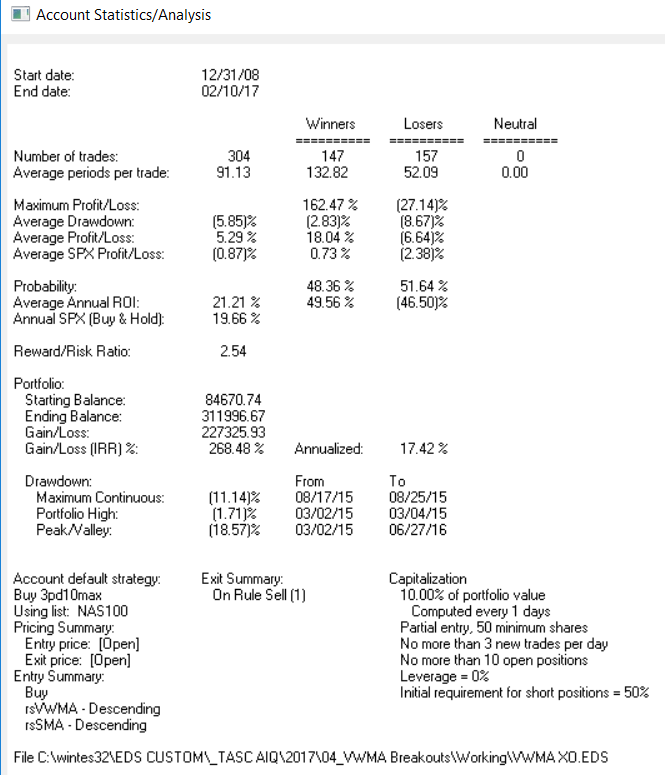
FIGURE 8: AIQ. This shows the ASA
report for the system, which shows the test metrics and settings.
Again, the code and EDS file can be downloaded from www.TradersEdgeSystems.com/traderstips.htm,
and is also shown below.
!Volume-Weighted Moving Average Breakouts
!Author: Ken Calhoun, TASC Apr 2017
!Coded by: Richard Denning 2/11/17
!www.TradersEdgeSystems.com

!INPUTS:
smaLen is 70.
vwmaLen is 50.

SMA is simpleavg([close],smaLen).
VWMA is sum([close]*[volume],vwmaLen)/sum([volume],vwmaLen).
HasData if hasdatafor(max(smaLen,vwmaLen)+10)>max(smaLen,vwmaLen).
Buy if SMA < VWMA and valrule(SMA > VWMA,1) and HasData.
Sell if SMA > VWMA.

rsVWMA is VWMA / valresult(VWMA,vwmaLen)-1.
rsSMA is SMA / valresult(SMA,smaLen)-1.
—Richard Denning
info@TradersEdgeSystems.com
for AIQ Systems
BACK TO LIST

TRADERSSTUDIO: APRIL 2017
The TradersStudio code based on Ken Calhoun’s February 2017 article, “Volume-Weighted
Moving Average Breakouts,” can be found at www.TradersEdgeSystems.com/traderstips.htm.
I tested the author’s system using the NASDAQ 100 list of stocks on daily
bars rather than intraday bars from year 2000 through 2014. Figure 9 shows
the equity curve trading the author’s system with the cross-down exit.
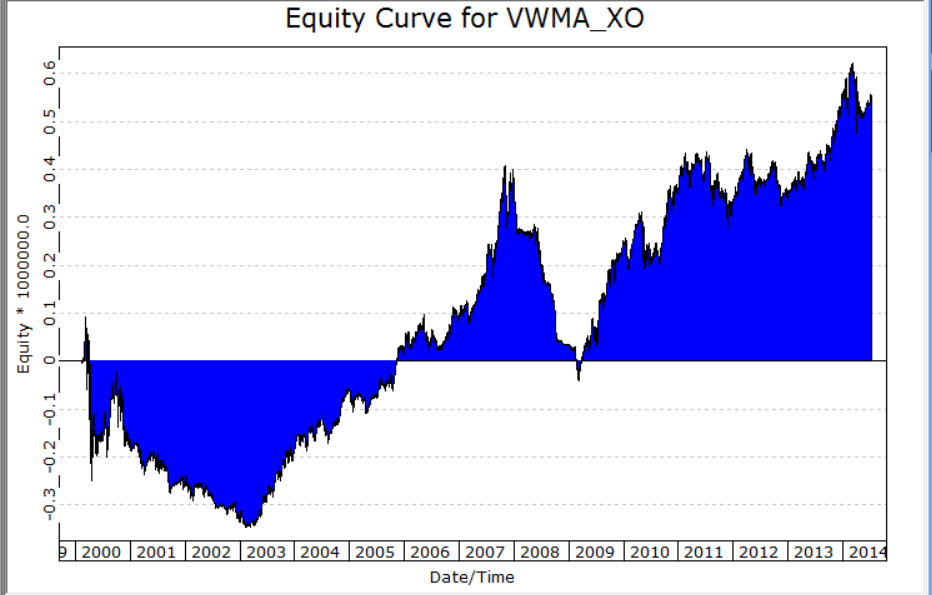
FIGURE 9: TRADERSSTUDIO. Here is
the equity curve trading 200 shares of each of the NASDAQ 100 list of stocks
from February 2000 through July 2014.
The following code files are provided in the download:
- Function: VWMA—A function that returns the value of the volume-weighted
moving average (VWMA)
- System: VWMA_SMA_XO—Code for the author’s system of going long when the
VWMA crosses up over the simple moving average.
Figure 9 shows the equity curve trading 200 shares of each of the NASDAQ 100
list of stocks from February 2000 through July 2014. The system does relatively
well during bull market periods but suffers during bear periods. Adding some
simple trend-following market timing to the system would probably significantly
reduce the drawdown during bear periods. I did not provide code to add the
market timing.
The code is shown here:
'Volume-Weighted Moving Average Breakouts
'Author: Ken Calhoun, TASC Apr 2017
'Coded by: Richard Denning 2/11/17
'www.TradersEdgeSystems.com

function VWMA(vwmaLen)
VWMA = summation(C*V,vwmaLen) / summation(V,vwmaLen)
End Function
'---------------------------------------------------
Sub VWMA_SMA_XO(vwmaLen,smaLen)
Dim myVWMA As BarArray
Dim mySMA As BarArray
myVWMA = VWMA(vwmaLen)
mySMA = Average(C,smaLen)

If mySMA < myVWMA And mySMA[1] > myVWMA[1] Then
    Buy("LE",1,0,Market,Day)
End If
If mySMA > myVWMA Then ExitLong("LX","",1,0,Market,Day)
End Sub
'-----------------------------------------------------
—Richard Denning
info@TradersEdgeSystems.com
for TradersStudio
BACK TO LIST

NINJATRADER: APRIL 2017
The VWMABreakout strategy, as discussed in the February 2017 S&C article
“Volume-Weighted Moving Average Breakouts” by Ken Calhoun, is available for
download at the following links for NinjaTrader 8 and NinjaTrader 7:
Once the file is downloaded, you can import the strategy in NinjaTader 8 from
within the control center by selecting Tools → Import → NinjaScript
Add-On and then selecting the downloaded file for NinjaTrader 8. To import
in NinjaTrader 7, from within the control center window, select the menu File → Utilities → Import
NinjaScript and select the downloaded file.
You can review the strategy’s source code in NinjaTrader 8 by selecting the
menu New → NinjaScript Editor → Strategies from within the control
center window and selecting the VWMABreakout file. You can review the strategy’s
source code in NinjaTrader 7 by selecting the menu Tools → Edit NinjaScript → Strategy
from within the control center window and selecting the VWMABreakout file.
NinjaScript uses compiled DLLs that run native, not interpreted, which provides
you with the highest performance possible.
A sample chart implementing the strategy is shown in Figure 10.
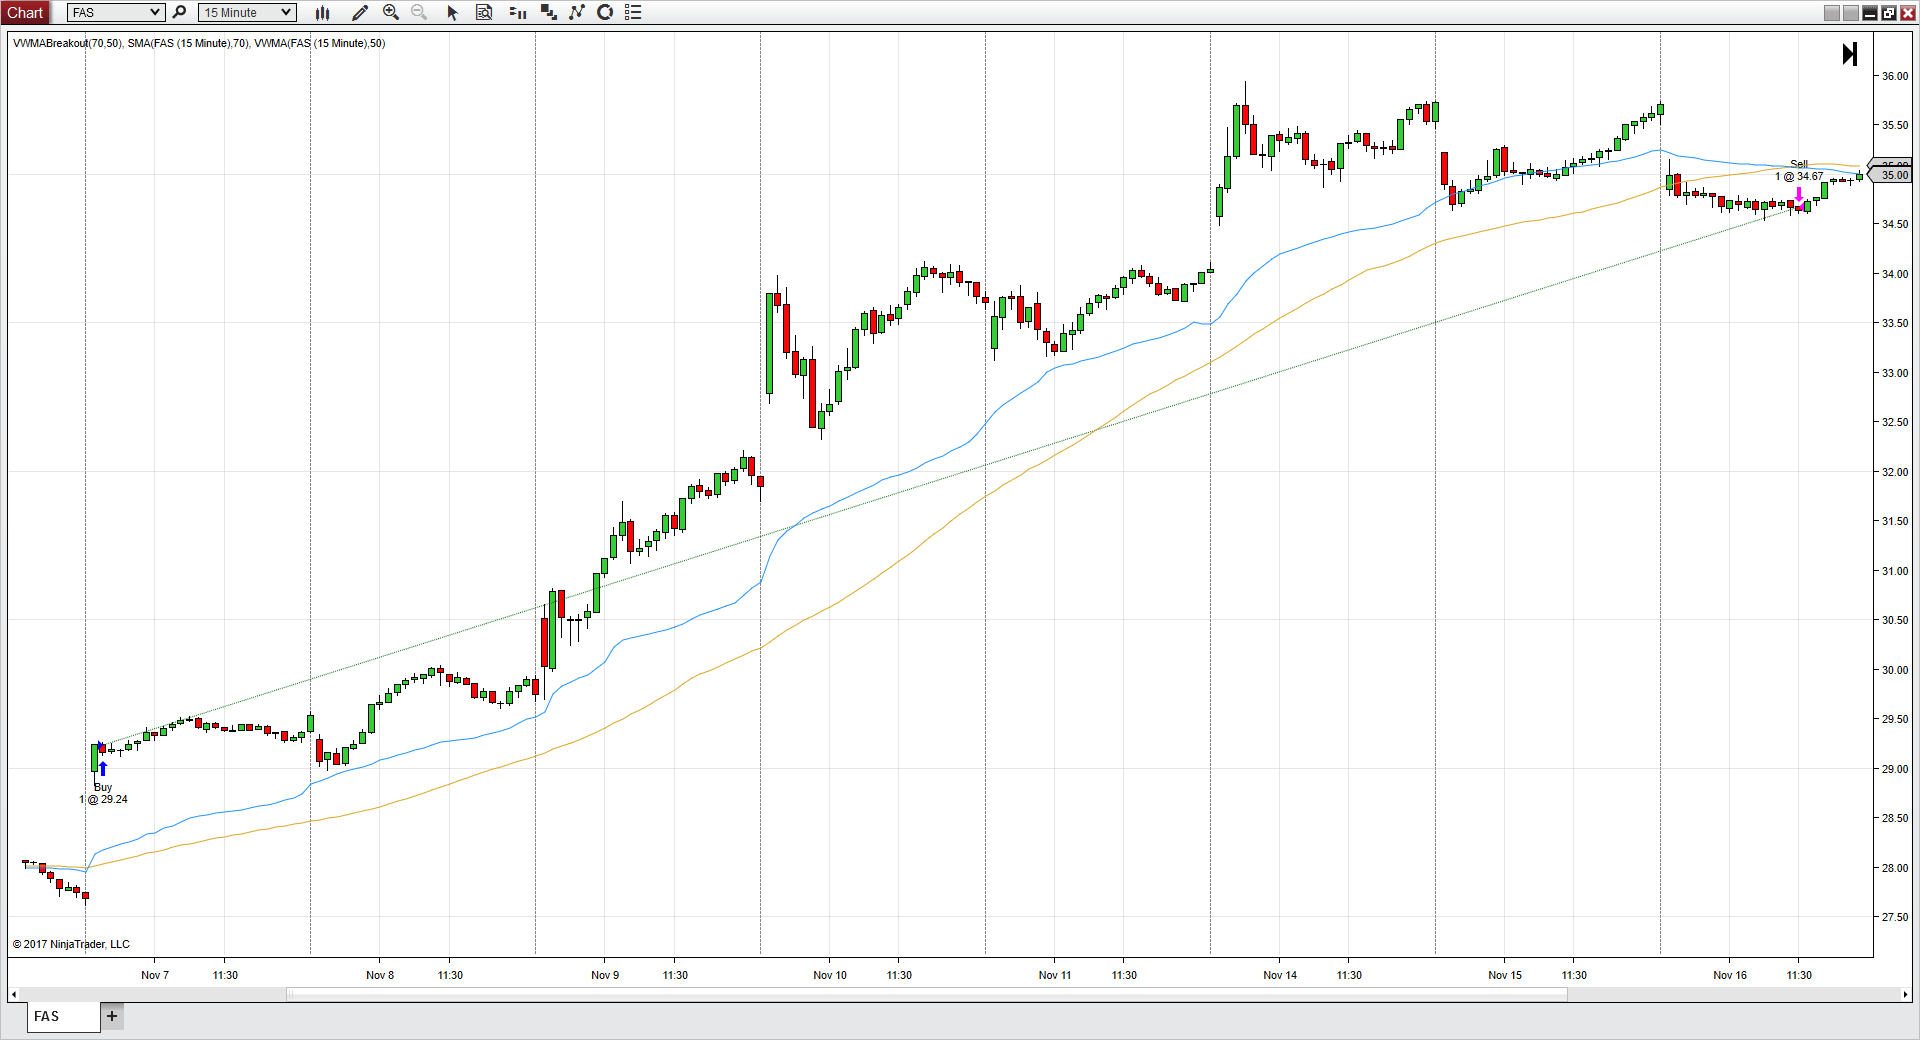
FIGURE 10: NINJATRADER. Here, the
VMABreakout is displayed on the FAS 15-minute chart in NinjaTrader 8.
—Raymond Deux & Jim Dooms
NinjaTrader, LLC
www.ninjatrader.com
BACK TO LIST

UPDATA: APRIL 2017
Our Traders’ Tip for this month is based on the article by Ken Calhoun in
the February 2017 issue of S&C, “Volume-Weighted Moving Average Breakouts.”
In the article, the author proposes a volume-weighted average method of signaling
when breakout patterns might have greater persistence. This system enters a
net long position when the short-term average crosses the long-term average
upwards, and enters a net short when the short-term average crosses the long-term
average downwards.
The Updata code for this article is in the Updata library and may be downloaded
by clicking the custom menu and indicator library. Those
who cannot access the library due to a firewall may paste the code shown here
into the Updata custom editor and save it.
'Volume Weighted MA Cross
PARAMETER "Period 1" #PERIOD=50
PARAMETER "Period 2" #PERIOD2=70
NAME VWMA
DISPLAYSTYLE 2LINES
INDICATORTYPE TOOL
COLOUR RGB(200,0,0)
COLOUR2 RGB(0,0,200)
@VP1=0
@VP2=0
FOR #CURDATE=#PERIOD+#PERIOD2 TO #LASTDATE
   'VOLUME WEIGHTED AVERAGES
   @VP1=SGNL(CLOSE*VOL,#PERIOD,M)/SGNL(VOL,#PERIOD,M)
   @VP2=SGNL(CLOSE*VOL,#PERIOD2,M)/SGNL(VOL,#PERIOD2,M)
   'ENTRY EXIT RULES
   IF HASX(@VP1,@VP2,DOWN)
      SELL CLOSE
      SHORT CLOSE
   ELSEIF HASX(@VP1,@VP2,UP)
      COVER CLOSE
      BUY CLOSE
   ENDIF
   @PLOT=@VP1
   @PLOT2=@VP2
NEXT
Figure 11 shows the 50/70-period VWMA cross system applied to the 3x leveraged
ETF FAS.
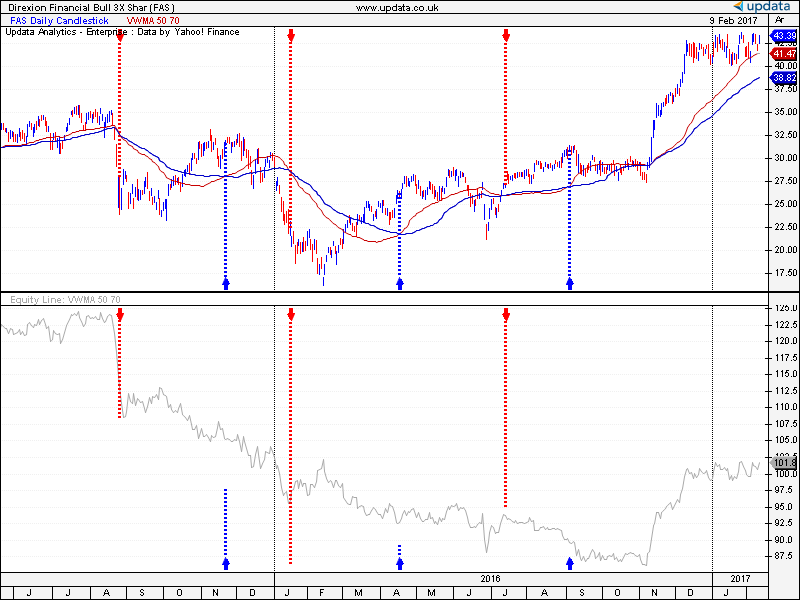
FIGURE 11: UPDATA. Here, the 50/70-period
VWMA cross system is applied to the 3x leveraged ETF FAS.
—Updata support team
support@updata.co.uk
www.updata.co.uk
BACK TO LIST

AMIBROKER: APRIL 2017
In “Volume-Weighted Moving Average Breakouts” in the February 2017 issue of Technical
Analysis of STOCKS & COMMODITIES, author Ken Calhoun shows a simple
swing trading strategy based on crossovers between the volume-weighted moving
average and a simple moving average.
A ready-to-use formula that implements a chart with the moving averages is
given here. A sample chart is shown in Figure 12.
vrange = Param("VWMA range", 50, 1, 200 );
mrange = Param("MA range", 70, 1, 200 );

vsum = Sum( Volume, vrange );
vpsum = Sum( Close * Volume, vrange );

vwma = vpsum / vsum;

Plot( C, Date() + " Close", colorDefault, styleCandle );

Plot( vwma, "VWMA" + vrange, colorRed );
Plot( MA( C, mrange ), "MA" + mrange, colorBlue );
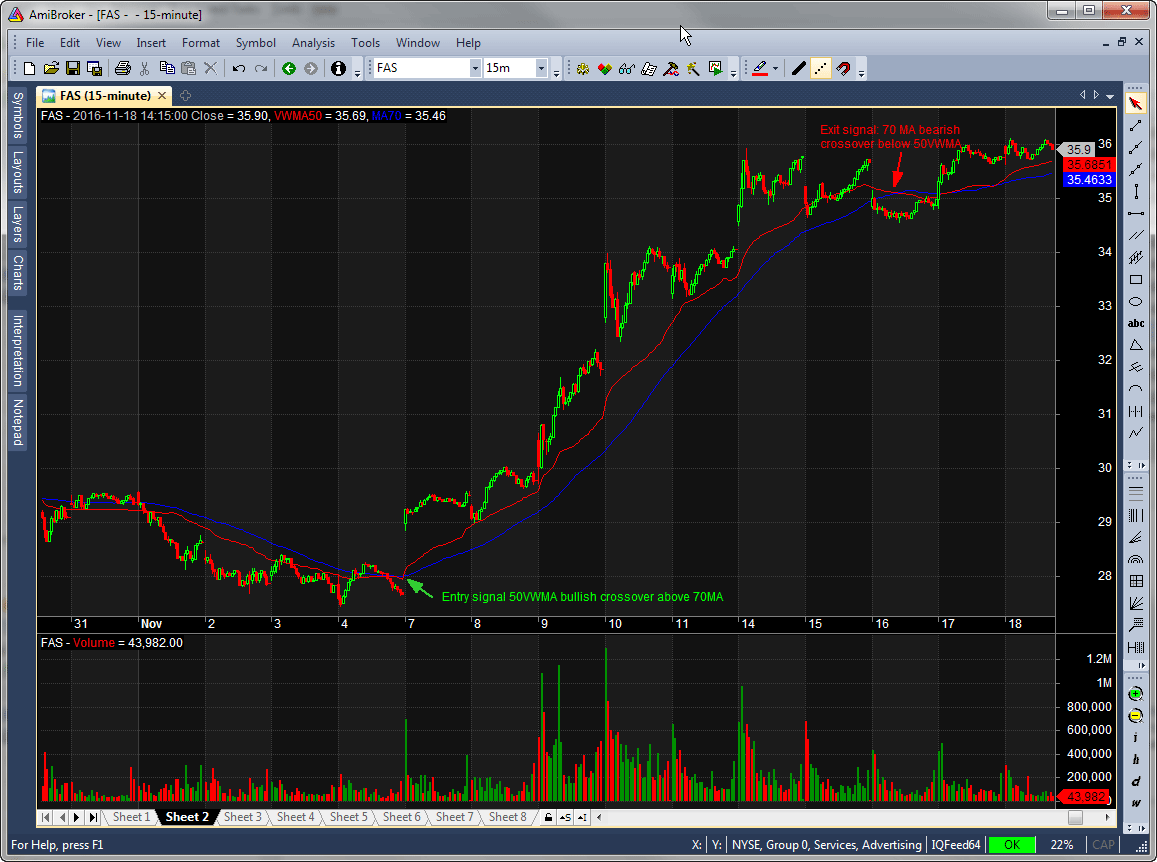
FIGURE 12: AMIBROKER. This 15-minute
chart of FAS shows crossover signals based on the 50-bar VWMA and 70 MA,
replicating the chart from Calhoun’s February 2017 article.
—Tomasz Janeczko, AmiBroker.com
www.amibroker.com
BACK TO LIST
MICROSOFT EXCEL: APRIL 2017
The approach discussed by Ken Calhoun in his article in the February 2017
issue, “Volume-Weighted Moving Average Breakouts,” is designed around 15-minute
interval bars with some reference to end-of-day levels as part of an exit strategy.
As there is not currently a free data source for historical intraday bars,
we must upscale to end-of-day bars.
There are 26 15-minute intervals in the standard US trading day of 9:30 am
to 4:00 pm. Using the 50-bar and 70-bar specifications for the averages, we
can derive three bits of useful information:
- 50 15-minute periods translates to (50/26 →) 1.923 trading days. Round
up to two days.
- 70 periods translates to (70/26 →) 2.692. Round up to three days.
- 50 vs. 70 suggests a scaling factor of 1.4 when estimating a starting value
of MA for any selected period of VWMA. No lockstep here. You are free to
mix and match to see what works best.
Let’s take a look at the daily version of the FAS ETF used in Calhoun’s article.
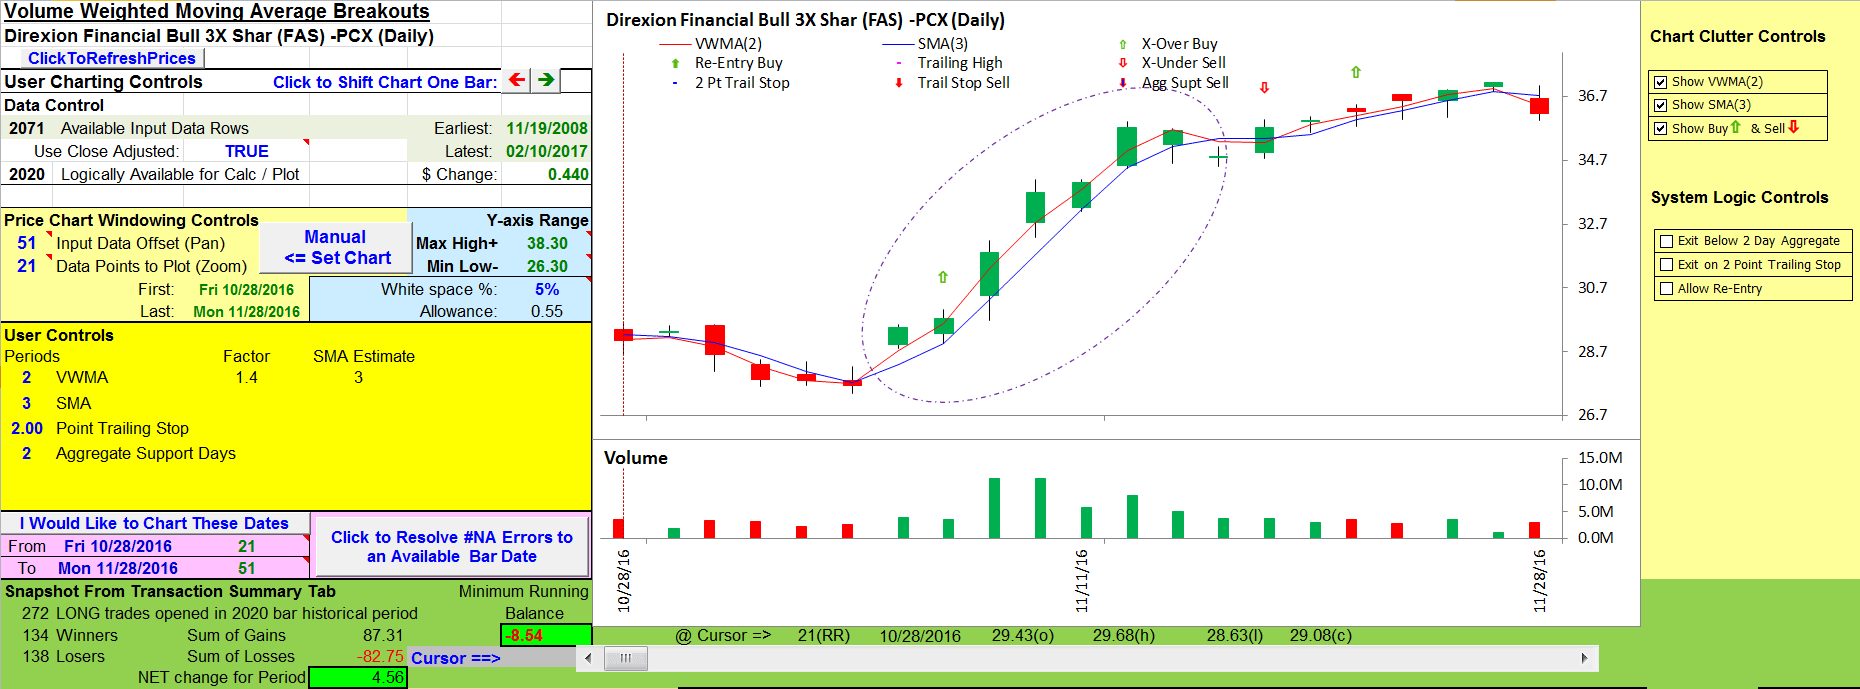
FIGURE 13: EXCEL. Using VWMA(2)
and MA(3) we find the up-cross on 11/7/2016 and the down-cross on 11/16/2016,
corresponding to Ken Calhoun’s article in the February 2017 S&C.
Our calculated upscale from 15-minute bars to days seems to hold for this
short uptrend. To see how it fares over a longer timeframe, let’s pull back
a little and see what 200 days at these settings looks like.
In Figure 14 things are a little messy with too many, sometimes daily, indicator
crossovers to be profitable, especially if you consider the impact of commissions
and slippage on such a frequency of trades.
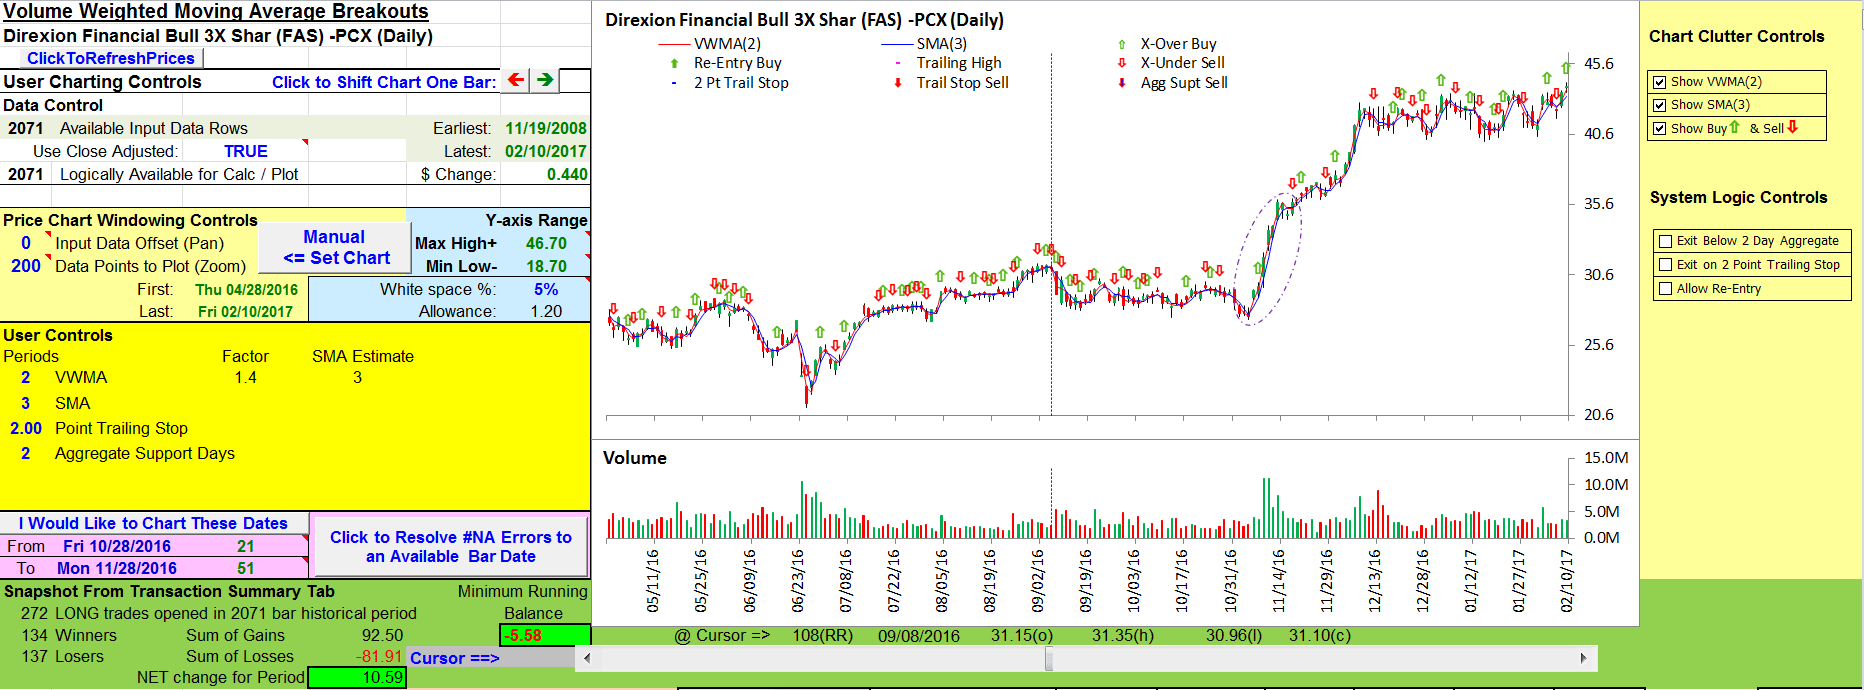
FIGURE 14: EXCEL, ANOTHER VIEW.
A wider view shows that settings of 2 and 3 make for lots of whipsaws.
Primary entry and exits for this system are determined by the up-cross and
down-cross of the moving averages. Figures 13 and 14 summarize the results
of that bare logic using 2 and 3 as the settings for the moving averages.
Checkboxes in system logic controls to the right of the chart allow
the user to activate the two stop-out ways of exiting a trade and the ability
to reenter on an upside breakout within a continuing trend.
Try them out. With moving average settings of 2 and 3, the chart only gets
more cluttered and appears to be a bit less profitable.
User controls allow for setting your choice of VWMA and MA periods as well
as adjusting the trailing stop dollar amount and the stop-out settings based
on aggregate support days.

FIGURE 15: EXCEL, MA SETTINGS.
Here, the moving average settings are less frenetic.
With the 70 and 50 settings as shown in Figure 15, the moving averages almost
kiss but do not cross at the 11/7/2016 beginning of the short, sharp uptrend
we have been watching. Instead, we see that our most recent upcross takes place
on 9/8/2016, and we are still in the trade as of 2/10/2017. The number of simulated
trades and our overall profitability are both down at these settings.
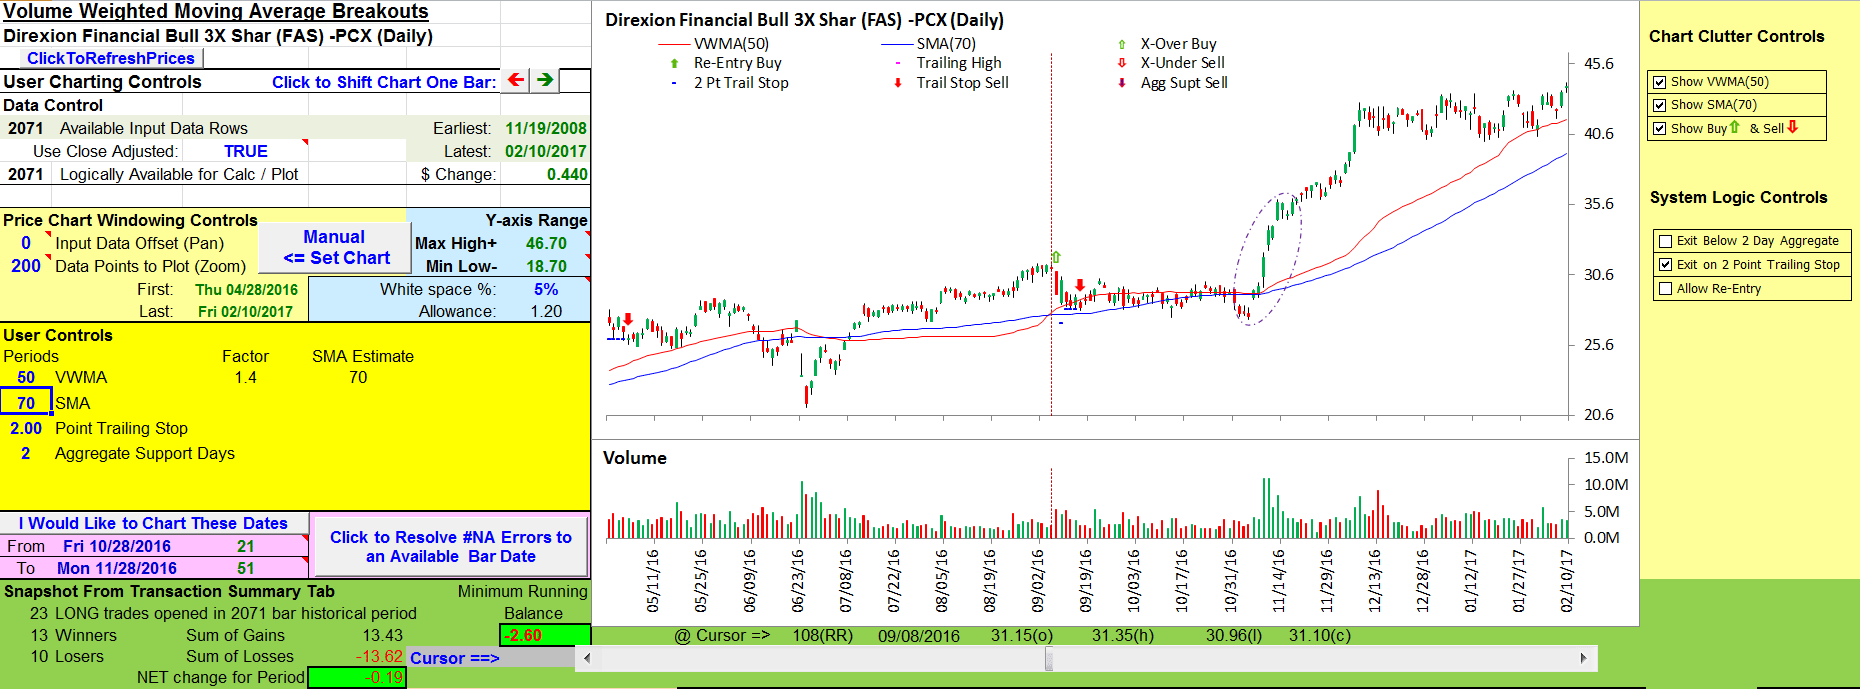
FIGURE 16: EXCEL, SELL STOP HIT.
The trailing stop values (blue horizontal bars) intercept the price on 9/15/2016.
A trailing stop sell occurs on the next bar.
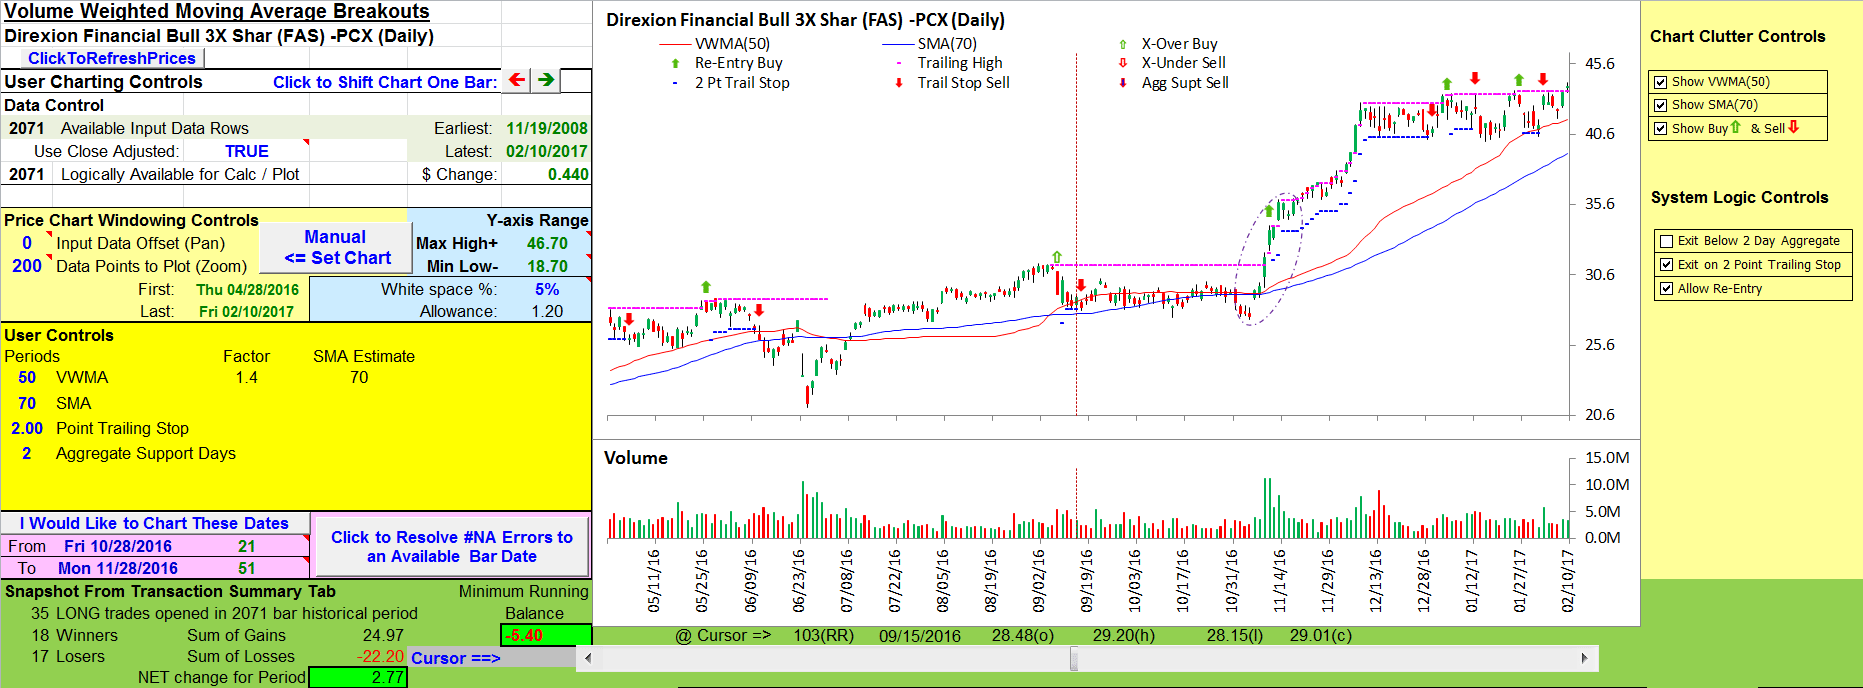
FIGURE 17: EXCEL, TRAILING HIGH.
Pink bars represent trailing highs and only appear with the reentry selection
while the VWMA is above the SMA. Reentry after a trailing or aggregate support
stop-out requires a break above the previous (trailing) high to confirm a
continuing uptrend. Using it here offers a slight improvement in profits
over using a trailing stop alone.
There are a lot of “what ifs” that can be explored within this model. Enjoy!
The spreadsheet file for this Traders’ Tip can be downloaded here.
To successfully download it, follow these steps:
- Right-click on the Excel
file link, then
- Select “save as” (or “save target as”) to place
a copy of the spreadsheet file on your hard drive.
—Ron McAllister
Excel and VBA programmer
rpmac_xltt@sprynet.com
BACK TO LIST
Originally published in the April 2017 issue of
Technical Analysis of STOCKS & COMMODITIES magazine.
All rights reserved. © Copyright 2017, Technical Analysis, Inc.