TRADERS’ TIPS
June 2017
For this month’s Traders’ Tips, the focus is Domenico D’Errico’s
article in this issue, “Daytrading With Night Volume.” Here,
we present the June 2017 Traders’ Tips code with possible implementations
in various software.
The Traders’ Tips section is provided to help the reader implement
a selected technique from an article in this issue or another recent issue.
The entries here are contributed by software developers or programmers for
software that is capable of customization.

TRADESTATION: JUNE 2017
In “Daytrading With Night Volume” in this issue, author Domenico D’Errico
presents a method for forecasting the volatility of an upcoming equity index
futures day session based on the trading volume of the previous overnight session.
He presents his statistical analysis showing that the day session volume is
correlated to the night session volume and that the day session range is correlated
to the day session volume.
D’Errico suggests that anticipating the daily range will be useful to the
daytrader. Here, we are providing the EasyLanguage code for an indicator to
show the overnight volume. We are also providing EasyLanguage code for a breakout
strategy that uses the volume information as a filtering mechanism.
Strategy: Overnight Volume Breakout
// Overnight Volume Strategy
// TASC JUN 2017
// Daytrading With Night Volume
// Domenico D'Errico

using elsystem ;
using elsystem.collections ;

inputs:
	OverNightStartTime( 0 ),
	OverNightEndTime( 830 ),
	BreakoutStartTime( 830 ),
	BreakoutEndTime( 930 ),
	NoEntriesAfterTime( 1400 ),
	VolumeAvgLength( 5 ),
	VolRatioUP( 1 ) ;

variables:
	double OverNightTotalVolume( 0 ),
	double OverNightVolumeAverage( 0 ),
	double FirstHourHigh( 0 ),
	double FirstHourLow( 0 ),
 	bool OverNightVolTime( false ),
	bool BreakoutRangeTime( false ),
	vector OverNightVolume( null ) ; ;

once
	begin
	OverNightVolume = new vector ;
	end ;

OverNightVolTime = ( OverNightStartTime
	< OverNightEndTime and
	Time >= OverNightStartTime and
	Time <= OverNightEndTime ) or
   	( OverNightStartTime >
   	OverNightEndTime and
   	( Time >= OverNightStartTime or
   	Time <= OverNightEndTime ) ) ;

if not OverNightVolTime[1]
	and OverNightVolTime then
	begin
	OverNightTotalVolume = ticks ;
	end
else if OverNightVolTime then
	begin
	OverNightTotalVolume += ticks ;
	end ;

if 	Time[1] < OverNightEndTime
	and Time >= OverNightEndTime
	and  BarStatus( DataNum + 1 ) = 2
	then
	begin
	if 	OverNightVolume.Count
		>= VolumeAvgLength then
		OverNightVolumeAverage =
		Average( OverNightVolume,
		VolumeAvgLength )
		* VolRatioUP ;
	OverNightVolume.insert( 0,
		OverNightTotalVolume astype double ) ;
	end ;

BreakoutRangeTime = Time
	>= BreakoutStartTime and
	Time <= BreakoutEndTime  ;
if not BreakoutRangeTime[1]
	and BreakoutRangeTime then
	begin
	FirstHourHigh = High ;
	FirstHourLow = Low ;
	end
else if BreakoutRangeTime then
	begin
	FirstHourHigh =
		MaxList( High, FirstHourHigh ) ;
	FirstHourLow =
		MinList( Low, FirstHourLow ) ;
	end ;

if OverNightTotalVolume >
	OverNightVolumeAverage and
	Time >= BreakOutEndTime and
	Time<= NoEntriesAfterTime and
	MarketPosition = 0 then
		begin
		Buy next bar at
			FirstHourHigh Stop ;
		SellShort next bar at
			FirstHourLow Stop ;
		end ;

SetExitOnClose ;

Indicator: Cumulative Overnight Volume
// Cumulative Volume Indicator
// TASC JUN 2017
// Daytrading With Night Volume
// Domenico D'Errico

using elsystem ;
using elsystem.collections ;

inputs:
	OverNightStartTime( 0 ),
	OverNightEndTime( 830 ),
	VolumeAvgLength( 5 ),
	VolRatioUP( 1 ) ;

variables:
	double OverNightTotalVolume( 0 ),
	double OverNightVolumeAverage( 0 ),
	double FirstHourHigh( 0 ),
	double FirstHourLow( 0 ),
 	bool OverNightVolTime( false ),
	bool BreakoutRangeTime( false ),
	vector OverNightVolume( null ) ; ;

once
	begin
	OverNightVolume = new vector ;
	end ;

OverNightVolTime = ( OverNightStartTime
	< OverNightEndTime and
	Time >= OverNightStartTime and
	Time <= OverNightEndTime ) or
   	( OverNightStartTime >
   	OverNightEndTime and
   	( Time >= OverNightStartTime or
   	Time <= OverNightEndTime ) ) ;

if not OverNightVolTime[1]
	and OverNightVolTime then
	begin
	OverNightTotalVolume = ticks ;
	end
else if OverNightVolTime then
	begin
	OverNightTotalVolume += ticks ;
	end ;

if 	Time[1] < OverNightEndTime
	and Time >= OverNightEndTime
	and  BarStatus( DataNum + 1 ) = 2
	then
	begin
	if 	OverNightVolume.Count
		>= VolumeAvgLength then
		OverNightVolumeAverage =
		Average( OverNightVolume,
		VolumeAvgLength )
		* VolRatioUP ;
	OverNightVolume.insert( 0,
		OverNightTotalVolume astype double ) ;
	end ;

if OverNightVolTime then
	Plot1( OverNightTotalVolume ) ;

if OverNightTotalVolume
	> OverNightVolumeAverage then
	SetPlotColor( 1 , Yellow ) ;

Plot2( OverNightVolumeAverage ) ;
To download the EasyLanguage code for the indicator and function in this article
please visit our TradeStation and EasyLanguage Support Forum. The code from
this article can be found here https://community.tradestation.com/Discussions/Topic.aspx?Topic_ID=147651.
The ELD filename is “TASC_JUN2017.ELD.”
For more information about EasyLanguage in general, please see https://www.tradestation.com/EL-FAQ.
A sample chart is shown in Figure 1.

FIGURE 1: TRADESTATION. The overnight
volume strategy and indicator are applied to a 15-minute chart of the S&P
500 emini futures.
This article is for informational purposes. No type of trading or investment
recommendation, advice, or strategy is being made, given, or in any manner
provided by TradeStation Securities or its affiliates.
—Doug McCrary
TradeStation Securities, Inc.
www.TradeStation.com
BACK TO LIST

METASTOCK: JUNE 2017
Domenico D’Errico’s article in this issue, “Daytrading With Night Volume,”
expands on the standard first-hour breakout system by adding a volume filter.
The article includes an example chart with time sessions colored differently,
a summation of the nighttime volume, and a five-day average of that volume.
Shown here are the formulas to create such a chart in MetaStock. These formulas
assume you are using a 15-minute chart.
Highlights:
Night Session (midnight to 8:30 AM)
Color: Black
Formula:
time:= (Hour()*100) + Minute();
time <= 830

First Hour (8:30 AM to 9:30 AM)
Color: Red
Formula:
time:= (Hour()*100) + Minute();
time <= 930 AND time > 830

Main Session (9:30 AM to 3:15 PM)
Color: Blue
Formula:
time:= (Hour()*100) + Minute();
time <= 1515 AND time > 930

Evening Session (3:15 PM to midnight)
Color: Grey
Formula:
time:= (Hour()*100) + Minute();
time > 315
Symbols:
Buy signal:
symbol: up arrow
formula:
time:= (Hour()*100) + Minute();
night:= time <= 830;
nightvol:= If(night, Sum( If(night, V, 0), 36), 0);
avgnightvol:=
(ValueWhen(1, time=830, nightvol)+
ValueWhen(2, time=830, nightvol)+
ValueWhen(3, time=830, nightvol)+
ValueWhen(4, time=830, nightvol)+
ValueWhen(5, time=830, nightvol))/5;
h1top:= ValueWhen(1, time=930, HHV(H,4));
ValueWhen(1, time=830, nightvol)>avgnightvol AND
time >930 AND time <=1445 AND H > h1top AND
Ref(HighestSince(1, time=930, H),-1) <=h1top

Sell Short signal:
symbol: down arrow
formula:
time:= (Hour()*100) + Minute();
night:= time <= 830;
nightvol:= If(night, Sum( If(night, V, 0), 36), 0);
avgnightvol:=
(ValueWhen(1, time=830, nightvol)+
ValueWhen(2, time=830, nightvol)+
ValueWhen(3, time=830, nightvol)+
ValueWhen(4, time=830, nightvol)+
ValueWhen(5, time=830, nightvol))/5;
h1bot:= ValueWhen(1, time=930, LLV(L,4));
ValueWhen(1, time=830, nightvol)>avgnightvol AND
time >930 AND time <=1445 AND L < h1bot AND
Ref(LowestSince(1, time=930, L),-1) <=h1bot

Close all open positions:
symbol:  Exit sign
formula:
time:= (Hour()*100) + Minute();
closeout:= time >= 1515;
closeout AND Ref(closeout=0, -1)
Indicator:
The formula below will create an indicator that plots two lines. After it
has been added to the chart, change the lower line to a Histogram line style.
Then change the upper line to a dotted line and set the color to Red.
Night Session Volume:
time:= (Hour()*100) + Minute();
night:= time <= 830;
nightvol:= If(night, Sum( If(night, V, 0), 36), 0);
avgnightvol:=
(ValueWhen(1, time=830, nightvol)+
ValueWhen(2, time=830, nightvol)+
ValueWhen(3, time=830, nightvol)+
ValueWhen(4, time=830, nightvol)+
ValueWhen(5, time=830, nightvol))/5;
nightvol;
avgnightvol
The chart in Figure 2 shows a 15-minute chart of ESc1 (emini S&P continuous
contract) with both the expert and indicator.
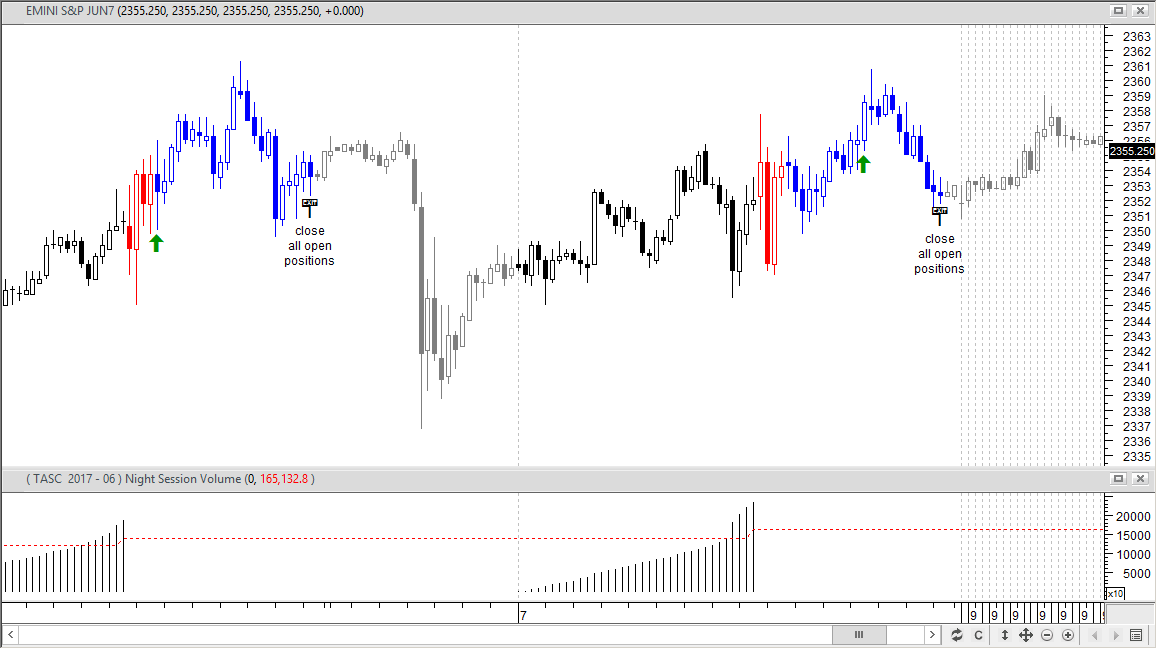
FIGURE 2: METASTOCK. This sample
chart shows the ESc1 with an expert and indicator.
—William Golson
MetaStock Technical Support
www.metastock.com
BACK TO LIST

eSIGNAL: JUNE 2017
For this month’s Traders’ Tip, we’ve provided a study based on the formula
described in Domenico D’Errico’s article in this issue, “Daytrading With Night
Volume.” The author presents a method of forecasting a day session’s volatility
based on the prior night session’s volume.
The study contains formula parameters that may be configured through the edit
chart window (right-click on the chart and select “edit chart”). A sample
chart is shown in Figure 3.

FIGURE 3: eSIGNAL. Here is an example
of the study plotted on an intraday chart of ES.
To discuss this study or download a complete copy of the formula code, please
visit the EFS Library Discussion Board forum under the forums link
from the support menu at www.esignal.com or visit our EFS KnowledgeBase at https://www.esignal.com/support/kb/efs/.
The eSignal
formula script (EFS) is also available for copying & pasting below.
/*********************************
Provided By:
eSignal (Copyright c eSignal), a division of Interactive Data
Corporation. 2016. All rights reserved. This sample eSignal
Formula Script (EFS) is for educational purposes only and may be
modified and saved under a new file name.  eSignal is not responsible
for the functionality once modified.  eSignal reserves the right
to modify and overwrite this EFS file with each new release.

Description:
    Daytrading With Night Volume by Domenico D'Errico

Version:            1.00  04/12/2017

Formula Parameters:                     Default:
Length                                  5
Night Session Open                      23:00
Day Session Open                        08:30
Day Session Close                       15:00
Volume Ratio                            1
Strategy Type                           First Hour BreakOut


Notes:
The related article is copyrighted material. If you are not a subscriber
of Stocks & Commodities, please visit www.traders.com.

**********************************/

var fpArray = new Array();

function preMain(){
    setPriceStudy(false);
    setColorPriceBars(true);
    setDefaultPrecision(0,0);
    setDefaultPriceBarColor(Color.RGB(0,148,255));
    setStudyTitle("Night&Day");

    setPlotType(PLOTTYPE_HISTOGRAM);
    setCursorLabelName("CumVol");

    var x=0;
    fpArray[x] = new FunctionParameter("Length", FunctionParameter.NUMBER);
	with(fpArray[x++]){
        setName("Length");
        setDefault(5);
        setLowerLimit(1);
    }
    fpArray[x] = new FunctionParameter("NightO", FunctionParameter.STRING);
	with(fpArray[x++]){
        setName("Night Session Open");
        setDefault("23:00");
    }
    fpArray[x] = new FunctionParameter("DayO", FunctionParameter.STRING);
	with(fpArray[x++]){
        setName("Day Session Open");
        setDefault("08:30");
    }
    fpArray[x] = new FunctionParameter("DayC", FunctionParameter.STRING);
	with(fpArray[x++]){
        setName("Day Session Close");
        setDefault("15:00");
    }
    fpArray[x] = new FunctionParameter("VolRatio", FunctionParameter.NUMBER);
	with(fpArray[x++]){
        setName("Volume Ratio");
        setDefault(1);
        setLowerLimit(1);
    }
    fpArray[x] = new FunctionParameter("StrategyType", FunctionParameter.STRING);
	with(fpArray[x++]){
        setName("Strategy Type");
        setDefault("First Hour BreakOut");
        addOption("First Hour BreakOut");
        addOption("Night & Day");
    }
}

var bInit = false;
var bVersion = null;
var xHigh = null;
var xLow = null;
var xClose = null;
var xVol = null;
var aNightVol = null;
var nCurrNightVol = 0;
var nLastVol = 0;

var nNightSessionOpen = null;
var nDaySessionOpen = null;
var nDaySessionClose = null;

var nFirstHourHighest = null;
var nFirstHourLowest = null;

function main(Length, NightO, DayO, DayC, StrategyType){
    if (bVersion == null) bVersion = verify();
    if (bVersion == false) return;

    if (getBarState() == BARSTATE_ALLBARS){
        bInit = false;
    }

    if (!bInit){
        xHigh = high();
        xLow = low();
        xClose = close();
        xVol = volume();
        aNightVol = new Array(Length, 0);
        nFirstHourHighest = null;
        nFirstHourLowest = null;
        nCurrNightVol = 0;
        nLastVol = 0;
        nNightSessionOpen = TimeStringToNumber(NightO);
        nDaySessionOpen = TimeStringToNumber(DayO);
        nDaySessionClose = TimeStringToNumber(DayC);
        bInit = true;
    }


    var nHigh = xHigh.getValue(0);
    var nLow = xLow.getValue(0);
    var nClose = xClose.getValue(0);

    var barTime = hour(0) * 100 + minute(0);


    if (getBarState() == BARSTATE_NEWBAR){
        if (barTime == nNightSessionOpen) nCurrNightVol = 0;
        nLastVol = nCurrNightVol;
    }

    nCurrNightVol = nLastVol + xVol.getValue(0);

    if (barTime == nDaySessionOpen){
        for (var i = Length - 1; i > 0; i--){
            aNightVol[i] = aNightVol[i - 1];
        }
        aNightVol[0] = nCurrNightVol;
        nFirstHourLowest = nLow;
    }

    if (barTime >= nDaySessionOpen && barTime <= TimeMath(nDaySessionOpen, "add", 60)){
        if (nHigh > nFirstHourHighest) nFirstHourHighest = nHigh;
        if (nLow < nFirstHourLowest) nFirstHourLowest = nLow;
        setPriceBarColor(Color.red);
    }


    if (getCurrentBarIndex() != 0){
        if(barTime >= TimeMath(nDaySessionOpen, "add", 60 + parseInt(getInterval())) &&
            barTime < TimeMath(nDaySessionClose, "sub", parseInt(getInterval()))){
                if (!Strategy.isInTrade()){
                    if (StrategyType == "First Hour BreakOut"){
                        if (nHigh > nFirstHourHighest){
                            Strategy.doLong("First Hour BreakUP", Strategy.CLOSE, Strategy.THISBAR, Strategy.DEFAULT);
                            nFirstHourHighest = 0;
                        }
                        else if (nLow < nFirstHourLowest){
                            Strategy.doShort("First Hour BreakDN", Strategy.CLOSE, Strategy.THISBAR, Strategy.DEFAULT);
                            nFirstHourLowest = 0;
                        }
                    }

                    else if (StrategyType == "Night & Day" && aNightVol[0] > AvgVolume(aNightVol, Length)){
                        if (nHigh > nFirstHourHighest){
                            Strategy.doLong("N & D BreakUP", Strategy.CLOSE, Strategy.THISBAR, Strategy.DEFAULT);
                            nFirstHourHighest = 0;
                        }
                        else if (nLow < nFirstHourLowest){
                            Strategy.doShort("N & D BreakDN", Strategy.CLOSE, Strategy.THISBAR, Strategy.DEFAULT);
                            nFirstHourLowest = 0;
                        }
                    }
                }

        }

        if (barTime >= TimeMath(nDaySessionClose, "add", parseInt(getInterval()))){
            if (Strategy.isLong())
                Strategy.doSell("Exit BreakUP", Strategy.CLOSE, Strategy.THISBAR, Strategy.DEFAULT);
            else if (Strategy.isShort())
                Strategy.doCover("Exit BreakDN", Strategy.CLOSE, Strategy.THISBAR, Strategy.DEFAULT);
        }
    }

    if (barTime < nDaySessionOpen) setPriceBarColor(Color.black);
    else if (barTime > nDaySessionClose) setPriceBarColor(Color.grey);

    return nCurrNightVol;
}


function TimeStringToNumber(timeStr){
    var tempTime = new Array();
    tempTime = timeStr.split(':',2);
    if (tempTime[0][0] == '0')
        tempTime[0] = tempTime[0].substr(1);
    if (tempTime[1][0] == '0')
        tempTime[1] = tempTime[1].substr(1);
    tempTime = (parseInt(tempTime[0]) * 100) + parseInt(tempTime[1]);

    return tempTime;
}

function AvgVolume(aVolume, Length){
    var sumVol = 0;
    for (var i = 0; i < Length; i++){
        sumVol += aVolume[i];
    }
    return (sumVol / Length);
}

function TimeMath(timeVal, type, value){
    if (type == "add"){
        timeVal += (value % 60 + Math.floor(value / 60) * 100);
    }
    else if (type == "sub"){
        timeVal -= Math.floor(value / 60) * 100;
        if (value % 60 > timeVal % 100) timeVal -= (100 - (60 - value % 60));
    }
    return timeVal;
}

function verify(){
    var b = false;
    if (getBuildNumber() < 3742){
        drawTextAbsolute(5, 35, "This study requires version 12.1 or later.",
            Color.white, Color.blue, Text.RELATIVETOBOTTOM|Text.RELATIVETOLEFT|Text.BOLD|Text.LEFT,
            null, 13, "error");
        drawTextAbsolute(5, 20, "Click HERE to upgrade.@URL=https://www.esignal.com/download/default.asp",
            Color.white, Color.blue, Text.RELATIVETOBOTTOM|Text.RELATIVETOLEFT|Text.BOLD|Text.LEFT,
            null, 13, "upgrade");
        return b;
    }
    else
        b = true;

    return b;
}
—Eric Lippert
eSignal, an Interactive Data company
800 779-6555, www.eSignal.com
BACK TO LIST

WEALTH-LAB: JUNE 2017
In “Daytrading With Night Volume” in this issue, author Domenico D’Errico
shares a method that can provide insight about the possible dynamics of a futures
trading session—ahead of it.
Use the parameter slider in Wealth-Lab at the bottom to adjust the number
of sessions to average the nightly volume.
Although the C# code that implements the night & day breakout strategy
can be copied into Wealth-Lab 6, for your simplicity, we recommend downloading
it straight from the application’s open strategy dialog. We hope that
this strategy becomes a good addition to the trader’s arsenal.
A sample chart is in Figure 4.

FIGURE 4: WEALTH-LAB. On this sample
chart of ES, the night session is colored in black, the first hour of trading
is in red, the remaining main trading session is in blue, and the session
from 15:15 pm to midnight is in gray. The subchart plots the cumulative night
volume as a histogram and its five-day moving average (red line).
using System;
using System.Collections.Generic;
using System.Text;
using System.Drawing;
using WealthLab;
using WealthLab.Indicators;
using System.Linq;
using System.Globalization;

namespace WealthLab.Strategies
{
	public class NightAndDayStrategy : WealthScript
	{
		private int GetTime(int bar)
		{
			return Date[bar].Hour * 100 + Date[bar].Minute;
		}

		private string NumberAsK(double volume)
		{
			return volume.ToString("#,##0,K", CultureInfo.InvariantCulture);
		}

		private StrategyParameter paramAverageNights;

		public NightAndDayStrategy()
		{
			paramAverageNights = CreateParameter("Avg. Nights", 5, 1, 20, 1);
		}

		protected override void Execute()
		{
			if ( Bars.IsIntraday )
			{
				// Variables
				int firstHourStart = -1, firstHourEnd = -1, average = paramAverageNights.ValueInt ;
				double firstHourRangeHigh = 0, firstHourRangeLow = 0;
				var aNightVolume = new DataSeries(Bars,"Average Night Volume");
				var cNightVolume = new DataSeries(Bars,"Cumulative Night Volume");
				var ls = LineStyle.Solid;
				var lstVolumes = new List<double>();	// holds cumulative volume for each session
				bool canTrade = false;
				Font font = new Font("Verdana",10,FontStyle.Bold);

				// Plotting
				HideVolume();
				ChartPane cvPane = CreatePane(20,false,false);
				PlotSeries(cvPane,cNightVolume,Color.Brown,LineStyle.Histogram,2);
				PlotSeries(cvPane,aNightVolume,Color.Red,ls,2);

				for(int bar = GetTradingLoopStartBar(1); bar < Bars.Count; bar++)
				{
					// Volatility bias is night volume is not lower than the night volume average of the last N days
					bool volatilityBias = false;

					// Propagate average night volume
					if( aNightVolume[bar] == 0 )
						aNightVolume[bar] = aNightVolume[bar - 1];

					// Aftermarket
					if( (GetTime(bar) > 1515) && (GetTime(bar) <= 2359) )
						SetBarColor( bar, Color.Silver );

					// Night session
					if( (GetTime(bar) >= 0000) && (GetTime(bar) <= 0830) )
					{
						SetBarColor( bar, Color.Black );

						// Reset night volume
						if(GetTime(bar) == 0000)
							cNightVolume[bar] = 0;
						else
							cNightVolume[bar] = cNightVolume[bar-1];

						// Cumulate night volume series
						cNightVolume[bar] += Volume[bar];

						if(GetTime(bar) == 0830)
						{
							firstHourStart = bar;
							lstVolumes.Add(cNightVolume[bar]);
						}
					}

					// First hour
					if( (GetTime(bar) > 0830) && (GetTime(bar) <= 0930) )
					{
						// Average nightly volume for last N sessions
						var avgNightlyVolume = lstVolumes.Skip(Math.Max(0, lstVolumes.Count() - average)).Sum() / (double)average;
						aNightVolume[bar] = avgNightlyVolume;

						// Volatility filter
						volatilityBias = avgNightlyVolume > cNightVolume[firstHourStart] ? false : true;

						SetBarColor( bar, Color.Red );
						if(GetTime(bar) == 0930)
							firstHourEnd = bar;

						if( (firstHourStart > -1) && (firstHourEnd > -1) )
						{
							if( bar == firstHourEnd ) // get the highest high and the lowest low after first 30-min
							{
								// First hour range
								firstHourRangeHigh = Highest.Value(bar, High, firstHourEnd-firstHourStart );
								firstHourRangeLow = Lowest.Value(bar, Low, firstHourEnd-firstHourStart );
								DrawLine( PricePane, firstHourStart, firstHourRangeHigh,
									firstHourEnd, firstHourRangeHigh, Color.Blue, ls, 2 );
								DrawLine( PricePane, firstHourStart,
									firstHourRangeLow, firstHourEnd, firstHourRangeLow, Color.Red, ls, 2 );

								AnnotateBar("Volatility bias: " + volatilityBias.ToString(),bar,true,
									Color.Blue,Color.Transparent,font);
								AnnotateBar("Avg.Vol: " + NumberAsK(avgNightlyVolume) +
									", Cum.Vol: " + NumberAsK(cNightVolume[firstHourStart]),
									bar,true, Color.Blue,Color.Transparent,font);

								// Minimum required trading sessions
								bool calculationIsValid = lstVolumes.Count >= average;

								// Can only trade between 9:30 and 15:15 if volatility bias is high
								if( volatilityBias && calculationIsValid )
									canTrade = true;
							}
						}
					}

					// Main session
					if( (GetTime(bar) > 0930) && (GetTime(bar) <= 1515) )
						SetBarColor( bar, Color.Blue );

					// Reset trading condition until new session
					if( GetTime(bar) > 1515 )
						canTrade = false;

					// Trading
					if( IsLastPositionActive )
					{
						Position p = LastPosition;

						// Exit at 15:15
						if( ( GetTime(bar) >= 1515) )
							ExitAtMarket( bar+1, p, "15:15" );
					}
					else
					{
						// Take trades if volatility bias is positive and time is OK
						if( canTrade )
						{
							if( BuyAtStop(bar+1, firstHourRangeHigh + 0.01, volatilityBias.ToString() ) == null )
								ShortAtStop(bar+1, firstHourRangeLow - 0.01, volatilityBias.ToString() );
						}
					}
				}
			}
			else
			{
				DrawLabel( PricePane, "Works on intraday data only!", Color.Red );
			}
		}
	}
}
—Eugene (Gene Geren)
Wealth-Lab team
MS123, LLC
www.wealth-lab.com
BACK TO LIST

AMIBROKER: JUNE 2017
In “Daytrading With Night Volume” in this issue, author Domenico D’Errico
shows a trading technique based on volume breakouts. A ready-to-use AmiBroker
formula that implements a simple trading system and chart based on the method
described is presented here.
// times adjusted for IQFeed timestamps
SetBarsRequired( sbrAll );
Strategy = 1; // select strategy you wish

tn = TimeNum();

CumulativeVolume = SumSince( tn == 234500, Volume );

color = IIf( tn <= 91500, colorBlack,
        IIf( tn <= 101500, colorRed,
        IIf( tn > 154500, colorGrey50, colorDarkBlue ) ) );

ntn = tn ==  91500;

Night0 = ValueWhen( ntn, CumulativeVolume, 1 );
Night1 = ValueWhen( ntn, CumulativeVolume, 2 );
Night2 = ValueWhen( ntn, CumulativeVolume, 3 );
Night3 = ValueWhen( ntn, CumulativeVolume, 4 );
Night4 = ValueWhen( ntn, CumulativeVolume, 5 );

AvgNight = ( Night4 + Night3 + Night2 + Night1 ) / 4;

if( ParamToggle( "Type", "Price|CumVol" ) == 0 )
{
     Plot( C, Date(), color, styleCandle );
}
else
{
     Plot( IIf( tn < 91500, CumulativeVolume, 0 ), "N0",
           colorDarkGrey,
           styleHistogram | styleLeftAxisScale, 4 );
     Plot( AvgNight, "AM", colorDarkRed,
           styleDashed | styleLeftAxisScale );
}

Top = ValueWhen( tn == 101500, HighestSince( ntn, High ) );
Bot = ValueWhen( tn == 101500, LowestSince( ntn, Low ) );

MidSession = tn >= 103000 AND tn < 154500;

if( Strategy == 1 )
{
//First Hour BreakOut
    Buy = MidSession AND Close > Top;
    Short = MidSession AND Close < Bot;

}

if( Strategy == 2 )
{
     VolRatioUp = 1;

     Buy = MidSession AND Night0 > VolRatioUp * AvgNight
           AND Close > Top;
     Short = MidSession AND Night0 > VolRatioUp * AvgNight
             AND Close < Bot;
}

ClosePosTime = tn == 160000;

Sell = ClosePosTime;
Cover = ClosePosTime;

Buy = ExRem( Buy, Sell );
Sell = ExRem( Sell, Buy );
PlotShapes( Buy*shapeUpArrow, colorGreen, 0, L );
PlotShapes( Sell*shapeDownArrow, colorRed, 0, H );
A sample chart is shown in Figure 5.
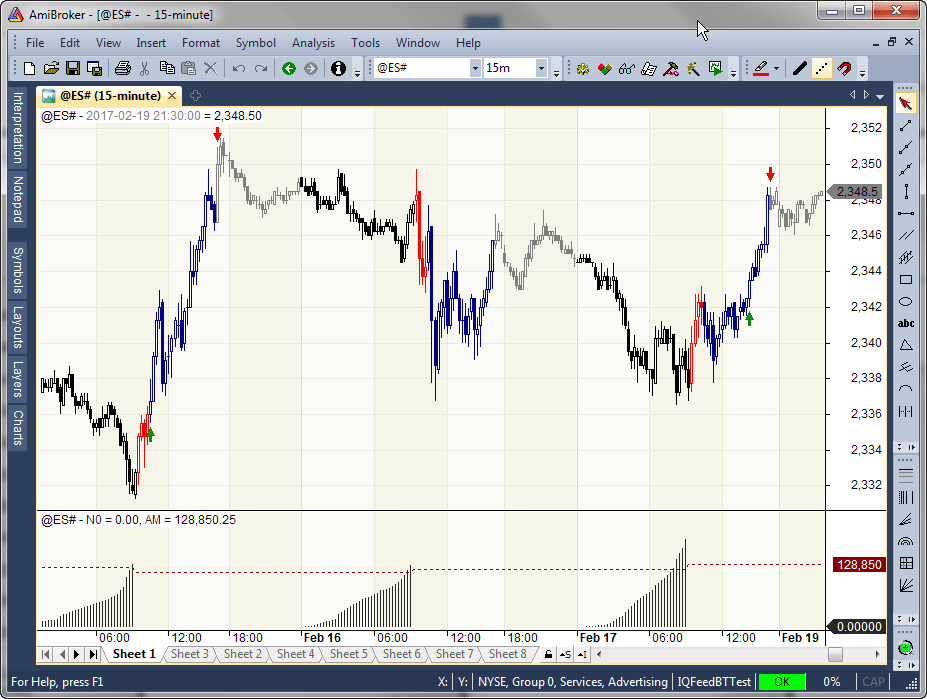
FIGURE 5: AMIBROKER. Here is a
sample 15-minute ES chart with the different trading sessions marked in different
colors. The generated trading signals and cumulative nightly volume replicates
a chart from D’Errico’s article in this issue.
—Tomasz Janeczko, AmiBroker.com
www.amibroker.com
BACK TO LIST

NEUROSHELL TRADER: JUNE 2017
The daytrading with night volume trading system as described by Domenico D’Errico
in his article in this issue, “Daytrading With Night Volume,” can be easily
implemented in NeuroShell Trader. Simply select new trading strategy from
the insert menu and enter the following in the appropriate locations
of the trading strategy wizard:
BUY LONG CONDITIONS: [All of which must be true]
     X<=Time<=Y(Date,10:45:00 AM,4:00:00 PM)
     A>B(SelectiveLag(Sub(CumSum(Volume,0),SelectiveLag(CumSum(Volume,0),Time=X(Date,12:00:00 AM),1)), Time=X(Date,9:30:00 AM),1), SelectiveAvg( Sub( CumSum(Volume,0), SelectiveLag( CumSum( Volume,0), Time=X(Date,12:00:00 AM),1)), Time=X(Date,9:30:00 AM),5))
     A>B(Close,SelectiveLag(PriceHigh(High,4),Time=X(Date,10:30:00 AM),1))

SELL LONG CONDITIONS:
     Time=X(Date,4:15:00 PM)

SELL SHORT CONDITIONS:
     X<=Time<=Y(Date,10:45:00 AM,4:00:00 PM)
     A>B(SelectiveLag(Sub(CumSum(Volume,0),SelectiveLag(CumSum(Volume,0),Time=X(Date,12:00:00 AM),1)), Time=X(Date,9:30:00 AM),1), SelectiveAvg( Sub( CumSum(Volume,0), SelectiveLag( CumSum( Volume,0), Time=X(Date,12:00:00 AM),1)), Time=X(Date,9:30:00 AM),5))
     A<B(Close,SelectiveLag(PriceLow(Low,4),Time=X(Date,10:30:00 AM),1))

COVER SHORT CONDITIONS: [All of which must be true]
     X<=Time<=Y(Date,10:45:00 AM,4:00:00 PM)
Note that the times were adjusted to EST. If you have NeuroShell Trader Professional,
you can also choose whether the parameters should be optimized. After backtesting
the trading strategy, use the detailed analysis button to view the
backtest and trade-by-trade statistics for the strategy.
Users of NeuroShell Trader can go to the Stocks & Commodities section
of the NeuroShell Trader free technical support website to download a copy
of this or any previous Traders’ Tips.
A sample chart is shown in Figure 6.

FIGURE 6: NEUROSHELL TRADER. This
example NeuroShell Trader chart shows the daytrading with night volume system.
—Marge Sherald, Ward Systems Group, Inc.
301 662-7950, sales@wardsystems.com
www.neuroshell.com
BACK TO LIST

TRADERSSTUDIO: JUNE 2017
The TradersStudio code based on Domenico D’Errico’s article in this issue,
“Daytrading With Night Volume,” is provided at www.TradersEdgeSystems.com/traderstips.htm and
is also shown below.
The following code file is provided in the download:
- System: DAY_NIGHT—Code for the author’s set of two systems.
I ran four tests using five-minute bar data on the ES that was compressed
to 15-minute bars over the period 7/16/2009 to 7/17/2014.
- Test 1: Longs and shorts allowed, using strategy 1. (See
Figure 7 equity curve)
- Test 2: Longs only, using strategy 1. (See Figure 8 equity
curve)
- Test 3: Longs and shorts allowed, using strategy 2. (See
Figure 9 equity curve)
- Test 4: Longs only, using strategy 2. (See Figure 10 equity
curve)
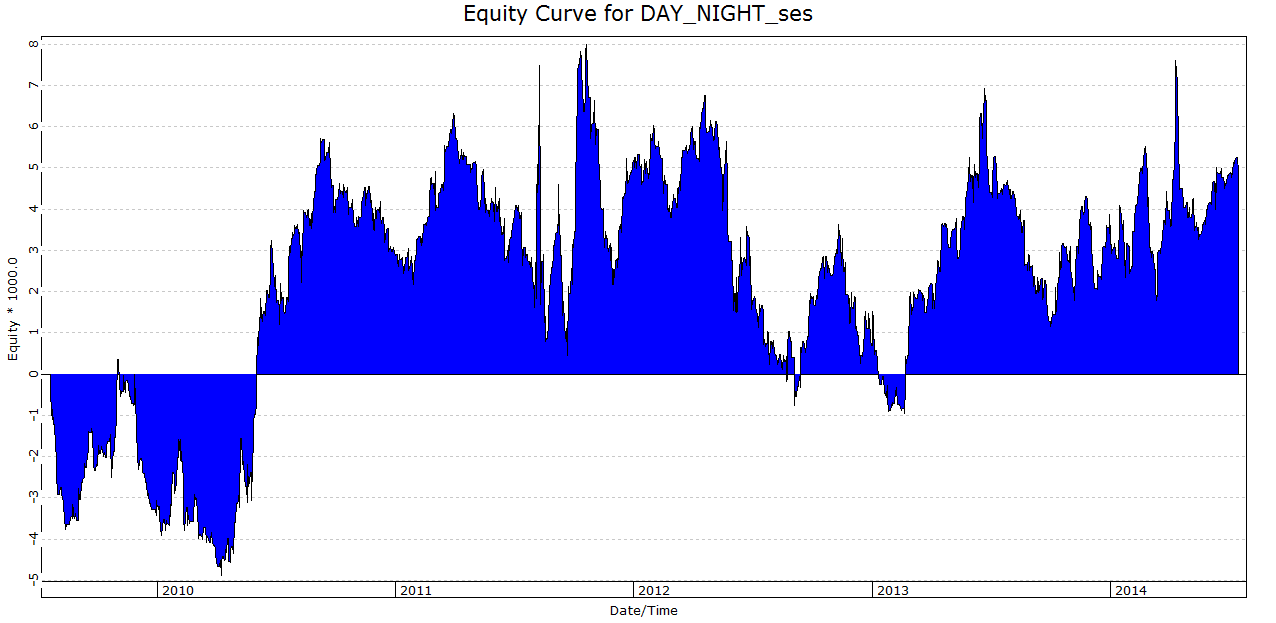
FIGURE 7: TRADERSSTUDIO. Here is
an equity curve for Strategy 1 with both longs and shorts allowed.
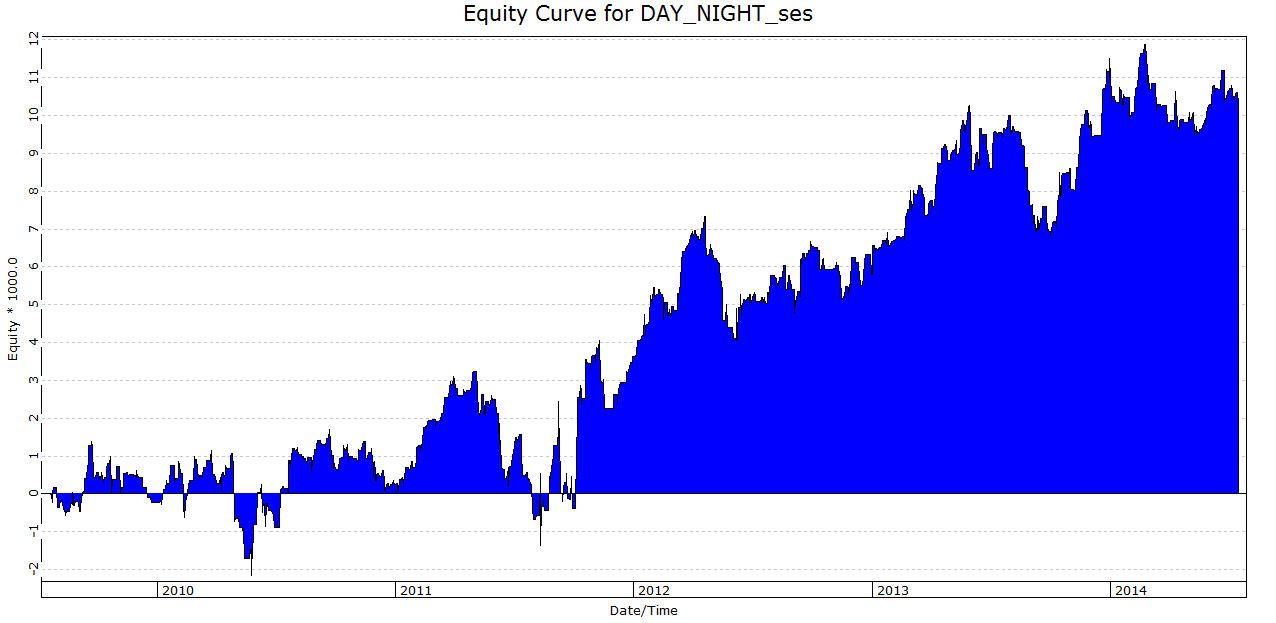
FIGURE 8: TRADERSSTUDIO. Here is
an equity curve for Strategy 1 with longs only allowed.
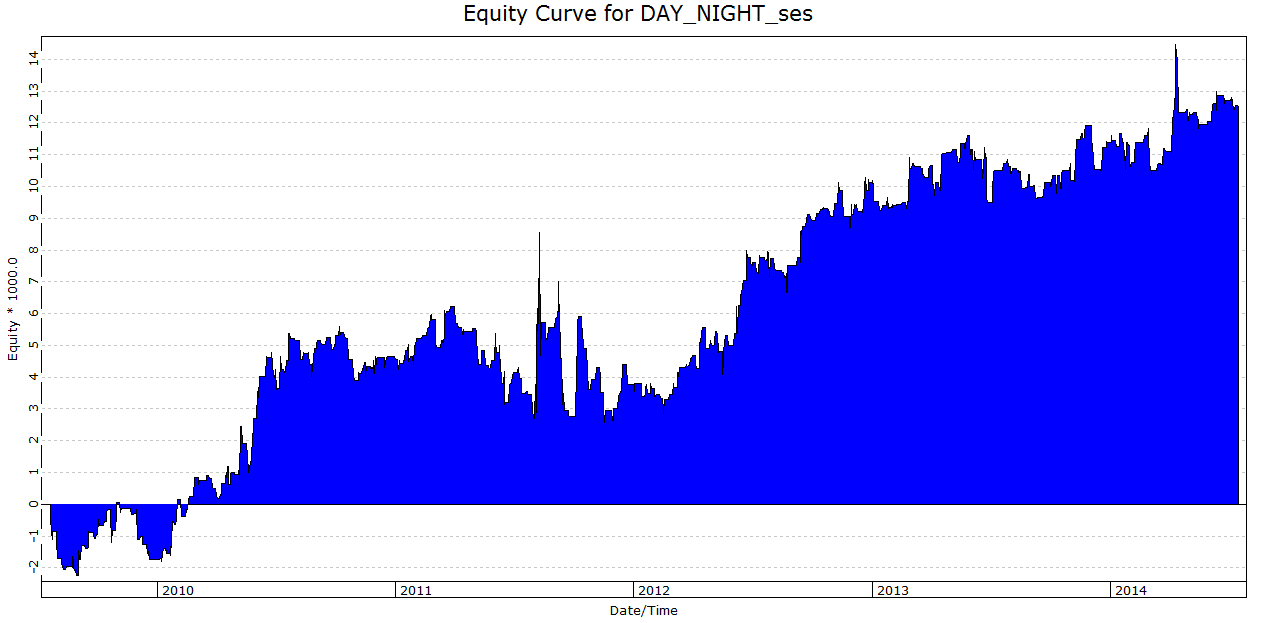
FIGURE 9: TRADERSSTUDIO. Here is
an equity curve for Strategy 2 with both longs and shorts allowed.
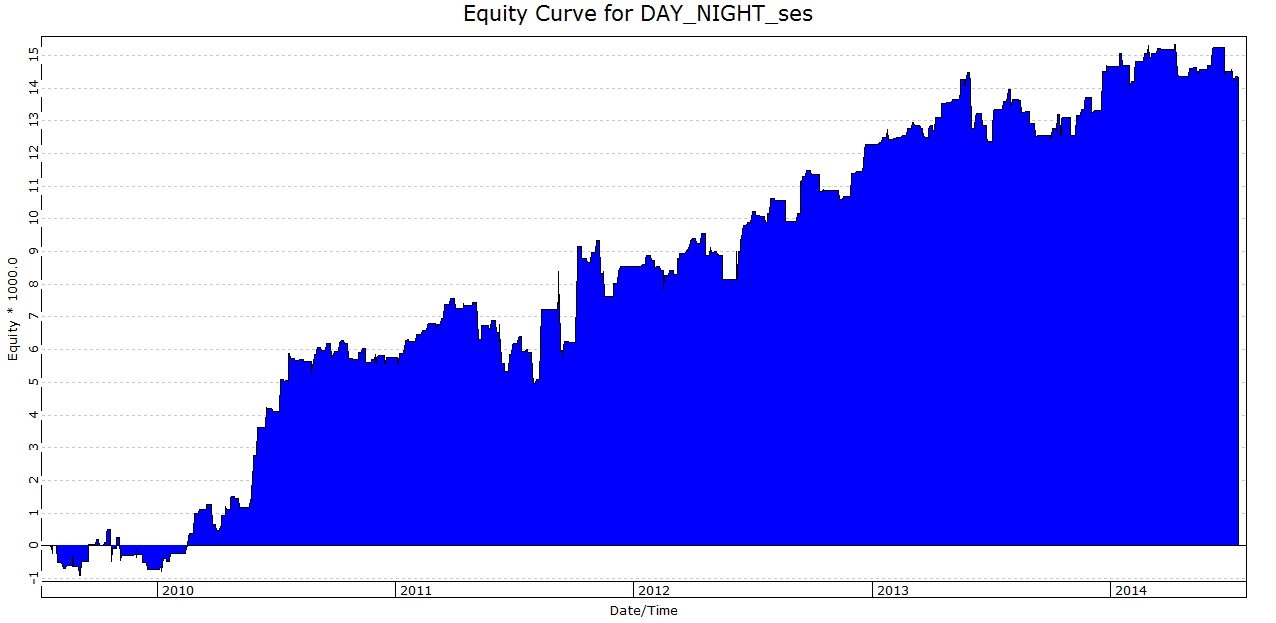
FIGURE 10: TRADERSSTUDIO. Here
is an equity curve for Stategy 2 with longs only allowed.
My test confirmed the author’s results that the night volume filter improved
the results and also reduced the number of trades. Please note that slippage
and commissions were not deducted from the test results. The tests were done
solely for comparison purposes.
The code for use in TradersStudio is shown here:
'Day Trading with Night Volume
'Night and Day Demo Strategy
'Author: Domenico D'Errico, TASC June 2017
'Code by: Richard Denning, 4/13/17
'www.TradersEdgeSystems.com

Sub DAY_NIGHT(Strategy, VolRatioUP, BarsPerHour, AllowShorts)
    Dim CumulativeVol As BarArray
    Dim AvgNight As BarArray
    Dim Top
    Dim Bot
    Dim count
    Dim OneHourBeforeMidnight
    Dim MainOpen
    Dim EndFirstHour
    Dim MainEnd
    OneHourBeforeMidnight = 2300
    MainOpen = 630
    EndFirstHour = MainOpen + 100
    MainEnd = 1300

'Price Levels
    If Time=MigrateTime(EndFirstHour) Then
        Top=0
        Bot=999999
        count=0
        GValue503=0
        GValue504=99999
    For count=0 To BarsPerHour - 1
        If High[count]>Top Then
            Top=High[count]
        End If
        If Low[count]<Bot Then
            Bot=Low[count]
        End If
        GValue503=Top
        GValue504=Bot
    Next
    End If

'Signals
'Fist Hour Breakout
    If Strategy=1 Then

        If Time>=MigrateTime(EndFirstHour+15) And Time<MigrateTime(MainEnd) Then
            Top = GValue503
            Bot = GValue504
            If Close > Top Then
                Buy("BrkUp", 1, 0, Market, Day)
            End If
            If Close < Bot And AllowShorts=1 Then
                Sell("BrkDn", 1, 0, Market, Day)
            End If
        End If
    End If

'Night and Day
    If Strategy=2 Then
        Dim Night As Array
        Dim Day_ As Array
        ReDim (Night, 6)
        ReDim (Day_, 6)

        If BarNumber = FirstBar Then
            count=0
            For count=0 To 5
                Night[count]=0
                Day_[count]=0
            Next
            GValue501 = 0
            GValue502 = 0
        End If

        Night = GValue501
        Day_ = GValue502

    If Time = MigrateTime(OneHourBeforeMidnight) Then
        CumulativeVol=0
    End If

    CumulativeVol=CumulativeVol+Vol

    If Time=MigrateTime(MainOpen) Then
        Night[4]=Night[3]
        Night[3]=Night[2]
        Night[2]=Night[1]
        Night[1]=Night[0]
        Night[0]=CumulativeVol
    End If

    AvgNight=(Night[4]+Night[3]+Night[2]+Night[1])/4

    If Night[0] > VolRatioUP*AvgNight Then
        If Time>=MigrateTime(EndFirstHour+15) And Time<MigrateTime(MainEnd) Then
            Top = GValue503
            Bot = GValue504
            If Close > Top Then
                Buy("BrkUp_", 1, 0, Market, Day)
            End If
            If Close < Bot And AllowShorts=1 Then
                Sell("BrkDn_", 1, 0, Market, Day)
            End If
          End If
        End If
    End If

'Exits for both strategies
    If Time=MigrateTime(MainEnd) Then
        If GetMarketPosBack(0)= 1 Then
            ExitLong("", "", 1, 0, Market, Day)
        End If
        If GetMarketPosBack(0)=-1 Then
            ExitShort("", "", 1, 0, Market, Day)
        End If
    End If

    GValue501 = Night
    GValue502 = Day_

End Sub
—Richard Denning
info@TradersEdgeSystems.com
for TradersStudio
BACK TO LIST

NINJATRADER: JUNE 2017
The night and day strategy, as discussed by Domenico D’Errico in “Daytrading
With Night Volume” in this issue, is available for download at the following
links for NinjaTrader 8 and for NinjaTrader 7.
Once the file is downloaded, you can import the strategy in NinjaTrader 8
from within the Control Center by selecting Tools → Import → NinjaScript
Add-On and then selecting the downloaded file for NinjaTrader 8. To import
in NinjaTrader 7 from within the Control Center window, select the menu File → Utilities → Import
NinjaScript and select the downloaded file.
You can review the strategy’s source code in NinjaTrader 8 by selecting the
menu New → NinjaScript Editor → Strategies from within the Control
Center window and selecting the NightAndDay file. You can review the strategy’s
source code in NinjaTrader 7 by selecting the menu Tools → Edit NinjaScript → Strategy
from within the Control Center window and selecting the NightAndDay file.
NinjaScript uses compiled DLLs that run native, not interpreted, which provides
you with the highest performance possible.
A sample NinjaTrader chart implementing the strategy is shown in Figure 11.

FIGURE 11: NINJATRADER. The NightAndDay
strategy displays the long entry and exit after a volatile night on an ES
06-17 15-minute chart for April 4, 2017.
—Raymond Deux, & Jim Dooms
NinjaTrader, LLC
www.ninjatrader.com
BACK TO LIST

UPDATA: JUNE 2017
In “Daytrading With Night Volume” in this issue, author Domenico D’Errico
proposes that the nighttime session for a contract’s volume is correlated to
the successive day session’s volume range and volatility. The author proposes
that by looking for excesses in the night session’s volume compared to an average
value, it might be possible to find a better selection of breakout trades.
The Updata code based on this article is in the Updata library and may be
downloaded by clicking the custom menu and system library. Those who cannot
access the library due to a firewall may paste the code given here into the
Updata custom editor and save it.
'Night & Day Demo Strategy
NAME "" ""
PARAMETER "Mult." @MULT=1
DISPLAYSTYLE 2LINES
INDICATORTYPE CHART
PLOTSTYLE2 MOUNTAIN
COLOUR RGB(200,0,0)
#VOLUME=0
#NIGHT0=0
#NIGHT1=0
#NIGHT2=0
#NIGHT3=0
#NIGHT4=0
@AVGVOL=0
@MAX=-1
@MIN=100000
FOR #CURDATE=0 TO #LASTDATE
IF (#CURHOUR=8 AND #CURMINUTE<30) OR #CURHOUR<8
#VOLUME=#VOLUME+VOL
#NIGHT0=#VOLUME
@MAX=MAX(@MAX,HIGH(1))
@MIN=MIN(@MIN,LOW(1))
ENDIF
IF (#CURHOUR=8 AND #CURMINUTE=30)
#NIGHT4=#NIGHT3
#NIGHT3=#NIGHT2
#NIGHT2=#NIGHT1
#NIGHT1=#NIGHT0
@AVGVOL=(#NIGHT0+#NIGHT1+#NIGHT2+#NIGHT3+#NIGHT4)/5
#VOLUME=0
ENDIF
'@AVGVOL=(#NIGHT0+#NIGHT1+#NIGHT2+#NIGHT3+#NIGHT4)/5
IF #NIGHT0>@MULT*@AVGVOL
   IF (#CURHOUR>8 AND #CURHOUR<10)
       IF HIGH>@MAX
          COVER @MAX
          BUY @MAX
       ENDIF
       IF LOW<@MIN
          SELL @MIN
          SHORT @MIN
       ENDIF
   ENDIF
ENDIF
IF ORDERISOPEN!=0 AND #CURDAY != HIST(#CURDAY,-1)
   SELL CLOSE
   COVER CLOSE
ENDIF
@PLOT=@AVGVOL
@PLOT2=#VOLUME
NEXT
A sample Updata chart implementing the strategy is shown in Figure 12.
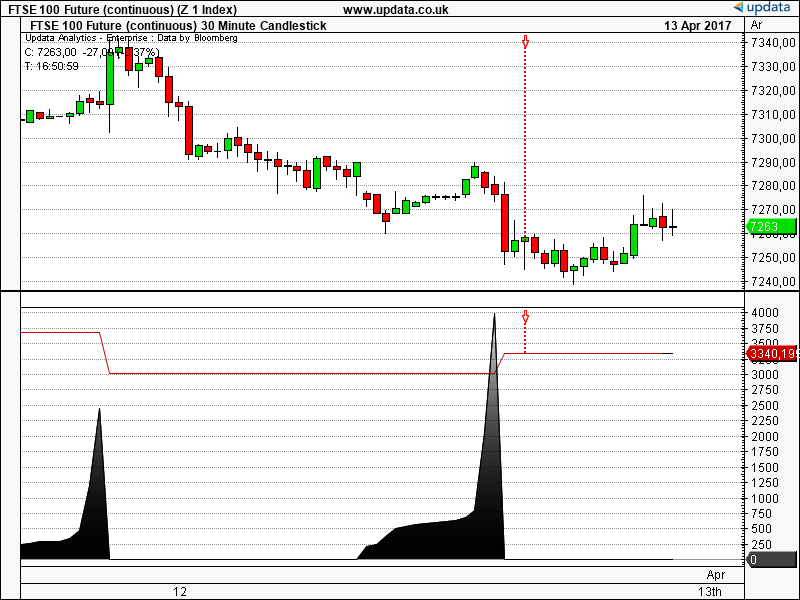
FIGURE 12: UPDATA. Here, the night & day
strategy is applied to FTSE-100 futures data in 30-minute resolution.
—Updata support team
support@updata.co.uk
www.updata.co.uk
BACK TO LIST
Originally published in the June 2017 issue of
Technical Analysis of STOCKS & COMMODITIES magazine.
All rights reserved. © Copyright 2017, Technical Analysis, Inc.


