TRADERS’ TIPS
August 2017

For this month’s Traders’ Tips, the focus is Domenico D’Errico and Giovanni Trombetta’s article in this issue, “System Development Using Artificial Intelligence.” Here, we present the August 2017 Traders’ Tips code with possible implementations in various software.
The Traders’ Tips section is provided to help the reader implement a selected technique from an article in this issue or another recent issue. The entries here are contributed by software developers or programmers for software that is capable of customization.

TRADESTATION: AUGUST 2017
In the article “System Development Using Artificial Intelligence” in this issue, authors Domenico D’Errico and Giovanni Trombetta discuss the question as to whether humans or computers are better at trading. They attempt to merge the two approaches by using genetic algorithms and out-of-sample testing. The authors have provided some EasyLanguage code with their article for a strategy developed using these techniques.
TradeStation offers a number of advanced tools and capabilities to assist traders with strategy backtesting and optimization. The trader can perform multithreaded genetic optimizations in TradeStation charts. The results of the optimizations can be analyzed with the TradeStation Walk-Forward Optimizer (WFO) which is an advanced strategy optimization tool that automates the complex, multistep task of carrying out the statistical walk-forward testing of a trading strategy’s optimized inputs. The strategy can then be tested on your desired portfolio of symbols using TradeStation Portfolio Maestro.
Here, we are providing a modified version of the strategy discussed in the article. This modified version can be used with the TradeStation tools we mentioned to perform your own research and analysis.
// TASC Aug 2017
// Artificial Intelligence for
// System Development
// Domenico D'Errico and
// Giovanni Trombetta

inputs:
	AP1( 4), AP2( 3), AP3( 4), AP4( 5),
	AP5( 3), AP6( 3), AP7( 3), AP8( 1),
	AP9( 4), AP10( 1), AP11( 1),
	MP1( 4), MP2( 2), MP3( 3), MP4( 3),
	MP5( 1), MP6( 1), MP7( 4), MP8( 1),
	MP9( 5), MP10( 1), MP11( 3),
	MBP1( 2), MBP2( 1), MBP3( 2),
	MBP4( 3), MBP5( 2), MBP6( 4),
	MBP7( 1), MBP8( 1), MBP9( 2),
	MBP10( 1), MBP11( 0), MBP12( 1),
	Single_Trade_Money( 10000),
	Time_Exit( 8), Time_ExitGain( 6),
	Enter_Gap( -0.08) ;

variables:
	cond1(0), condExit(0), Ncon(0),
	MedPrice( 0 ), MedBodyPrice( 0 ),
	AveragePrice( 0 ), MP( 0 ), BSE( 0 ),EP( 0 ) ;

MP = MarketPosition ;
BSE = BarsSinceEntry ;
EP = EntryPrice ;
AveragePrice = AvgPrice ;
MedPrice = ( High + Low ) / 2 ;
MedBodyPrice = ( Open + CLose ) / 2 ;


//******* SETUP GANDALF PATTERN *******
if ( AveragePrice[AP1] < MedPrice[MP1] and
MedPrice[MP2] <= AveragePrice[AP2] and
MedBodyPrice[MBP1] <= AveragePrice[AP3] )
or ( AveragePrice[AP4] < MedPrice[MP3] and
MedBodyPrice[MBP2] < MedPrice[MP4] and
MedBodyPrice[MBP3] < MedBodyPrice[MBP4] ) then
	cond1 = 1
else
	cond1 = 0 ;

//******* EXIT GANDALF PATTERN ********
if ( AveragePrice[AP5] < MedBodyPrice[MBP5] and
MedPrice[MP5] = MedBodyPrice[MBP6] and
MedBodyPrice[MBP7] <= MedBodyPrice[MBP8] )
or ( AveragePrice[AP6] < MedBodyPrice[MBP9] and
MedPrice[MP6] <= AveragePrice[AP7] and
MedBodyPrice[MBP10] <= AveragePrice[AP8] )
or ( AveragePrice[AP9] < MedBodyPrice[MBP11] and
MedPrice[MP7] <= AveragePrice[AP10] and
MedBodyPrice[MBP12] <= AveragePrice[AP11] ) then
	condExit = 1
else
	condExit = 0 ;

//******* POSITION SIZING **********
Ncon = Single_Trade_Money / Close ;


If MP = 0 and cond1 = 1 then
	Buy ( "eL_L" ) Ncon shares next bar
		at Low + Enter_Gap Limit;

if BSE <> ( Time_Exit - 1 )
	and MP = 1 and condExit = 1
	and ( Close - EP ) < 0 then
		Sell ( "P_L_exit_L" ) next bar
			at Open ;

// Time Exit Module
If MP = 1 and BSE >= ( Time_Exit - 1 ) then
	Sell ( "T_exit_L" ) next bar
		at Open ;

// Time Exit Gain Module
If MP = 1 and BSE >= ( Time_ExitGain - 1 )
	and ( Close - EP ) > 0 then
	Sell ( "TimeExitGain_L" ) next bar
		at Open ;
A sample chart is shown in Figure 1.

FIGURE 1: TRADESTATION. This shows a daily IWM iShares Russell 2000 ETF TradeStation chart with the strategy applied.
To download the EasyLanguage code for the strategy as well as an example Portfolio Maestro configuration export, please visit our TradeStation and EasyLanguage support forum. The files can be found here: https://community.tradestation.com/Discussions/Topic.aspx?Topic_ID=142776. The filename is “TASC_AUG2017.ZIP.”
For more information about EasyLanguage in general, please see https://www.tradestation.com/EL-FAQ.
This article is for informational purposes. No type of trading or investment recommendation, advice, or strategy is being made, given, or in any manner provided by TradeStation Securities or its affiliates.
—Doug McCrary
TradeStation Securities, Inc.
www.TradeStation.com
BACK TO LIST

METASTOCK: AUGUST 2017
Domenico D’Errico and Giovanni Trombetta’s article in this issue, “System Development Using Artificial Intelligence,” presents a trading system created through genetic algorithms. The system is fully explained in the article and only the code is provided here.
As designed, the system gives entry & exit signals to be acted upon on the next bar. The MetaStock formulas given here were written to look for the signal on the previous bar and then enact them on the current bar. The effect is the same but the logic is easier to implement.
General tab:
Name: Gandalf AI System
Notes:
Created by Roberto Giaccio.
Based on previous version by Giovanni Trombetta.

Buy Order tab:
Formula:
avgp:= (open + high + low + close)/4;
medp:= (high + low)/2;
medbp:= (open + close)/2;
entrySignal:=
(Ref(avgp < medp, -1) AND
ref(medp,-2) <= ref(avgp,-1) AND
ref(medbp,-2) <= ref(avgp, -3))
OR
(ref(avgp,-1) < ref(medp, -3) AND
ref(medbp,-1) < ref(medp, -2) AND
ref(medbp,-1) < ref(medbp, -2));
ref(entrySignal, -1)

Order Type: Limit
Limit or Stop Price: Ref(low, -1) + 0.08
Entry Size: 10000
Expiration: Good for Day
Sell Order tab:
Formula:
avgp:= (open + high + low + close)/4;
medp:= (high + low)/2;
medbp:= (open + close)/2;
profit:= Simulation.CurrentPositionProfit;
time:= Simulation.CurrentPositionAge;
exitSignal:=
(profit >0 AND time >= 6) OR
(profit <=0 AND
(time >= 8)
OR
(Ref(avgp < medbp, -1) AND
ref(medp, -2) = ref(medbp, -3) AND
ref(medbp, -1) <= ref(medbp, -4))
OR
(ref(avgp,-2) < medbp AND
ref(medp,-4) <= ref(avgp,-3) AND
ref(medbp <= avgp, -1) )
OR
(ref(avgp,-2) < medbp AND
ref(medp,-4) <= ref(avgp,-3) AND
ref(medbp <= avgp, -1)));
Ref(exitSignal, -1)

Order Type: Stop Limit
Limit or Stop Price: Open
—William Golson
MetaStock Technical Support
www.metastock.com
BACK TO LIST

eSIGNAL: AUGUST 2017
For this month’s Traders’ Tip, we’ve provided the study AI_SysDev.efs based on the formula given in the article “System Development Using Artificial Intelligence” in this issue by Domenico D’Errico and Giovanni Trombetta. The authors present a trading strategy based on an artificial intelligence algorithm.
The eSignal study contains formula parameters that may be configured through the edit chart window (right-click on the chart and select “edit chart”). A sample chart is shown in Figure 2.

FIGURE 2: eSIGNAL. Here is an example of the study plotted on a daily chart of IWM.
To discuss this study or download a complete copy of the formula code, please visit the EFS library discussion board forum under the forums link from the support menu at www.esignal.com or visit our EFS KnowledgeBase at https://www.esignal.com/support/kb/efs/. The eSignal formula script (EFS) is also available for copying & pasting here:
/*********************************
Provided By:
eSignal (Copyright c eSignal), a division of Interactive Data
Corporation. 2016. All rights reserved. This sample eSignal
Formula Script (EFS) is for educational purposes only and may be
modified and saved under a new file name.  eSignal is not responsible
for the functionality once modified.  eSignal reserves the right
to modify and overwrite this EFS file with each new release.

Description:
    Artificial Intelligence For System Development by Domenico D'Errico & Giovanni Trombetta

Version:            1.00  06/14/2017

Formula Parameters:                     Default:
Enter Gap                               -0.08
Bars To Exit                            8
Bars To Exit Gain                       6


Notes:
The related article is copyrighted material. If you are not a subscriber
of Stocks & Commodities, please visit www.traders.com.

**********************************/

var fpArray = new Array();

function preMain(){
    setPriceStudy(true);
    setShowCursorLabel(false);

    var x=0;

    fpArray[x] = new FunctionParameter("gap", FunctionParameter.NUMBER);
	with(fpArray[x++]){
        setName("Enter Gap");
        setDefault(-0.08);
        }

    fpArray[x] = new FunctionParameter("nBarsToExit", FunctionParameter.NUMBER);
	with(fpArray[x++]){
        setName("Bars To Exit");
        setDefault(8);
        setLowerLimit(1);
        }

    fpArray[x] = new FunctionParameter("nBarsToExitGain", FunctionParameter.NUMBER);
	with(fpArray[x++]){
        setName("Bars To Exit Gain");
        setDefault(6);
        setLowerLimit(1);
        }

}

var bInit = false;
var bVersion = null;

var xClose = null;
var xOpen = null;
var xHigh = null;
var xLow = null;

var xAvgPrice = null;
var xMedPrice = null;
var xMedBodyPrice = null;

var nEntryBarN = 0;
var nEntryPrice = 0;

var positiveEntry = false;
var positiveExit = false;


function main(gap, nBarsToExit, nBarsToExitGain){
    if (bVersion == null) bVersion = verify();
    if (bVersion == false) return;

    if (getBarState() == BARSTATE_ALLBARS){
        bInit = false;
    }

    if (!bInit){
        xOpen = open();
        xClose = close();
        xHigh = high();
        xLow = low();

        xAvgPrice = ohlc4();
        xMedPrice = hl2();
        xMedBodyPrice = oc2();

        nEntryBarN = 0;
        nEntryPrice = 0;

        positiveEntry = false;
        positiveExit = false;

        bInit = true;
    }

    if (getCurrentBarIndex() != 0){

        if ((xAvgPrice.getValue(-2) < xMedPrice.getValue(-2)
             && xMedPrice.getValue(-3) <= xAvgPrice.getValue(-2)
             && xMedBodyPrice.getValue(-3) <= xAvgPrice.getValue(-4))

            || (xAvgPrice.getValue(-2) < xMedPrice.getValue(-4)
                && xMedBodyPrice.getValue(-1) < xMedPrice.getValue(-3)
                && xMedBodyPrice.getValue(-2) < xMedBodyPrice.getValue(-3))){

            positiveEntry = true;
            if (nEntryPrice != 0) nEntryPrice = 0;
        }
        else {
            positiveEntry = false;
            nEntryPrice = 0;
        }

        if ((xAvgPrice.getValue(-2) < xMedBodyPrice.getValue(-2)
             && xMedPrice.getValue(-3) == xMedBodyPrice.getValue(-4)
             && xMedBodyPrice.getValue(-2) <= xMedBodyPrice.getValue(-5))

            || (xAvgPrice.getValue(-3) < xMedBodyPrice.getValue(-1)
                && xMedPrice.getValue(-5) <= xAvgPrice.getValue(-4)
                && xMedBodyPrice.getValue(-2) <= xAvgPrice.getValue(-2))

            || (xAvgPrice.getValue(-3) < xMedBodyPrice.getValue(-1)
                && xMedPrice.getValue(-5) <= xAvgPrice.getValue(-4)
                && xMedBodyPrice.getValue(-2) <= xAvgPrice.getValue(-2))){

            positiveExit = true;
        }
        else positiveExit = false;

        if (!Strategy.isInTrade() && positiveEntry){
            if (nEntryPrice == 0) nEntryPrice = xLow.getValue(-1) + gap;
            if (xHigh.getValue(0) >= nEntryPrice && nEntryPrice >= xLow.getValue(0)){
                nEntryPrice = Math.min(xOpen.getValue(0), nEntryPrice);
                Strategy.doLong("eL_L", Strategy.LIMIT, Strategy.THISBAR, Strategy.DEFAULT, nEntryPrice);
                nEntryBarN = getCurrentBarCount();
                positiveEntry = false;
            }

        }

        else{
            var nBarsSinceEntry = getCurrentBarCount() - nEntryBarN;

            if (nBarsSinceEntry != nBarsToExit-1 && positiveExit && ((xClose.getValue(0) - nEntryPrice) < 0))
                Strategy.doSell("P_L_exit_L", Strategy.MARKET, Strategy.THISBAR, Strategy.DEFAULT);
            else if (nBarsSinceEntry >= nBarsToExit -1)
                Strategy.doSell("T_exit_L", Strategy.MARKET, Strategy.THISBAR, Strategy.DEFAULT);
            else if (nBarsSinceEntry >= nBarsToExitGain - 1 && ((xClose.getValue(0) - nEntryPrice) > 0))
                Strategy.doSell("TimeExitGain_L", Strategy.MARKET, Strategy.THISBAR, Strategy.DEFAULT);


            if (!Strategy.isInTrade()){
                nEntryBarN = 0;
                positiveExit = false;
            }
        }
    }

    if (Strategy.isInTrade()) setBarBgColor(Color.RGB(0,60,0));

}


function verify(){
    var b = false;
    if (getBuildNumber() < 3742){
        drawTextAbsolute(5, 35, "This study requires version 12.1 or later.",
            Color.white, Color.blue, Text.RELATIVETOBOTTOM|Text.RELATIVETOLEFT|Text.BOLD|Text.LEFT,
            null, 13, "error");
        drawTextAbsolute(5, 20, "Click HERE to upgrade.@URL=https://www.esignal.com/download/default.asp",
            Color.white, Color.blue, Text.RELATIVETOBOTTOM|Text.RELATIVETOLEFT|Text.BOLD|Text.LEFT,
            null, 13, "upgrade");
        return b;
    }
    else
        b = true;

    return b;
}
—Eric Lippert
eSignal, an Interactive Data company
800 779-6555, www.eSignal.com
BACK TO LIST

WEALTH-LAB: AUGUST 2017
To replicate the method described by Domenico D’Errico and Giovanni Trombetta in their article in this issue, “System Development Using Artificial Intelligence,” Wealth-Lab users should install or update the Genetic Optimizer extension and employ it with the built-in Walk-Forward Optimization (WFO) tool.
In a broad sense, the WFO in Wealth-Lab lets traders plug in any supported optimization method, such as Monte Carlo, genetic algorithms, and more. The common parameters of genetic algorithms (selection, crossover, and mutation methods; population and generation count; and the metric to optimize for) are configurable. In this way, a walk-forward optimization powered by a genetic algorithm finds a set of optimum lookback parameters for the elementary price rules by testing an in-sample data interval and applying them to an out-of-sample section of data (Figure 3).
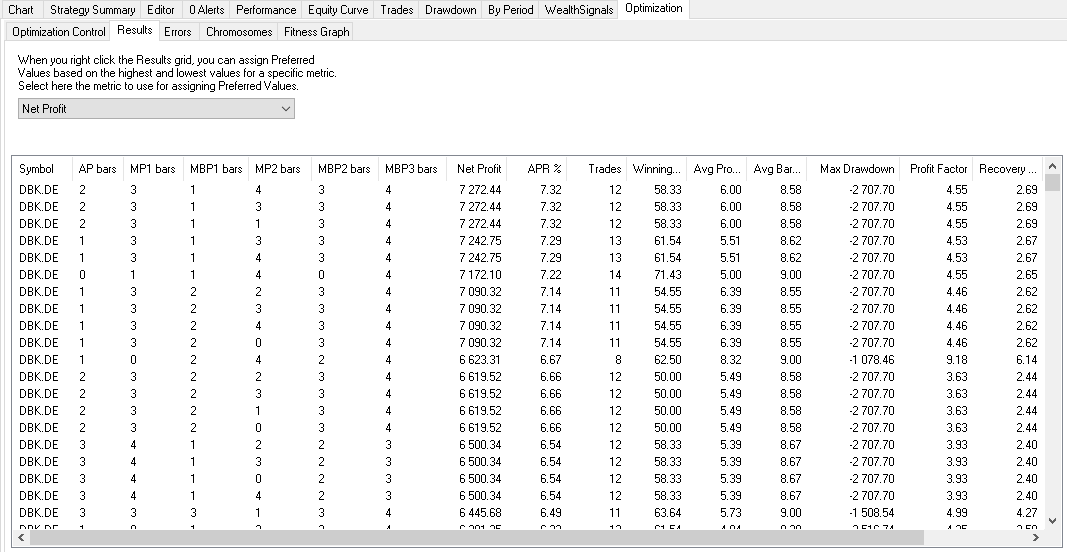
FIGURE 3: WEALTH-LAB. Shown here are sample results of an optimization of the system on DBK.DE stock data using a genetic algorithm. The columns represent the optimizable parameters (entry lookback periods for the elementary price levels) as well as certain performance metrics.
Since a framework that screens for all possible pattern combinations between several prices would be quite complex and lengthy for the purposes of this writeup, we decided to confine ourselves to creating a simple system that implements just the “AI pattern” discussed in D’Errico & Trombetta’s article.
Each elementary price rule comes with a set of numeric variables that can be optimized. Our objective is to provide a more realistic simulation of what could have been achieved with an optimized strategy compared to the backtest results of an exhaustive optimization (Figure 4).
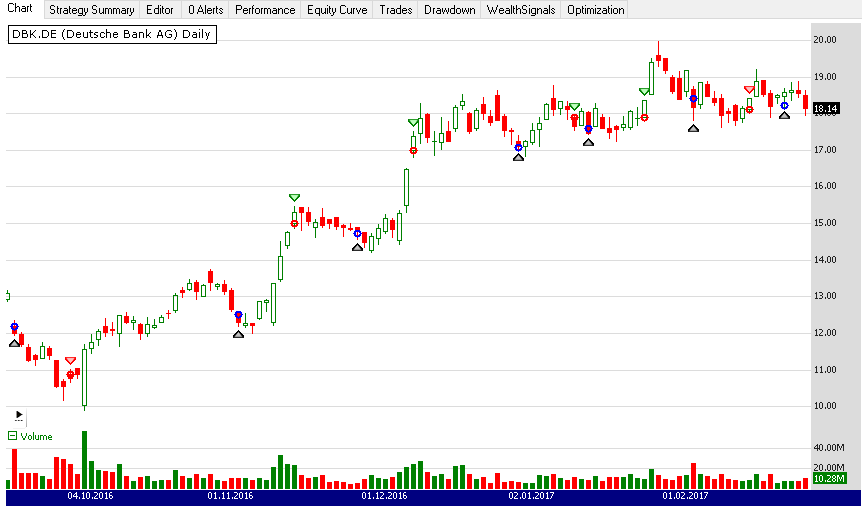
FIGURE 4: WEALTH-LAB. The entry pattern is made up of three rules and an eight-day exit. Here’s how it worked on Deutsche Bank (DBK.DE) stock from September 2016 to March 2017.
Get the companion strategy’s C# code by downloading it right from Wealth-Lab’s open strategy dialog.
Note: If you manually copy/paste the code into Wealth-Lab, click on “References...” in the editor and check “System.Core.”
using System;
using System.Collections.Generic;
using System.Text;
using System.Drawing;
using WealthLab;
using WealthLab.Indicators;
using System.Linq;

namespace WealthLab.Strategies
{
	public class TASC201708 : WealthScript
	{
		private StrategyParameter paramLookback1;
		private StrategyParameter paramLookback2;
		private StrategyParameter paramLookback21;
		private StrategyParameter paramLookback3;
		private StrategyParameter paramLookback31;
		private StrategyParameter paramLookback32;
		private StrategyParameter paramExitAfter;
		private StrategyParameter paramGap;

		public TASC201708()
		{
			paramLookback1 = CreateParameter("AP bars",1,0,4,1);
			paramLookback2 = CreateParameter("MP1 bars",3,0,4,1);
			paramLookback3 = CreateParameter("MBP1 bars",0,0,4,1);
			paramLookback21 = CreateParameter("MP2 bars",2,0,4,1);
			paramLookback31 = CreateParameter("MBP2 bars",1,0,4,1);
			paramLookback32 = CreateParameter("MBP3 bars",2,0,4,1);
			paramExitAfter = CreateParameter("Exit after",8,1,20,1);
			paramGap = CreateParameter("Entry gap",0.08,0.01,1.0,0.01);
		}

		protected override void Execute()
		{
			var averagePrice = (Open+Close+High+Low)/4;
			var medPrice = AveragePrice.Series(Bars);
			var medBodyPrice = (Open+Close)/2;
			var barsAvgPrice = paramLookback1.ValueInt;
			var barsMedPrice = paramLookback2.ValueInt;
			var barsMedPrice2 = paramLookback2.ValueInt;
			var barsMedBodyPrice = paramLookback3.ValueInt;
			var barsMedBodyPrice2 = paramLookback31.ValueInt;
			var barsMedBodyPrice3 = paramLookback32.ValueInt;
			var bars2Exit = paramExitAfter.ValueInt;
			int[] lookback = new int[]{barsAvgPrice,barsMedPrice,barsMedPrice2,
				barsMedBodyPrice,barsMedBodyPrice2,barsMedBodyPrice3};
			int startBar = lookback.Max() + 1;
			var sfasatura = -paramGap.Value;

			for(int bar = GetTradingLoopStartBar(startBar); bar < Bars.Count; bar++)
			{
				if (IsLastPositionActive)
				{
					/* Exit after N days */

					Position p = LastPosition;
					if ( bar+1 - p.EntryBar >= bars2Exit )
						SellAtMarket( bar+1, p, "Timed" );
				}
				else
				{
					/* AI Pattern Generator */

					if( (averagePrice[bar - barsAvgPrice] < medPrice[bar - barsMedPrice]) &&
						(medBodyPrice[bar - barsMedBodyPrice] < medPrice[bar - barsMedPrice2]) &&
						(medBodyPrice[bar - barsMedBodyPrice2] < medBodyPrice[bar - barsMedBodyPrice3]) )
					{
						var entryLabel =
							string.Format("AP[{0}],MP1[{1}],MP2[{2}],MBP1[{3}],MBP2[{4}],MBP3[{5}]",
							barsAvgPrice, barsMedPrice, barsMedPrice2, barsMedBodyPrice,
							barsMedBodyPrice2, barsMedBodyPrice3 );

						BuyAtLimit(bar+1, Low[bar] + sfasatura, entryLabel);
					}
				}
			}
		}
	}
}
—Eugene (Gene Geren), Wealth-Lab team
MS123, LLC
www.wealth-lab.com
BACK TO LIST

NINJATRADER: AUGUST 2017
The GandalfProjectResearchSystem strategy, as discussed in the article “System Development Using Artificial Intelligence” in this issue by Domenico D’Errico and Giovanni Trombetta, is available for download at the following links for NinjaTrader 8 and NinjaTrader 7:
Once the file is downloaded, you can import the strategy in NinjaTader 8 from within the Control Center by selecting Tools → Import → NinjaScript Add-On and then selecting the downloaded file for NinjaTrader 8. To import in NinjaTrader 7 from within the Control Center window, select the menu File → Utilities → Import NinjaScript and select the downloaded file.
You can review the strategy’s source code in NinjaTrader 8 by selecting the menu New → NinjaScript Editor → Strategies from within the Control Center window and selecting the GandalfProjectResearchSystem file. You can review the strategy’s source code in NinjaTrader 7 by selecting the menu Tools → Edit NinjaScript → Strategy from within the Control Center window and selecting the GandalfProjectResearchSystem file.
NinjaScript uses compiled DLLs that run native, not interpreted, which provides you with the highest performance possible.
A sample chart implementing the strategy is shown in Figure 5.
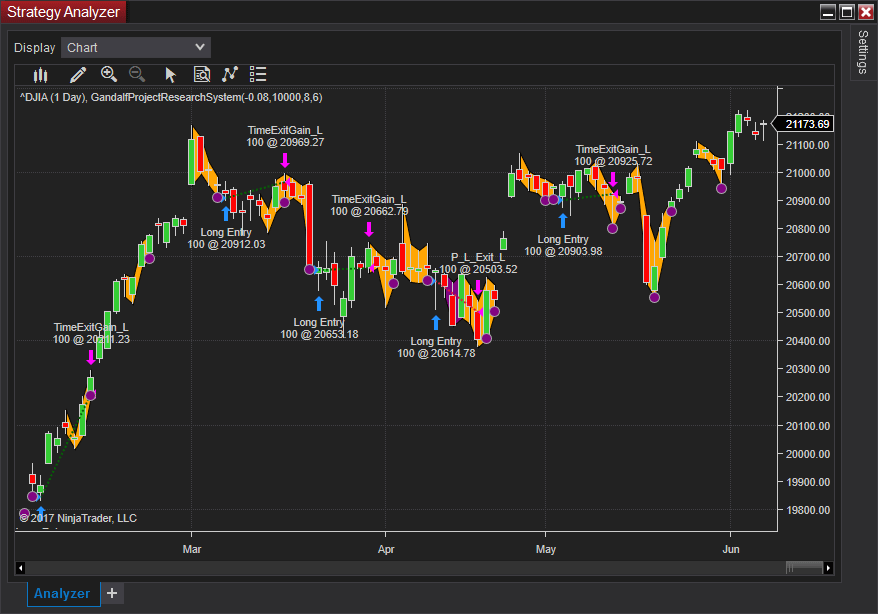
FIGURE 5: NINJATRADER. The GandalfProjectResearchSystem strategy takes several trades on a daily DIJA chart between February 2017 and June 2017 and after calculating price weaknesses, highlighted in orange.
—Raymond Deux & Jim Dooms
NinjaTrader, LLC
www.ninjatrader.com
BACK TO LIST

NEUROSHELL TRADER: AUGUST 2017
Implementing an artificially intelligent genetic algorithm as described by Domenico D’Errico and Giovanni Trombetta in their article in this issue, “System Development Using Artificial Intelligence,” can be easily implemented in NeuroShell Trader.
To create the candlestick pricing patterns, select new indicator from the insert menu, use the indicator wizard to create the following indicators:
AvgPrice:	Avg4( Open, High, Low, Close )
MedPrice:	Avg2( High, Low )
MedBodyPrice:	Avg2( Open, Close )
To set up the three-rule trading system, select new trading strategy from the insert menu and enter the following in the appropriate locations of the trading strategy wizard:
BUY LONG CONDITIONS: [All of which must be true]
     A<B(Lag(AvgPrice,1),Lag(MedPrice,3))
     A<B(Lag(MedBodyPrice,0),Lag(MedPrice,2))
     A<B(Lag(MedBodyPrice,1),Lag(MedBodyPrice,2))

SELL LONG CONDITIONS:
     BarsSinceFill>=X(Trading Strategy,8)
Use NeuroShell Trader’s genetic algorithm optimizer to find optimal parameters by setting the lag parameter ranges to a range of zero to 5. Using the NeuroShell Trader Power User version, you can further test the robustness of the system using genetic algorithm walk-forward optimization, which evaluates out-of-sample performance of systems that reoptimizes regularly on newer data.
Users of NeuroShell Trader can go to the STOCKS & COMMODITIES section of the NeuroShell Trader free technical support website to download a copy of this or any previous Traders’ Tips.
A sample chart is shown in Figure 6. Sample results are shown in Figure 7.
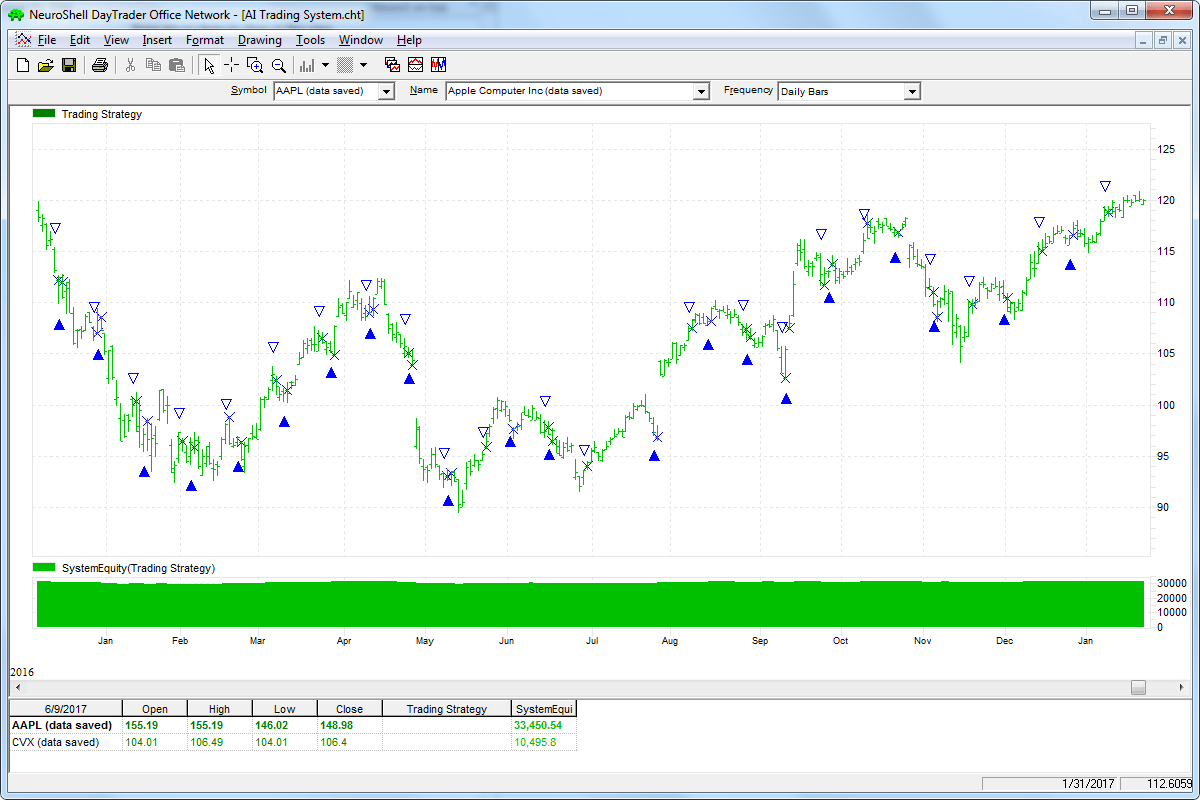
FIGURE 6: NEUROSHELL TRADER. This sample NeuroShell Trader chart shows a genetically optimized candle pattern trading system.
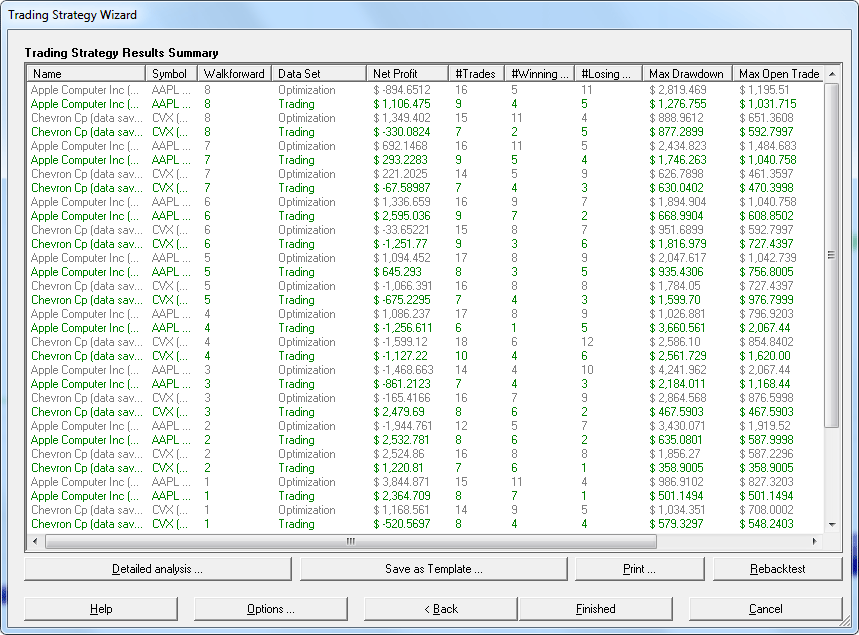
FIGURE 7: NEUROSHELL TRADER. Shown here are sample results of applying NeuroShell Trader’s walk-forward genetic algorithm optimization with eight walk-forwards of six-month out-of-sample datasets.
—Marge Sherald, Ward Systems Group, Inc.
301 662-7950, sales@wardsystems.com
www.neuroshell.com
BACK TO LIST

AMIBROKER: AUGUST 2017
In “System Development Using Artificial Intelligence” in this issue, authors Domenico D’Errico and Giovanni Trombetta take a pattern-based system and run a walk-forward optimization. We have coded this system and we’re presenting here a ready-to-use formula that implements this simple trading system. To use the code, enter it in the formula editor and press backtest to test the system.
Version( 6.0 ); // require AB 6.0

AvgPrice = ( O + H + L + C )/4;
MedPrice = ( H + L )/2;
MedBodyPrice = ( O + C )/2;

bgand1 =  Ref( AvgPrice, -1 ) < Ref( MedPrice, -1 ) AND
          Ref( MedPrice, -2 ) <= Ref( AvgPrice, -1 ) AND
          Ref( MedBodyPrice, -2 ) <= Ref( AvgPrice, -3 );

bgand2 =  Ref( AvgPrice, -1 ) < Ref( MedPrice, -3 ) AND
          MedBodyPrice < Ref( MedPrice, -2 ) AND
          Ref( MedBodyPrice, -1 ) < Ref( MedBodyPrice, -2 );


sgand1 =  Ref( AvgPrice, -1 ) < Ref( MedBodyPrice, -1 ) AND
          Ref( MedPrice, -2 ) == Ref( MedBodyPrice, -3 ) AND
          Ref( MedBodyPrice, -1 ) <= Ref( AvgPrice, -4 );


sgand2 =  Ref( AvgPrice, -2 ) < MedBodyPrice AND
          Ref( MedPrice, -4 ) <= Ref( AvgPrice, -3 ) AND
          Ref( MedBodyPrice, -1 ) <= Ref( AvgPrice, -1 );

enter_gap_limit = -0.08;

SetOption("InitialEquity", 300000 );
SetOption("MaxOpenPositions", 30 );
SetTradeDelays( 0, 0, 0, 0 ); // delay using Ref() later
SetPositionSize( 10000, spsValue );
LimitPrice = Ref( L, -1 ) - enter_gap_limit;
BuyPrice = LimitPrice;
Buy = L < LimitPrice AND Ref( bgand1 OR bgand2, -1 );
Sell = Ref( sgand1 OR sgand2, -1 );
SellPrice = Open;
// fixed 8 bar timed exit
ApplyStop( stopTypeNBar, stopModeBars, 8 );
// exit after 6 bars if there is any profit
ApplyStop( stopTypeProfit, stopModePoint, 0.1, False, False, 0, 6 );
A sample chart is shown in Figure 8.
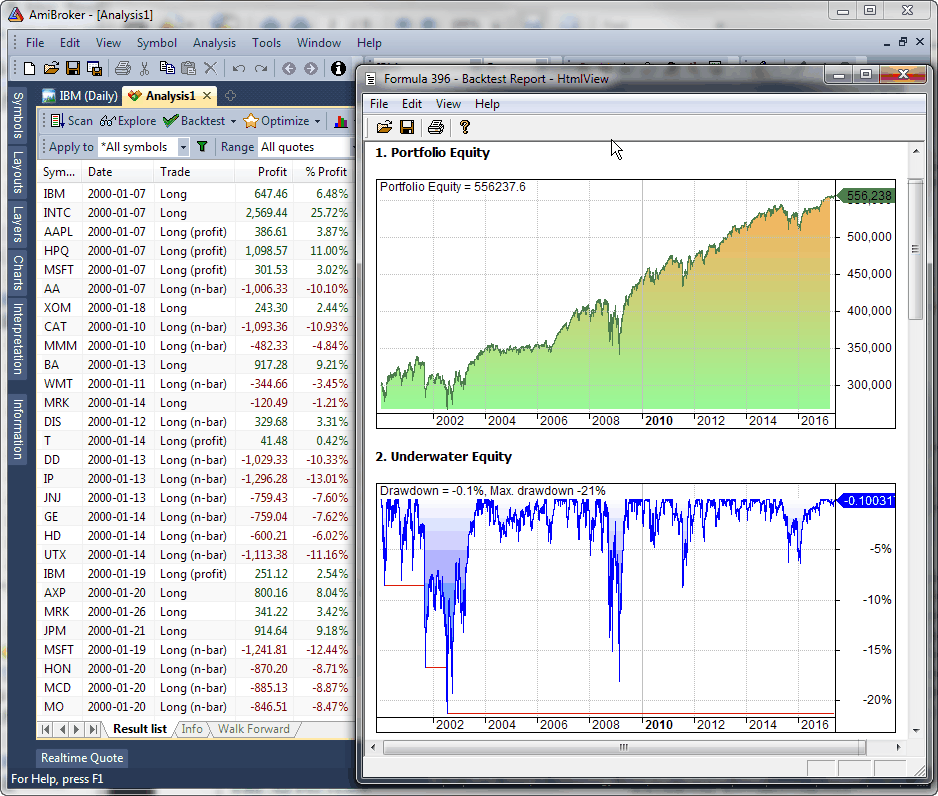
FIGURE 8: AMIBROKER. Shown here are portfolio test results on 30 DJIA stocks. The reward/risk ratio (CAR/MDD<0.25) is not impressive.
—Tomasz Janeczko, AmiBroker.com
www.amibroker.com
BACK TO LIST

UPDATA: AUGUST 2017
Our Traders’ Tip for this month is based on the article in this issue by Domenico D’Errico and Giovanni Trombetta, “System Development Using Artificial Intelligence.”
In the article, the authors propose using machine learning based on simple inputs like the average (OLHC) price, the mid price (HL) and medium body price (OC), and they postulate a set of entry & exit rules that appear to show an edge on in-sample and out-of-sample tests. Figure 9 demonstrates these techniques on an out-of-sample test on the stock Vodafone (VOD). In backtesting, the long-only system didn’t lose a proportional amount of capital on the stock downturns.
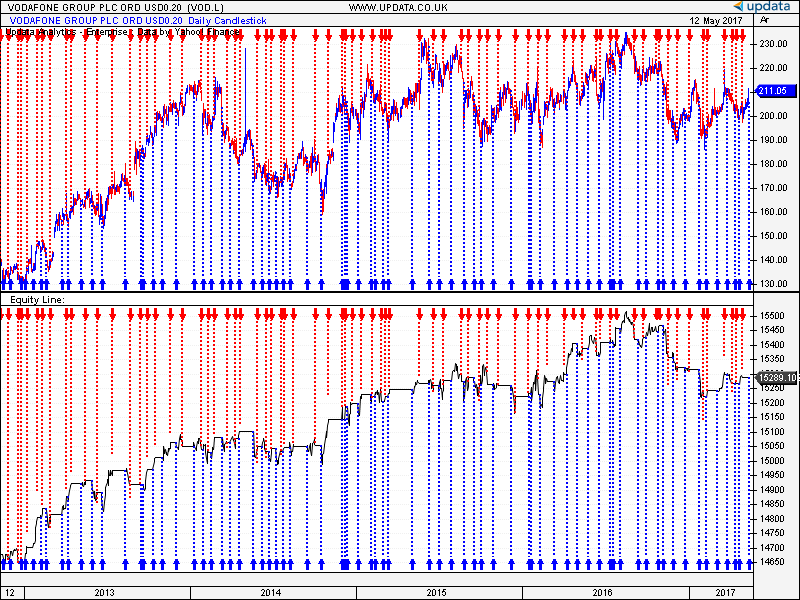
FIGURE 9: UPDATA. Shown here are results of the API pattern system out-of-sample test as applied to Vodafone (VOD) in daily resolution.
This Updata code is in the Updata library and may be downloaded by clicking the custom menu and system library. Those who cannot access the library due to a firewall may paste the code show here into the Updata custom editor and save it.
NAME "" ""
DISPLAYSTYLE CUSTOM
INDICATORTYPE TOOL
PARAMETER "Gap Limit" @LIMIT=0.08
PARAMETER "Max Hold" #HOLD=8
@AvgPrice=0
@MedPrice=0
@MedBodyPrice=0
@LENTRY=0
@LEXIT=0
@ENTRYPRICE=0
FOR #CURDATE=0 TO #LASTDATE
   @AvgPrice=(OPEN+CLOSE+LOW+HIGH)/4
   @MedPrice=(HIGH+LOW)/2
   @MedBodyPrice=(OPEN+CLOSE)/2
   IF LOW<@LENTRY AND @LENTRY>0
      BUY CLOSE
   ENDIF
   @LENTRY=0
   'SET UP
   IF HIST(@AvgPrice,1) < HIST(@MedPrice,1) AND HIST(@MedPrice,2) <= HIST(@AvgPrice,1) AND HIST(@MedBodyPrice,2) <= HIST(@AvgPrice,3) AND ORDERISOPEN=0
      @LENTRY=LOW+@LIMIT
      @ENTRYPRICE=@LENTRY
   ELSEIF HIST(@AvgPrice,1) < HIST(@MedPrice,3) AND HIST(@MedBodyPrice,0) < HIST(@MedPrice,2) AND HIST(@MedBodyPrice,1) <= HIST(@MedBodyPrice,2) AND ORDERISOPEN=0
      @LENTRY=LOW+@LIMIT
      @ENTRYPRICE=@LENTRY
   ENDIF
   'PRICE EXIT
   IF HIST(@AvgPrice,1) < HIST(@MedBodyPrice,1) AND HIST(@MedPrice,2) = HIST(@MedBodyPrice,3) AND HIST(@MedBodyPrice,2) <= HIST(@AvgPrice,3)
      IF CLOSE>@ENTRYPRICE
         SELL CLOSE
      ENDIF '
   ELSEIF HIST(@AvgPrice,2) < HIST(@MedBodyPrice,0) AND HIST(@MedPrice,4) <= HIST(@AvgPrice,3) AND HIST(@MedBodyPrice,1) <= HIST(@AvgPrice,1)
      IF CLOSE>@ENTRYPRICE
         SELL CLOSE
      ENDIF
  ENDIF
  'TIME EXIT
  IF ORDEROPENFOR>#HOLD AND CLOSE<@ENTRYPRICE
     SELL CLOSE
  ENDIF
NEXT
—Updata support team
support@updata.co.uk
www.updata.co.uk
BACK TO LIST

AIQ: AUGUST 2017
The AIQ code based on Domenico D’Errico and Giovanni Trombetta’s article in this issue, “System Development Using Artificial Intelligence,” is shown here and is also available from www.TradersEdgeSystems.com/traderstips.htm.
!ARTIFICAL INTELLIGENCE FOR SYSTEM DEVELOPMENT
!Authors: Domenico D'Errico & Giovanni Trombetta, TASC August 2017
!Coded by: Richard Denning, 6/08/2017
!www.TradersEdgeSystems.com

!INPUTS:
O is [open].
C is [close].
H is [high].
L is [low].
exitBars is 8.
exitBarsP is 6.
enterGap is -0.08.

!CODE:
AvgP is (O+C+H+L)/4.
MedP is (H+L)/2.
MedB is (O+C)/2.

AvgP1 is valresult(AvgP,1).
AvgP2 is valresult(AvgP,2).
AvgP3 is valresult(AvgP,3).

MedP1 is valresult(MedP,1).
MedP2 is valresult(MedP,2).
MedP3 is valresult(MedP,3).
MedP4 is valresult(MedP,4).

MedB1 is valresult(MedB,1).
MedB2 is valresult(MedB,2).
MedB3 is valresult(MedB,3).
MedB4 is valresult(MedB,4).

!ENTRY & EXIT RULESl
Gandalf if
	 (AvgP1<MedP1 and
	 Medp2<=AvgP1 and
	 MedB2<=AvgP3)
	or
	 (AvgP1<MedP3 and
	 MedB<MedP2 and
	 MedB1<MedB2).

ExitGandalf if
	 (AvgP1<MedB1 and
	 MedP2=MedB3 and
	 MedB1<=MedB4)
	or
	 (AvgP2<MedB and
	 MedP4<=AvgP3 and
	 MedB1<=AvgP1)
	or
	 (AvgP2<MedB and
	 MedP4<=AvgP3 and
	 MedB1<=AvgP1).

Exit if (ExitGandalf and (C-{position entry price}<0) and {position days}<>exitBars-1)
	or ({position days}>=exitBars-1)
	or ({position days}>=exitBarsP-1 and (C-{position entry price}>0)).

EntryPr is min(val([low],1) + enterGap,[open]).

Buy if Gandalf and [low] <= EntryPr.
See Figure 10 for how to set up the pricing in a backtest.

FIGURE 10: AIQ. This shows the EDS backtest settings for entry pricing.
Again, the code and EDS file can be downloaded from www.TradersEdgeSystems.com/traderstips.htm.
—Richard Denning
info@TradersEdgeSystems.com
for AIQ Systems
BACK TO LIST

TRADERSSTUDIO: AUGUST 2017
The TradersStudio code based on Domenico D’Errico and Giovanni Trombetta’s article in this issue, “System Development Using Artificial Intelligence,” can be found at www.TradersEdgeSystems.com/traderstips.htm.
The TradersStudio code is shown here:
'ARTIFICAL INTELLIGENCE FOR SYSTEM DEVELOPMENT
'Authors: Domenico D'Errico & Giovanni Trombetta, TASC August 2017
'Coded by: Richard Denning, 6/16/2017
'www.TradersEdgeSystems.com

Sub AI(exitBars,exitBarsP,enterGap)
'defaults:
'exitBars = 8
'exitBarsP = 6
'enterGap = -0.08

Dim AvgP As BarArray
Dim MedP As BarArray
Dim MedB As BarArray
Dim AvgP1, AvgP2, AvgP3
Dim MedP1, MedP2, MedP3, MedP4
Dim MedB1, MedB2, MedB3, MedB4

AvgP = (O+C+H+L)/4
MedP = (H+L)/2
MedB = (O+C)/2

AvgP1 =  AvgP[1]
AvgP2 =  AvgP[2]
AvgP3 =  AvgP[3]

MedP1 =  MedP[1]
MedP2 =  MedP[2]
MedP3 =  MedP[3]
MedP4 =  MedP[4]

MedB1 =  MedB[1]
MedB2 =  MedB[2]
MedB3 =  MedB[3]
MedB4 =  MedB[4]

'ENTRY & Exit RULES:
Dim Gandalf1 As Boolean
Dim Gandalf2 As Boolean
Dim ExitGandalf1 As Boolean
Dim ExitGandalf2 As Boolean
Dim ExitGandalf3 As Boolean
Dim Exit1 As Boolean
Dim Exit2 As Boolean
Dim Exit3 As Boolean

Dim EntryPr
Gandalf1 = (AvgP1<MedP1 And MedP2<=AvgP1 And MedB2<=AvgP3)
Gandalf2 = (AvgP1<MedP3 And MedB<MedP2 And MedB1<MedB2)

ExitGandalf1 = (AvgP1<MedB1 And MedP2=MedB3 And MedB1<=MedB4)
ExitGandalf2 = (AvgP2<MedB And MedP4<=AvgP3 And MedB1<=AvgP1)
ExitGandalf3 = (AvgP2<MedB And MedP4<=AvgP3 And MedB1<=AvgP1)

Exit1 = ((ExitGandalf1 Or ExitGandalf2 Or ExitGandalf3) And (C-EntryPrice<0) And BarsSinceEntry<>exitBars-1)
Exit2 = (BarsSinceEntry>=exitBars-1)
Exit3 = (BarsSinceEntry>=exitBarsP-1 And (C-EntryPrice>0))

EntryPr = Min(L[1] + enterGap, Open)

If (Gandalf1 Or Gandalf2) Then Buy("LE",1,EntryPr,Limit,Day)
If Exit1 Then ExitLong("GandalfExit","",1,0,Market,Day)
If Exit2 Then ExitLong("Time","",1,O,Market,Day)
If Exit3 Then ExitLong("ProfitTime","",1,0,Market,Day)

End Sub
—Richard Denning
info@TradersEdgeSystems.com
for TradersStudio
BACK TO LIST

TRADE NAVIGATOR: AUGUST 2017
We’re making available a file for download within the Trade Navigator library to make it easy for users to implement the strategy discussed in “System Development Using Artificial Intelligence” by Domenico D’Errico and Giovanni Trombetta in this issue. The filename is “SC201708.” To download it, click on Trade Navigator’s blue telephone button, select download special file, and replace the word “upgrade” with “SC201708” (without the quotes). Then click the start button. When prompted to upgrade, click the yes button. If prompted to close all software, click on the continue button. Your library will now download.
This library contains a strategy called “Gandalf Project Research System” based on the article. This prebuilt strategy can be overlaid onto your chart by opening the charting dropdown menu, selecting the add to chart command, then selecting the strategies tab.
The library also contains a highlight bar function called the AI pattern. This highlight bar can be inserted into your chart by opening the charting dropdown menu, selecting the add to chart command, then selecting the highlight bars tab.
The TradeSense code for the highlight bar is shown in Figure 11.
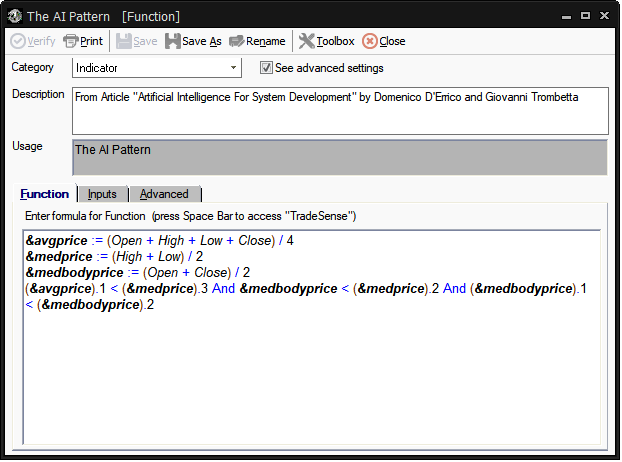
FIGURE 11: TRADE NAVIGATOR. TradeSense code for implementing the strategy is shown.
To recreate this indicator manually, click on the edit dropdown menu, open the trader’s toolbox (or use CTRL + T) and click on the functions tab. Next, click on the new button, and a new function dialog window will open. In its text box, input the code for the highlight bar. Ensure that there are no extra spaces at the end of each line. When completed, click on the verify button. You may be presented with an add inputs pop-up message if there are variables in the code. If so, click the yes button, then enter a value in the default value column. If all is well, when you click on the function tab, the code you entered will convert to italic font. Click on the save button and type a name for the highlight bar.
Users may contact our technical support staff by phone or by live chat if any assistance is needed in using the indicators or strategy.
A sample chart implementing the strategy is shown in Figure 12.
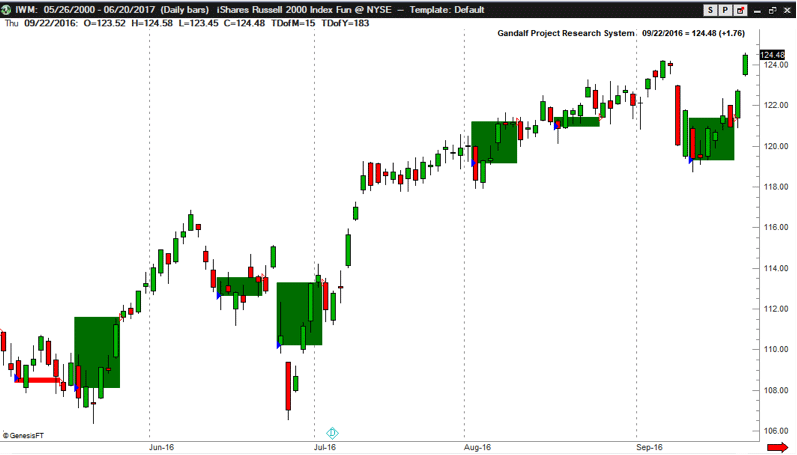
FIGURE 12: TRADE NAVIGATOR. Here, strategy entry/exit points are displayed on a daily chart with profit/loss shading.
—Genesis Financial Technologies
Tech support 719 884-0245
www.TradeNavigator.com
BACK TO LIST
Originally published in the August 2017 issue of
Technical Analysis of STOCKS & COMMODITIES magazine.
All rights reserved. © Copyright 2017, Technical Analysis, Inc.


