TRADERS’ TIPS
September 2017

For this month’s Traders’ Tips, the focus is John Ehlers’ article
in this issue, “The Reverse EMA Indicator.” Here, we present
the September 2017 Traders’ Tips code with possible implementations
in various software.
The Traders’ Tips section is provided to help the reader implement
a selected technique from an article in this issue or another recent issue.
The entries here are contributed by software developers or programmers for
software that is capable of customization.

TRADESTATION: SEPTEMBER 2017
In “The Reverse EMA Indicator” in this issue, author John Ehlers presents
a causal forward and backward EMA indicator that can be used in real trading.
It has double smoothing at the high end of the spectrum to reduce aliased components
and is able to mitigate the impact of spectral dilation at the low end. The
author describes the indicator as having unique flexibility in that it can
display trend or cycle information by varying the alpha parameter and do this
with very low lag.
Here, we are providing a function for calculating the reverse EMA that you
can use in your own code. In addition, we have provided an example strategy
and a demonstration indicator.
Function: _ReverseEMA

{
Adapted from
Reverse EMA Indicator
(C) 2017 John F. Ehlers
TASC Sep 2017
}

Inputs:
	AA( numericsimple ) ;
Vars:
	CC( 0 ),EMA( 0 ),RE1( 0 ),RE2( 0 ),
	RE3( 0 ),RE4( 0 ),RE5( 0 ),RE6( 0 ),
	RE7( 0 ),RE8( 0 ),Wave( 0 ) ;

//Classic EMA
CC = 1 - AA ;
EMA = AA * Close + CC * EMA[1] ;

//Compute Reverse EMA
RE1 = CC * EMA + EMA[1] ;
RE2 = Power( CC, 2 ) * RE1 + RE1[1] ;
RE3 = Power( CC, 4 ) * RE2 + RE2[1] ;
RE4 = Power( CC, 8 ) * RE3 + RE3[1] ;
RE5 = Power( CC, 16 ) * RE4 + RE4[1] ;
RE6 = Power( CC, 32 ) * RE5 + RE5[1] ;
RE7 = Power( CC, 64 ) * RE6 + RE6[1] ;
RE8 = Power( CC, 128 ) * RE7 + RE7[1] ;
//Indicator as difference
Wave = EMA - AA * RE8 ;

_ReverseEMA = Wave ;


Strategy: ReverseEMA

{
Reverse EMA Strategy
(C) 2017 John F. Ehlers
TASC Sep 2017
}

inputs:
	Trend( .05 ),
	Cycle( .3 ) ;
variables:
	CycleRevEMA( 0 ),
	TrendRevEMA( 0 ) ;

TrendRevEMA = _ReverseEMA( Trend ) ;
CycleRevEMA = _ReverseEMA( Cycle ) ;

if TrendRevEMA > 0 and
	CycleRevEMA crosses over 0 then
	Buy next bar at Market ;

if TrendRevEMA crosses under 0 or
	CycleRevEMA crosses under 0 then
	Sell next bar at market ;

if TrendRevEMA < 0 and
	CycleRevEMA crosses under 0 then
	Sell Short next bar at Market ;

if TrendRevEMA crosses over 0
	or CycleRevEMA crosses over 0 then
	Buy to cover next bar at market ;


Indicator: ReverseEMA

{
Reverse EMA Indicator
(C) 2017 John F. Ehlers
TASC Sep 2017
}

inputs:
	Trend( .05 ),
	Cycle( .3 ) ;
variables:
	CycleRevEMA( 0 ),
	TrendRevEMA( 0 ),
	AvgTrend( 0 ) ;

TrendRevEMA = _ReverseEMA( Trend ) ;
CycleRevEMA = _ReverseEMA( Cycle ) ;

AvgTrend = Average( TrendRevEMA, 10 ) ;


Plot1( TrendRevEMA, "Trend", Green ) ;
Plot2( CycleRevEMA, "Cycle", Red ) ;
Plot3( 0, "ZL", Blue ) ;
To download the EasyLanguage code, please visit our TradeStation and EasyLanguage
support forum. The files for this article can be found at https://community.tradestation.com/Discussions/Topic.aspx?Topic_ID=142776.
The filename is “TASC_SEP2017.ZIP.”
For more information about EasyLanguage in general, please see https://www.tradestation.com/EL-FAQ.
A sample chart is shown in Figure 1.

FIGURE 1: TRADESTATION. This shows
a TradeStation daily chart of GLD with the reverse EMA strategy and indicator
applied.
This article is for informational purposes. No type of trading or investment
recommendation, advice, or strategy is being made, given, or in any manner
provided by TradeStation Securities or its affiliates.
—Doug McCrary
TradeStation Securities, Inc.
www.TradeStation.com
BACK TO LIST

METASTOCK: SEPTEMBER 2017
In “The Reverse EMA Indicator” in this issue, John Ehlers presents an oscillator
to identify cycles, momentum, or trend activity. The MetaStock formula for
implementing this indicator is shown here:
alpha:= 0.1;
ca:= 1-alpha;
ma:= (alpha * C) + (ca*PREV);
re1:= ca*ma + Ref(ma, -1);
re2:= Power(ca,2)*re1 + Ref(re1,-1);
re3:= Power(ca,4)*re2 + Ref(re2,-1);
re4:= Power(ca,8)*re3 + Ref(re3,-1);
re5:= Power(ca,16)*re4 + Ref(re4,-1);
re6:= Power(ca,32)*re5 + Ref(re5,-1);
re7:= Power(ca,64)*re6 + Ref(re6,-1);
re8:= Power(ca,128)*re7 + Ref(re7,-1);
ma - (alpha*re8);
0
—William Golson
MetaStock Technical Support
www.metastock.com
BACK TO LIST

ESIGNAL: SEPTEMBER 2017
For this month’s Traders’ Tip, we’ve provided the study Reverse_EMA.efs based
on the formula described in John Ehlers’ article in this issue, “The Reverse
EMA Indicator.” In the article, Ehlers presents an indicator based on the exponential
moving average (EMA) that minimizes lag inherent in the conventional version
of the indicator.
The study contains formula parameters that may be configured through the edit
chart window (right-click on the chart and select edit chart).
A sample chart is shown in Figure 2.

FIGURE 2: eSIGNAL. Here is an example
of the study plotted on a daily chart of SPY.
To discuss this study or download a complete copy of the formula code, please
visit the EFS library discussion board forum under the forums link from the
support menu at www.esignal.com or
visit our EFS KnowledgeBase at https://www.esignal.com/support/kb/efs/.
The eSignal formula script (EFS) is shown below.
/*********************************
Provided By:
eSignal (Copyright c eSignal), a division of Interactive Data
Corporation. 2016. All rights reserved. This sample eSignal
Formula Script (EFS) is for educational purposes only and may be
modified and saved under a new file name.  eSignal is not responsible
for the functionality once modified.  eSignal reserves the right
to modify and overwrite this EFS file with each new release.

Description:
    The Reverse EMA Indicator by John F. Ehlers

Version:            1.00  07/12/2017

Formula Parameters:                     Default:
Alpha                                   0.1


Notes:
The related article is copyrighted material. If you are not a subscriber
of Stocks & Commodities, please visit www.traders.com.

**********************************/

var fpArray = new Array();

function preMain(){
    setPriceStudy(false);

    var x=0;
    fpArray[x] = new FunctionParameter("Alpha", FunctionParameter.NUMBER);
	with(fpArray[x++]){
        setName("Alpha Value");
        setDefault(0.1);
        setLowerLimit(0);
        }
}

var bInit = false;
var bVersion = null;

var xClose = null;

var xEMA = null;
var xRevEMA = null;

function main (Alpha){
    if (bVersion == null) bVersion = verify();
    if (bVersion == false) return;

    var nLength = ((2 / Alpha) - 1) * 3;

    if (getCurrentBarCount() < nLength) return;

    if (getBarState() == BARSTATE_ALLBARS){
        bInit = false;
    }

    if (!bInit){
        xClose = close();

        xEMA = efsInternal("calc_EMA", Alpha, xClose);
        xRevEMA = efsInternal("calc_RevEMA", (1 - Alpha), 1, xEMA);

        var power = 2;

        for (var i = 0; i < 7; i++){
            xRevEMA = efsInternal("calc_RevEMA", (1 - Alpha), power, xRevEMA);
            power *= 2;

        }

        addBand(0, PS_DASH, 1, Color.grey, 1);

        bInit = true;
    }

    if (xRevEMA.getValue(0) != null){
        return (xEMA.getValue(0) - 0.1 * xRevEMA.getValue(0));
    }
}

function calc_EMA(nAA, xSeries){
    var nEMA_1 = ref(-1);
    if (nEMA_1 == null) nEMA_1 = 0;
    var nEMA = ((xSeries.getValue(0) - nEMA_1) * nAA) + nEMA_1;

    if (nEMA != null) return nEMA;
}

function calc_RevEMA(nCC, power, xSeries){
    if (xSeries.getValue(-1) == null) return;
    var nRevEMA = Math.pow(nCC, power) * xSeries.getValue(0) + xSeries.getValue(-1);

    if (nRevEMA != null) return nRevEMA;
}

function verify(){
    var b = false;
    if (getBuildNumber() < 779){
        drawTextAbsolute(5, 35, "This study requires version 10.6 or later.",
            Color.white, Color.blue, Text.RELATIVETOBOTTOM|Text.RELATIVETOLEFT|Text.BOLD|Text.LEFT,
            null, 13, "error");
        drawTextAbsolute(5, 20, "Click HERE to upgrade.@URL=https://www.esignal.com/download/default.asp",
            Color.white, Color.blue, Text.RELATIVETOBOTTOM|Text.RELATIVETOLEFT|Text.BOLD|Text.LEFT,
            null, 13, "upgrade");
        return b;
    }
    else
        b = true;

    return b;
}
—Eric Lippert
eSignal, an Interactive Data company
800 779-6555, www.eSignal.com
BACK TO LIST

WEALTH-LAB: SEPTEMBER 2017
Once again, John Ehlers, in his article in this issue, shares an universal
oscillator with features such as minimum lag and a single-input parameter that
lets it highlight cycle, momentum, and trend components.
To use the ReverseEMA indicator, first update your TASCIndicators library
to v2017.08 or later and then look under the TASC Magazine Indicators group.
You can plot the indicator on a chart or use it as an entry or exit condition
in a rule-based strategy without having to program any code yourself.
Get the companion strategy’s C# code by downloading it right from Wealth-Lab’s open
strategy dialog:
using System;
using System.Collections.Generic;
using System.Text;
using System.Drawing;
using WealthLab;
using WealthLab.Indicators;
using TASCIndicators;

namespace WealthLab.Strategies
{
	public class TASC201709 : WealthScript
	{
		private StrategyParameter paramAlpha;

		public TASC201709()
		{
			paramAlpha = CreateParameter("Alpha", 0.1, 0.05, 0.5, 0.05);
		}

		protected override void Execute()
		{
			var re = ReverseEMA.Series(Close, paramAlpha.Value);
			ChartPane rePane = CreatePane( 30,false,false );
			HideVolume();
			PlotSeries( rePane, re, Color.Red, LineStyle.Solid, 2);

			//RoofingFilter for comparison
			var rf = RoofingFilter.Series(Close);
			ChartPane rfPane = CreatePane( 25,false,false);
			PlotSeries( rfPane,rf,Color.DarkBlue,LineStyle.Solid,1);
		}
	}
}
A sample chart is shown in Figure 3.

FIGURE 3: WEALTH-LAB. Here, we
show application of the indicator to SPY in comparison to Ehlers’ RoofingFilter.
—Eugene (Gene Geren), Wealth-Lab team
MS123, LLC
www.wealth-lab.com
BACK TO LIST

AMIBROKER: SEPTEMBER 2017
In “The Reverse EMA Indicator” in this issue, author John Ehlers presents
very interesting filtering technique based on a Z-transform of the exponential
moving average.
A ready-to-use AmiBroker formula that implements the reverse EMA algorithm
is given here. To use it, enter the formula in the formula editor and press apply
indicator to create a chart such as the one shown in Figure 4, which replicates
a chart from Ehlers’ article. You can adjust the smoothing factor using the parameter window.
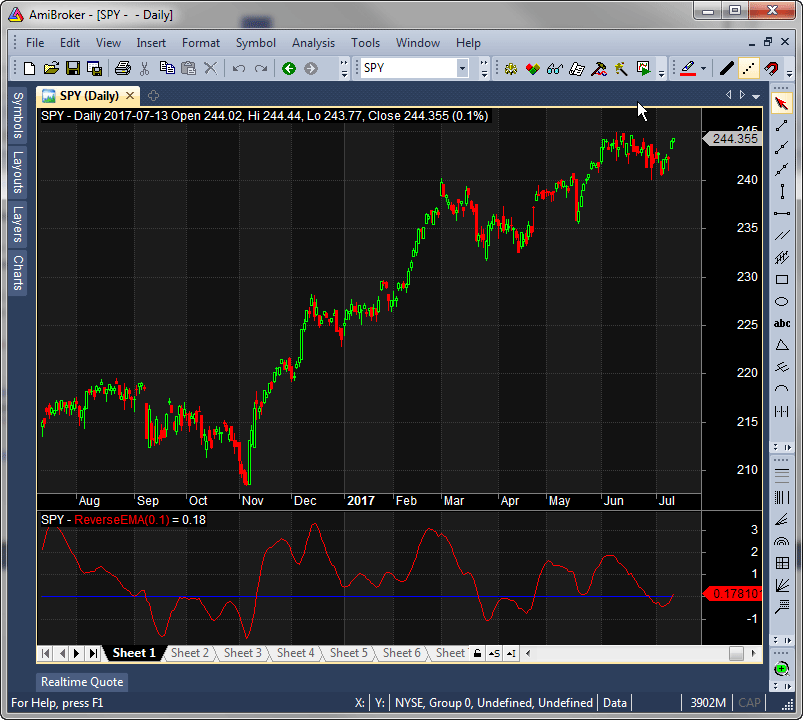
FIGURE 4: AMIBROKER. This daily
SPY chart (upper pane) with the reverse EMA in the lower pane replicates
a chart from John Ehlers’ article in this issue. The reverse EMA reflects
price turning points with little lag.
Amibroker Code
_SECTION_BEGIN("ReverseEMA");

function ReverseEMA( alpha )
{
    beta = 1 - alpha;
    re = eema = AMA( C, alpha );

    for( i = 1, p = 1; i <= 8; i++, p *= 2 )
       re = re * ( beta ^ p )  +   Ref( re, -1 );

    return eema - alpha * re;
}

alpha = Param("alpha", 0.1, 0.01, 0.99, 0.01 );
Plot( ReverseEMA( alpha ) , _DEFAULT_NAME(), colorRed );
Plot( 0, "", colorBlue, styleNoLabel );

_SECTION_END();
—Tomasz Janeczko, AmiBroker.com
www.amibroker.com
BACK TO LIST

NEUROSHELL TRADER: SEPTEMBER 2017
The reverse EMA indicator discussed in John Ehlers’ article in this issue,
“The Reverse EMA Indicator,” can be easily implemented in NeuroShell Trader
using NeuroShell Trader’s ability to call external dynamic linked libraries. Dynamic
linked libraries can be written in C, C++, and Power Basic.
After moving the EasyLanguage code given in Ehlers’ article to your preferred
compiler and creating a DLL, you can insert the resulting indicators as follows:
- Select new indicator from the insert menu
- Choose the External Program & Library Calls category
- Select the appropriate External DLL Call indicator
- Set up the parameters to match your DLL
- Select the finished button.
Similar filter-based and cycle-based strategies can also be created using
indicators found in John Ehlers’ Cybernetic and MESA91 NeuroShell
Trader Add-ons.
Users of NeuroShell Trader can go to the STOCKS & COMMODITIES section
of the NeuroShell Trader free technical support website to download a copy
of this or any previous Traders’ Tips.
A sample chart is shown in Figure 5.

FIGURE 5: NEUROSHELL TRADER. This
sample NeuroShell Trader chart shows the reverse EMA indicator.
—Marge Sherald, Ward Systems Group, Inc.
301 662-7950, sales@wardsystems.com
www.neuroshell.com
BACK TO LIST

TRADERSSTUDIO: SEPTEMBER 2017
The TradersStudio code I am presenting here is based on John Ehlers’ article
in this issue, “The Reverse EMA Indicator.”
The code will be available at www.TradersEdgeSystems.com/traderstips.htm and
is also shown here:
'THE REVERSE EMA INDICATOR, TASC Sept 2017
'Author: John Ehlers
'Coded by: Richard Denning, 7/12/17
'www.TradersEdgeSystems.ocm

Function EHLERS_REVERSE_EMA(AA)
 'AA = .1
    Dim CC
    Dim EMA As BarArray
    Dim RE1 As BarArray
    Dim RE2 As BarArray
    Dim RE3 As BarArray
    Dim RE4 As BarArray
    Dim RE5 As BarArray
    Dim RE6 As BarArray
    Dim RE7 As BarArray
    Dim RE8
    Dim Wave

    CC = 1 - AA
    EMA = AA*Close + CC*EMA[1]
    RE1 = CC*EMA + EMA[1]
    RE2 = (CC^2)*RE1 + RE1[1]
    RE3 = (CC^4)*RE2 + RE2[1]
    RE4 = (CC^8)*RE3 + RE3[1]
    RE5 = (CC^16)*RE4 + RE4[1]
    RE6 = (CC^32)*RE5 + RE5[1]
    RE7 = (CC^64)*RE6 + RE6[1]
    RE8 = (CC^128)*RE7 + RE7[1]
    Wave = EMA - AA*RE8
    EHLERS_REVERSE_EMA = Wave
End Function
The following code files are included in the download:
- Function EHLERS_REVERSE_EMA: A function that returns the values of the
reverse EMA indicator
- Indicator plot EHLERS_REVERSE_EMA_IND: An indicator plot that creates the
custom indicator.
Figure 6 shows the indicator on a chart of Apple Inc. for part of 2013 and
2014.

FIGURE 6: TRADERSSTUDIO. Shown
here is the reverse EMA indicator plotted on a chart of Apple Inc. for part
of 2013 and 2014.
—Richard Denning
info@TradersEdgeSystems.com
for TradersStudio
BACK TO LIST

UPDATA: SEPTEMBER 2017
The Traders’ Tip for this month is based on the article in this issue by John
Ehlers, “The Reverse EMA Indicator.” In the article, Ehlers proposes some refinements
to the classic exponential moving average (EMA), reverse-engineering the formula
to remove any lag, to create a causal forward and backward indicator that can
be used on real-time data.
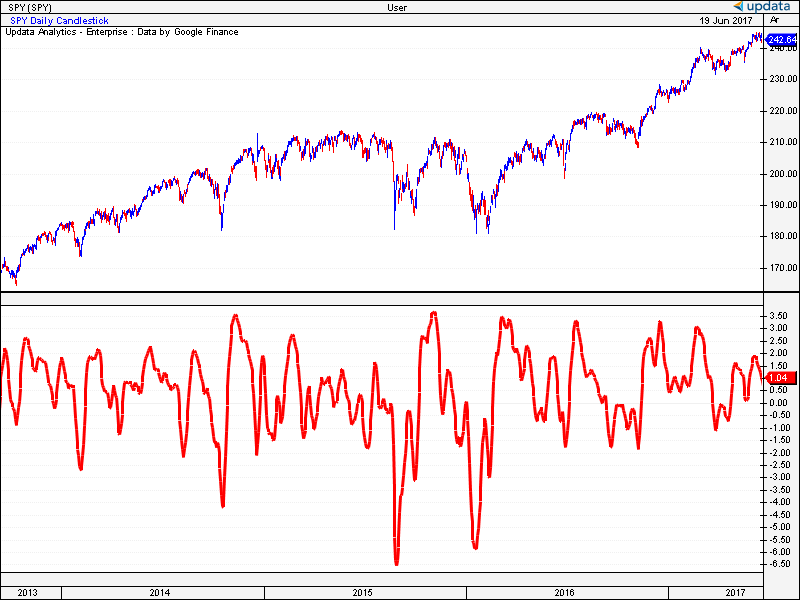
FIGURE 7: UPDATA. Here is the reverse-engineered
exponential moving average as applied to the SPY ETF in daily resolution
data.
The Updata code for this article is in the Updata library and may be downloaded
by clicking the custom menu and indicator library. Those
who cannot access the library due to a firewall may paste the code shown here
into the Updata custom editor and save it.
PARAMETER "AA" @AA=0.1
NAME "" ""
@CC=0
@EMA=0
@RE1=0
@RE2=0
@RE3=0
@RE4=0
@RE5=0
@RE6=0
@RE7=0
@RE8=0
@WAVE=0

FOR #CURDATE=0 TO #LASTDATE
   @CC=1-@AA
   @EMA=(@AA*CLOSE)+(@CC*HIST(@EMA,1))
   'COMPUTE REVERSE
   @RE1=(@CC*@EMA)+HIST(@EMA,1)
   @RE2=EXPBASE(@CC,2)*@RE1+HIST(@RE1,1)
   @RE3=EXPBASE(@CC,4)*@RE2+HIST(@RE2,1)
   @RE4=EXPBASE(@CC,8)*@RE3+HIST(@RE3,1)
   @RE5=EXPBASE(@CC,16)*@RE4+HIST(@RE4,1)
   @RE6=EXPBASE(@CC,32)*@RE5+HIST(@RE5,1)
   @RE7=EXPBASE(@CC,64)*@RE6+HIST(@RE6,1)
   @RE8=EXPBASE(@CC,128)*@RE7+HIST(@RE7,1)
   'INDICATOR AS DIFFERENCE
   @WAVE=@EMA-@AA*@RE8
   @PLOT=@WAVE
NEXT
—Updata support team
support@updata.co.uk
www.updata.co.uk
BACK TO LIST

TRADE NAVIGATOR: SEPTEMBER 2017
We’re making available a special file for download in the Trade Navigator
library to make it easy for users to implement the strategy discussed in “The
Reverse EMA Indicator” by John Ehlers in this issue. The filename is “SC201709.”
To download it, click on Trade Navigator’s blue telephone button, select download
special file, and replace the word “upgrade” with “SC201709” (without the quotes).
Then click the start button. When prompted to upgrade, click the yes button.
If prompted to close all software, click on the continue button. Your library
will now download. This library contains an indicator named “Reverse EMA.”
If you would like to recreate these indicators manually, click on the edit dropdown
menu, open the trader’s toolbox (or use CTRL + T) and click on the functions tab.
Next, click on the new button, and a new function dialog
window will open. In its text box, input the code for the highlight bar. Ensure
that there are no extra spaces at the end of each line. When completed, click
on the verify button. You may be presented with an add inputs pop-up
message if there are variables in the code. If so, click the yes button,
then enter a value in the default value column. If all is well, when
you click on the function tab, the code you entered will convert to
italic font. Click on the save button, and type a name for the indicator.
Once complete, you can insert these indicators onto your chart by opening
the charting dropdown menu, selecting the add to chart command,
then on the indicators tab, finding your named indicator, selecting
it, then clicking on the add button. Repeat this procedure for additional
indicators as well if you wish.
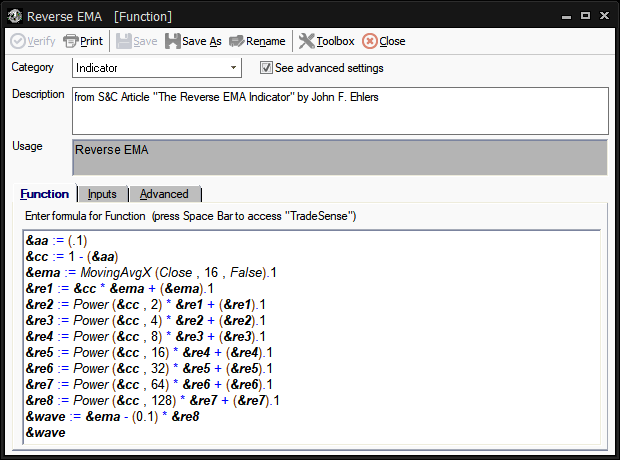
FIGURE 8: TRADE NAVIGATOR. TradeSense
code for the indicator is shown.
The TradeSense code for the indicator is shown in Figure 8. A sample chart
is shown in Figure 9.
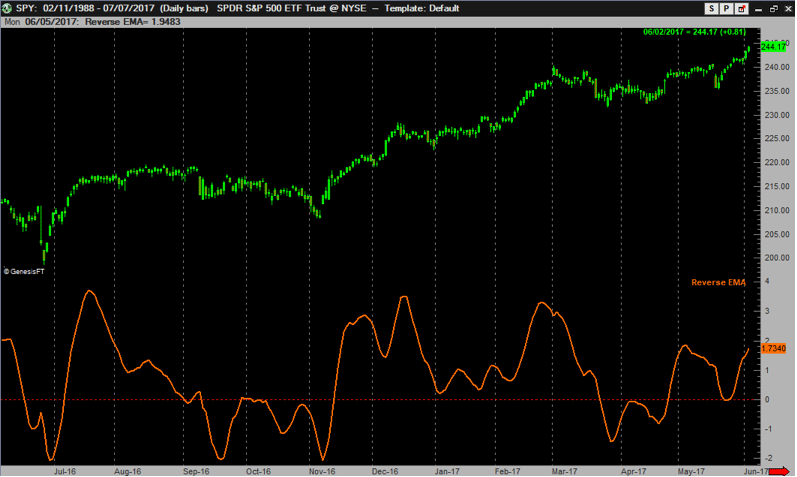
FIGURE 9: TRADE NAVIGATOR. Here,
the reverse EMA indicator is plotted on a daily chart.
Users may contact our technical support staff by phone or by live chat if
any assistance is needed in using the indicators or strategy.
—Genesis Financial Technologies
Tech support 719 884-0245
www.TradeNavigator.com
BACK TO LIST

NINJATRADER: SEPTEMBER 2017
The reverse EMA indicator, as discussed in “The Reverse EMA Indicator” in
this issue by John Ehlers, is available for download from the following links
for NinjaTrader 8 and for NinjaTrader 7:
Once the file is downloaded, you can import the indicator into NinjaTader
8 from within the control center by selecting Tools → Import → NinjaScript
Add-On and then selecting the downloaded file for NinjaTrader 8. To import
into NinjaTrader 7, from within the control center window, select the menu
File → Utilities → Import NinjaScript and select the downloaded file.
You can review the indicator’s source code in NinjaTrader 8 by selecting the
menu New → NinjaScript Editor → Indicators from within the control
center window and selecting the REMA file. You can review the indicator’s source
code in NinjaTrader 7 by selecting the menu Tools → Edit NinjaScript → Indicator
from within the control center window and selecting the REMA file.
NinjaScript uses compiled DLLs that run native, not interpreted, which provides
you with the highest performance possible.
A sample chart implementing the strategy is shown in Figure 10.

FIGURE 10: NINJATRADER. Here is
an example of the reverse EMA indicator on a daily SPY chart between June
2016 and July 2017 as displayed in Figure 1 of John Ehlers’ article in this
issue, “The Reverse EMA Indicator.”
—Raymond Deux & Jim Dooms
NinjaTrader, LLC
www.ninjatrader.com
BACK TO LIST
Originally published in the September 2017 issue of
Technical Analysis of STOCKS & COMMODITIES magazine.
All rights reserved. © Copyright 2017, Technical Analysis, Inc.


