TRADERS’ TIPS
November 2017
For this month’s Traders’ Tips, the focus is Ken Calhoun’s
article the October 2017 issue, “Swing Trading Four-Day Breakouts.” Here,
we present the November 2017 Traders’ Tips code with possible implementations
in various software.
The Traders’ Tips section is provided to help the reader implement
a selected technique from an article in this issue or another recent issue.
The entries here are contributed by software developers or programmers for
software that is capable of customization.

TRADESTATION: NOVEMBER
2017
In “Swing Trading Four-Day Breakouts,” which appeared in the October
2017 issue of S&C, author Ken Calhoun described a simple breakout pattern
where entry occurs after four daily green candles in a row have been observed.
According to the author, this pattern is effective because it buys into strong
momentum. In addition to describing the entry pattern, Calhoun also provides
some tips on trade management.
Here, we are providing some TradeStation EasyLanguage code for a complete
strategy based on the author’s ideas. We have also provided an indicator
that can be used in the TradeStation Scanner application to scan your favorite
symbol list for potential setups.
Indicator: FourDayBrkOut
// Swing Trading Four-Day Breakouts
// Ken Calhoun
// TASC Nov 2017

variables:
	Pattern( false ),
	NewPatternFound( false ),
	PatternBar( 0 ) ;

Pattern = Close > Open and
			Close[1] > Open[1] and
			Close[2] > Open[2] and
			Close[3] > Open[3] ;

NewPatternFound = Pattern and not Pattern[1] ;

if NewPatternFound then
	PatternBar = CurrentBar ;

Plot1( CurrentBar - PatternBar ) ;


Strategy: FourDayBrkOut
// Swing Trading Four-Day Breakouts
// Ken Calhoun
// TASC Nov 2017

inputs:
	BreakoutAmountAbove( .5 ),
	DollarsToTrade( 10000 ),
	MaxBarsToWaitToEnter( 2 ),
	TrailDollars( 2 ) ;
variables:
	Pattern( false ),
	NewPatternFound( false ),
	BuyStopPrice( 0 ),
	PatternBar( 0 ),
	SharesToBuy( 0 ) ;

Pattern = Close > Open and
		Close[1] > Open[1] and
		Close[2] > Open[2] and
		Close[3] > Open[3] ;

NewPatternFound = Pattern and not Pattern[1] ;

if NewPatternFound then
	begin
	BuyStopPrice = Highest( High, 4 )
		+ BreakoutAmountAbove ;
	PatternBar = CurrentBar ;
	SharesToBuy = DollarsToTrade / BuyStopPrice ;
	end ;

if CurrentBar - PatternBar < MaxBarsToWaitToEnter then
	Buy SharesToBuy shares next bar
		at BuyStopPrice Stop ;


SetStopShare ;
SetDollarTrailing( TrailDollars ) ;
To download the EasyLanguage code, please visit our TradeStation and EasyLanguage
support forum. The files for this article can be found here: https://community.tradestation.com/Discussions/Topic.aspx?Topic_ID=142776.
The filename is “TASC_NOV2017.ELD.”
For more information about EasyLanguage in general, please see https://www.tradestation.com/EL-FAQ.
A sample chart is shown in Figure 1.
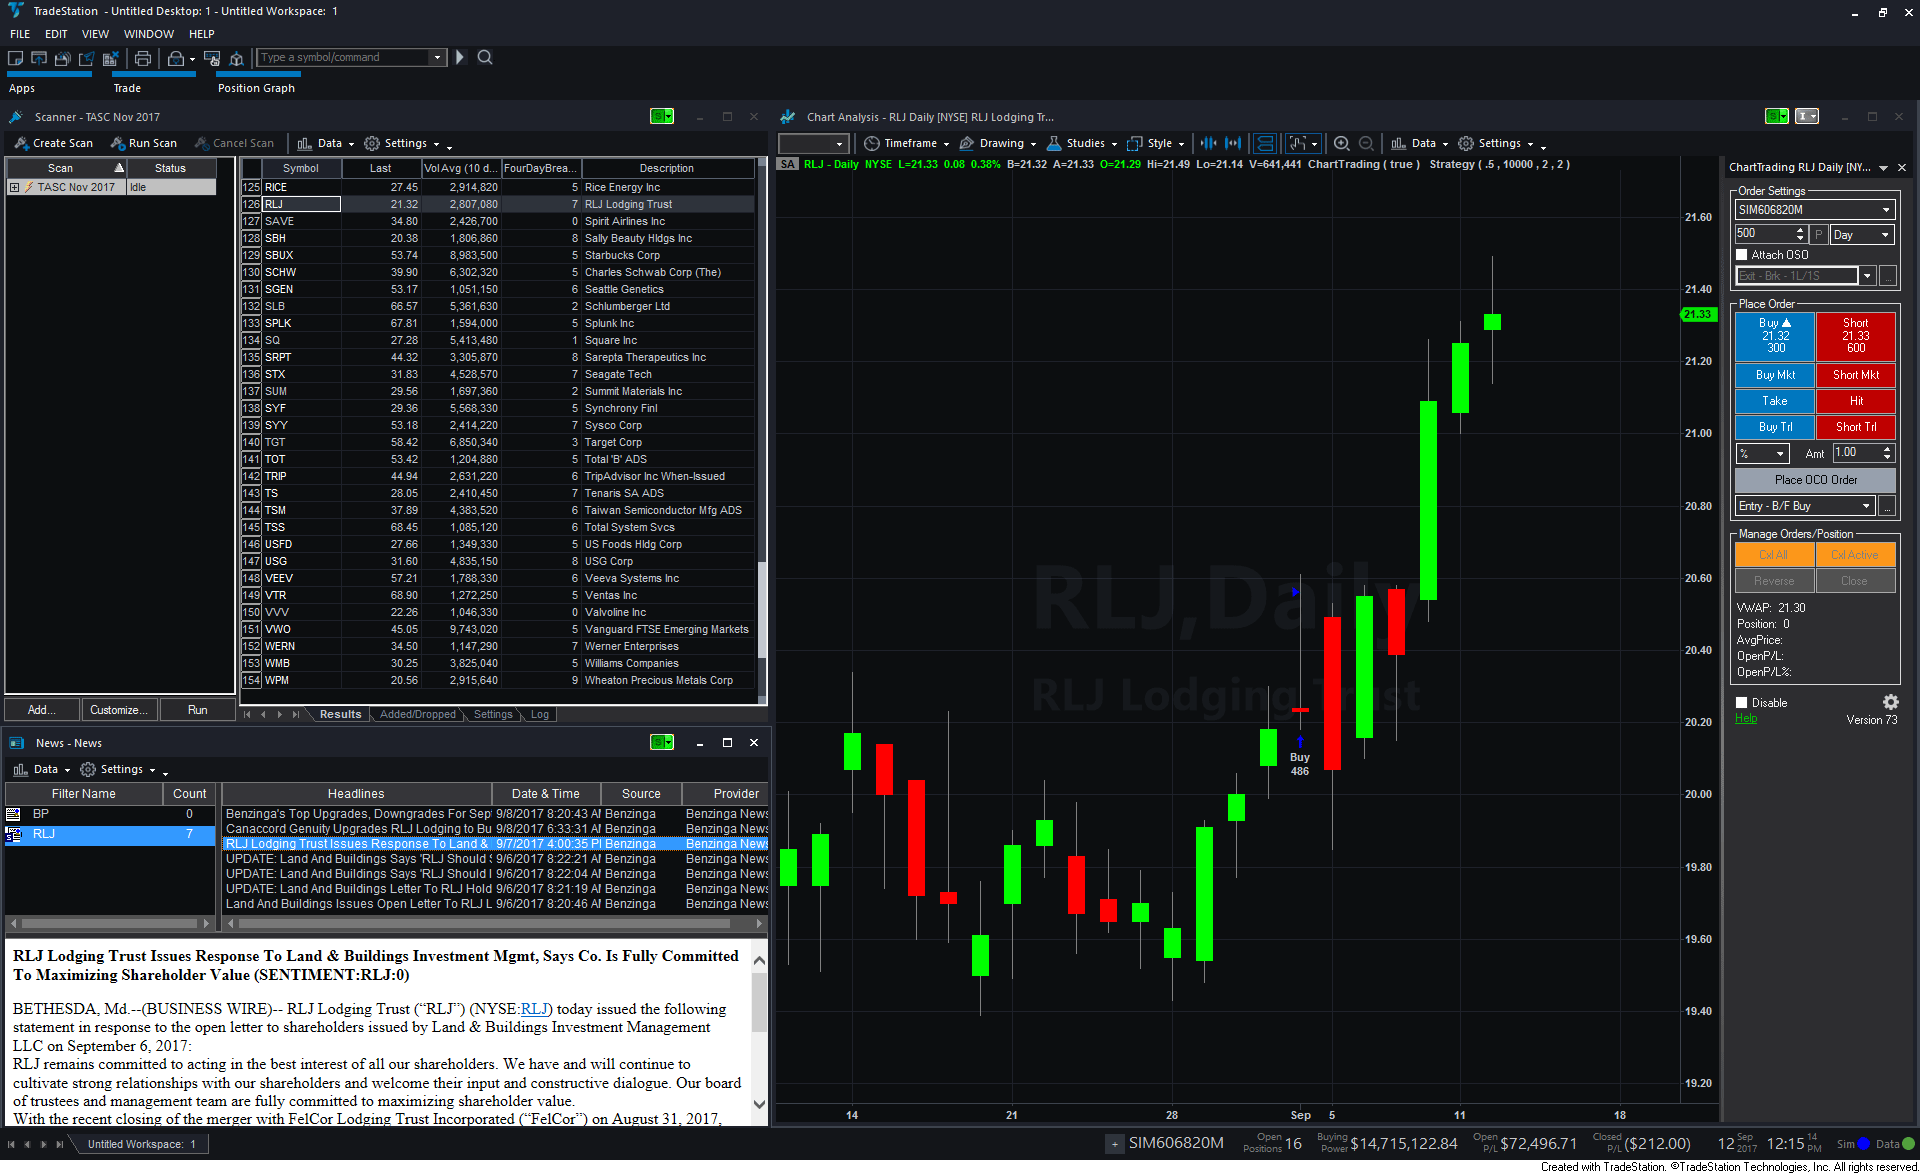
FIGURE 1: TRADESTATION. A TradeStation
Scanner results screen is shown here and a daily chart of RLJ with the strategy
applied.
This article is for informational purposes. No type of trading or investment
recommendation, advice, or strategy is being made, given, or in any manner
provided by TradeStation Securities or its affiliates.
—Doug McCrary
TradeStation Securities, Inc.
www.TradeStation.com
BACK TO LIST

METASTOCK: NOVEMBER 2017
Ken Calhoun’s article from the October 2017 issue of S&C, “Swing
Trading Four-Day Breakouts,” introduced a simple pattern to buy into
market strength. The MetaStock formula for an exploration to find that pattern
is shown here.
trendlength:= 20;
uptrend:= Sum(
C > Mov(C, 50, S) AND
C > Mov(C, 100, S) AND
C > Mov(C, 200, S), trendlength) = trendlength;
Sum( C > O, 4) = 4 AND uptrend
The formula requires the prices to be above the 50-, 100-, and 200-period
simple moving averages to qualify as being in an uptrend. The first line specifies
the uptrend has to have existed over the last 20 bars. You can adjust that
value by increasing or decreasing the number as you desire. Larger values will
be more restrictive but they return stocks with more established uptrends.
—William Golson
MetaStock Technical Support
www.metastock.com
BACK TO LIST

eSIGNAL: NOVEMBER 2017
For this month’s Traders’ Tip, we’re providing the study
4Day_Breakouts.efs based on the breakout trading strategy described in Ken
Calhoun’s article in the October 2017 issue of S&C, “Swing
Trading Four-Day Breakouts.”
The study contains formula parameters that may be configured through the edit
chart window (right-click on the chart and select edit chart).
A sample chart is shown in Figure 2.

FIGURE 2: eSIGNAL. Here is an example
of the study plotted on a daily chart of Weight Watchers International (WTW).
To discuss this study or download a complete copy of the formula code, please
visit the EFS library discussion board forum under the forums link from the
support menu at www.esignal.com or
visit our EFS KnowledgeBase at https://www.esignal.com/support/kb/efs/.
The eSignal formula script (EFS) is also available for copying & pasting
below.
/*********************************
Provided By:
eSignal (Copyright c eSignal), a division of Interactive Data
Corporation. 2016. All rights reserved. This sample eSignal
Formula Script (EFS) is for educational purposes only and may be
modified and saved under a new file name.  eSignal is not responsible
for the functionality once modified.  eSignal reserves the right
to modify and overwrite this EFS file with each new release.

Description:
    Swing Trading Four-Day Breakouts by Ken Calhoun

Version:            1.00  09/12/2017

Formula Parameters:                     Default:
Trigger                                 0.5
Initial Stop                            2


Notes:
The related article is copyrighted material. If you are not a subscriber
of Stocks & Commodities, please visit www.traders.com.

**********************************/

var fpArray = new Array();

function preMain(){
    setPriceStudy(true);
    setShowCursorLabel(false);
    setDefaultBarFgColor(Color.black);

    var x = 0;
    fpArray[x] = new FunctionParameter("Trigger", FunctionParameter.NUMBER);
	with(fpArray[x++]){
        setLowerLimit(0.000001);
        setDefault(0.5);
        setName("Trigger");
    }
    fpArray[x] = new FunctionParameter("InitStop", FunctionParameter.NUMBER);
	with(fpArray[x++]){
        setLowerLimit(0.000001);
        setDefault(2);
        setName("Initial Stop");
    }
}

var bInit = false;
var bVersion = null;
var xHigh = null;
var xLow = null;
var xOpen = null;
var xClose = null;

var bSeqFound = false;
var bIsLong = false;
var vStopPrice = null;
var vHighestHigh = null;
var nEntryPrice = null;

var nRedBarCount = 1;
var sReturnVal = " ";

function main(Trigger, InitStop){
    if (bVersion == null) bVersion = verify();
    if (bVersion == false) return;

    if (getBarState() == BARSTATE_ALLBARS){

        bInit = false;
    }

    if (!bInit){
        nRedBarCount = 1;
        bSeqFound = false;
        bIsLong = false;
        vStopPrice = null;
        vHighestHigh = null;
        nEntryPrice = null;
        sReturnVal = " ";
        xLow = low();
        xHigh = high();
        xOpen = open();
        xClose = close();
        bInit = true;
    }

    var nHigh = xHigh.getValue(0);
    var nLow = xLow.getValue(0);

    if (getBarState() == BARSTATE_NEWBAR){

        if ( xClose.getValue(-1) < xOpen.getValue(-1) )
            nRedBarCount++;

        if (xClose.getValue(-1) > xOpen.getValue(-1) &&
            xClose.getValue(-2) > xOpen.getValue(-2) &&
            xClose.getValue(-3) > xOpen.getValue(-3) &&
            xClose.getValue(-4) > xOpen.getValue(-4) &&

            xHigh.getValue(-1) > xHigh.getValue(-2) &&
            xHigh.getValue(-2) > xHigh.getValue(-3) &&
            xHigh.getValue(-3) > xHigh.getValue(-4) &&

            nRedBarCount > 0){
                var cBoxColor = Color.green;

                if (!bIsLong){

                    bSeqFound = true;
                    nEntryPrice = xHigh.getValue(-1);

                    drawTextRelative(0, BottomRow1, "Suggested Long Entry at " + formatPriceNumber(nEntryPrice + Trigger), Color.green, null,
                                        Text.PRESET|Text.LEFT|Text.BOLD, "Arial", 8, "Entry text"+rawtime(0));

                    sReturnVal = "Suggested Long at " + formatPriceNumber(nEntryPrice + Trigger);
                }
                else cBoxColor = Color.RGB(101,209,112);

                nRedBarCount = 0;
                var nLowest = llv(4, xLow).getValue(-1);
                var nHighest = xHigh.getValue(-1);
                drawLineRelative(-4, nHighest, -1, nHighest, PS_DOT, 2, cBoxColor, "lineH"+rawtime(0));
                drawLineRelative(-4, nLowest, -1, nLowest, PS_DOT, 2, cBoxColor, "lineL"+rawtime(0));
                drawLineRelative(-4, nHighest, -4, nLowest, PS_DOT, 2,cBoxColor, "line1V"+rawtime(0));
                drawLineRelative(-1, nHighest, -1, nLowest, PS_DOT, 2, cBoxColor, "line2V"+rawtime(0));
            }
    }

     if (bIsLong){
        if (nHigh > vHighestHigh && (nLow - InitStop) > vStopPrice) {
            vStopPrice = (nLow - InitStop);
            vHighestHigh = nHigh
        }
        else if (nLow <= vStopPrice){
            drawTextRelative(0, AboveBar1, "\u00EA", Color.red, null, Text.PRESET|Text.CENTER, "Wingdings", 10, "Exit"+rawtime(0));
            drawTextRelative(0, TopRow1, "Suggested Long Exit at "+formatPriceNumber(vStopPrice), Color.red, null,
                            Text.PRESET|Text.LEFT|Text.BOLD, "Arial", 8, "Exit text"+rawtime(0));
            bIsLong = false;
            bSeqFound = false;
            nRedBarCount = 1;
            sReturnVal = " ";
        }
    }

    if (bSeqFound && !bIsLong && nHigh >= nEntryPrice + Trigger){
        drawTextRelative(0, BelowBar1, "\u00E9", Color.green, null, Text.PRESET|Text.CENTER, "Wingdings", 10, "Entry"+rawtime(0));

        bSeqFound = false;
        bIsLong = true;
        vStopPrice = (nLow - InitStop);
        vHighestHigh = nHigh;
        sReturnVal = " ";
    }

    if (isWatchList()){
        if (sReturnVal != " ") setBarBgColor(Color.RGB(157,255,162));

        return sReturnVal;
    }

}


function verify(){
    var b = false;
    if (getBuildNumber() < 779){

        drawTextAbsolute(5, 35, "This study requires version 10.6 or later.",
            Color.white, Color.blue, Text.RELATIVETOBOTTOM|Text.RELATIVETOLEFT|Text.BOLD|Text.LEFT,
            null, 13, "error");
        drawTextAbsolute(5, 20, "Click HERE to upgrade.@URL=https://www.esignal.com/download/default.asp",
            Color.white, Color.blue, Text.RELATIVETOBOTTOM|Text.RELATIVETOLEFT|Text.BOLD|Text.LEFT,
            null, 13, "upgrade");
        return b;
    }
    else
        b = true;

    return b;
}
—Eric Lippert
eSignal, an Interactive Data company
800 779-6555, www.eSignal.com
BACK TO LIST

WEALTH-LAB: NOVEMBER 2017
I was busy with some programming projects when the article for this month’s
Traders’ Tips column arrived in my inbox (“Swing Trading Four-Day
Breakouts,” October 2017 S&C). Since the trading idea that author
Kent Calhoun spells out in the article looked so simple, it was a pleasure
to take a break from coding and show our users how to get it done by example—this
time without the need to write any code.
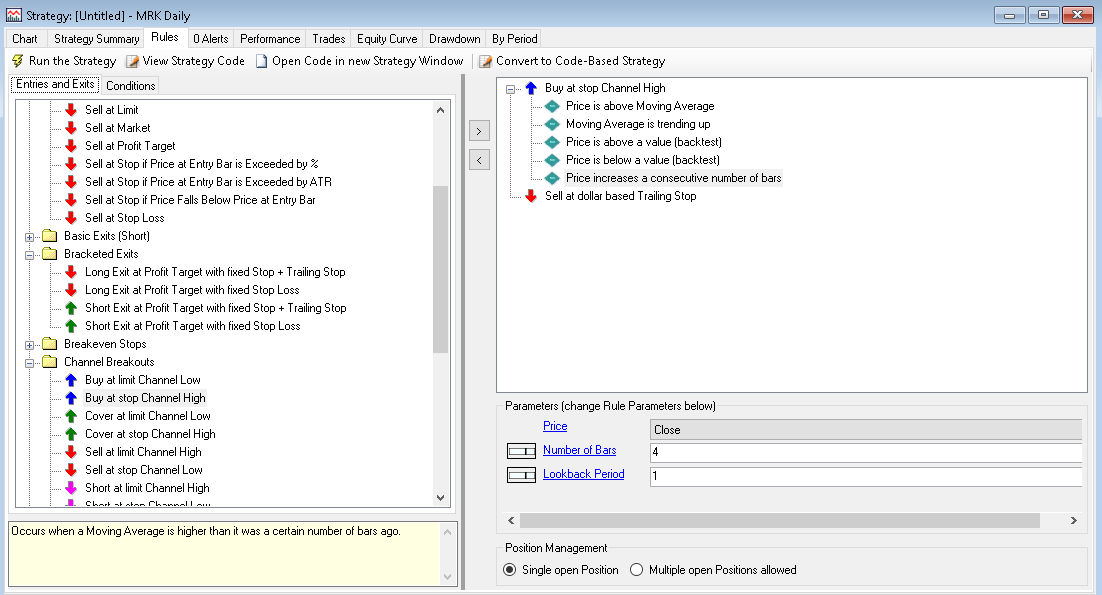
FIGURE 3: WEALTH-LAB. This demonstrates
setting up “strategy from rules” for the swing trading pattern.
Wealth-Lab’s Strategy From Rules feature allows you to produce
a complete trading strategy from building blocks known as rules. To
start, either choose New strategy from rules or strike Ctrl-Shift-R.
First, drag the buy at stop channel high entry and set channel
period to 4. As a quick approximation, this should buy at stop next bar
if the price simply exceeds the four-day highest close.
Next, add required conditions. Adding price above (below) a value (backtest) from price
(or volume) action with $20 and $70 as the parameters (respectively)
will set the desired price range. The multitude of rules allows
you to choose your own definition of “uptrend.” I’m going
to stick with a plain vanilla one and throw in price is above moving
average, setting the MA lookback period to “50-day.” To
make my trend detection more robust I pair it with moving average is
trending up from the moving average group, choose 50-day as the SMA
period again, and set lookback period to 10. This means that
the moving average itself must be higher than it was 10 bars ago—which
typically happens in established uptrends.
Time to drag and drop the core condition: “Price increases a consecutive
number of bars.” To catch four or more green candles, choose settings
as shown in Figure 3: Price = Close, Number of bars = 4, and Lookback
period = 1 (this is what makes them consecutive). Finally, I drag “Sell
at dollar-based trailing stop,” but you’re free to choose from
volatility stops, percent-based stops, channel exits, parabolic exits, or different
profit target and stop-losses.
Our walkthough took only a couple of minutes and a pleasing end result can
be seen in Figure 4.
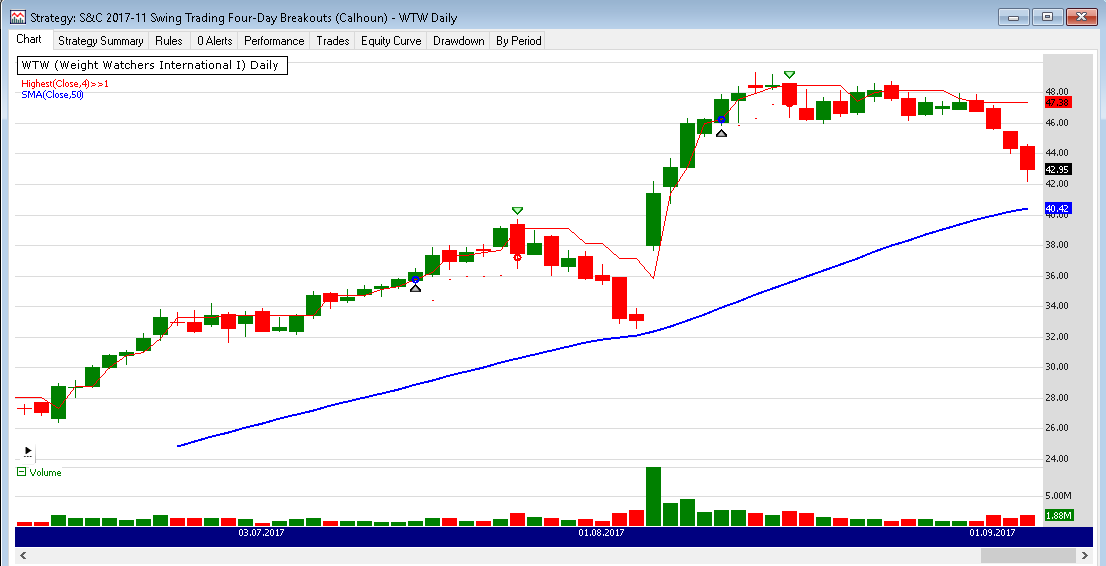
FIGURE 4: WEALTH-LAB. Here’s
an example application of the strategy to Weight Watchers International (WTW).
—Eugene (Gene Geren), Wealth-Lab team
MS123, LLC
www.wealth-lab.com
BACK TO LIST

NEUROSHELL TRADER: NOVEMBER 2017
The swing trading four-day breakouts system as described by Ken Calhoun in
his article that appeared in the October 2017 issue of S&C, “Swing
Trading Four-Day Breakouts,” can be easily implemented in NeuroShell
Trader. Simply select new trading strategy from the insert menu
and enter the following in the appropriate locations of the trading strategy
wizard:
BUY LONG CONDITIONS: [All of which must be true]
     A<B<C(20,Close,70)
     A>B(LinTimeReg Slope(Close,100),0)
     A=B(Sum(White Body(Open,High,Low,Close),4),4)

STOP PRICE:
     Add2(High,0.5)

LONG TRAILING STOP PRICES:
     TrailPricePnts(Trading Strategy,2)
If you have NeuroShell Trader Professional, you can also choose whether the
parameters should be optimized. After backtesting the trading strategy, use
the detailed analysis button to view the backtest and trade-by-trade
statistics for the strategy.
To scan a large number of ticker symbols for potential four-day breakout signals,
select scan ticker symbols from the file menu and enter the
entry conditions of the trading systems above as the scan criteria. Once the
scan is finished, it can be saved for future use by simply pressing the save
as template button.
Users of NeuroShell Trader can go to the STOCKS & COMMODITIES section
of the NeuroShell Trader free technical support website to download a copy
of this or any previous Traders’ Tips.
A sample chart is shown in Figure 5.

FIGURE 5: NEUROSHELL TRADER. This
NeuroShell Trader chart displays the swing trading four-day breakout system
for Weight Watchers International (WTW).
—Marge Sherald, Ward Systems Group, Inc.
301 662-7950, sales@wardsystems.com
www.neuroshell.com
BACK TO LIST

AMIBROKER: NOVEMBER 2017
In “Swing Trading Four-Day Breakouts,” which appeared in the October
2017 issue of S&C, author Ken Calhoun presents a simple, visual method
for trading that involves four-day breakouts.
The author proposes to visually scan charts to find setups. But given today’s
computer capabilities, we would rather use computers to do the job for us.
The code listing here shows a ready-to-use formula that can scan all stocks
traded on US markets in a matter of seconds to find all four-day up candle
breakouts. To scan the market, enter the code in the AmiBroker formula editor
and use the exploration feature in the analysis window. The
same formula also produces a chart where all four consecutive up candle patterns
followed by breakouts are marked with arrows. (See Figure 6.)
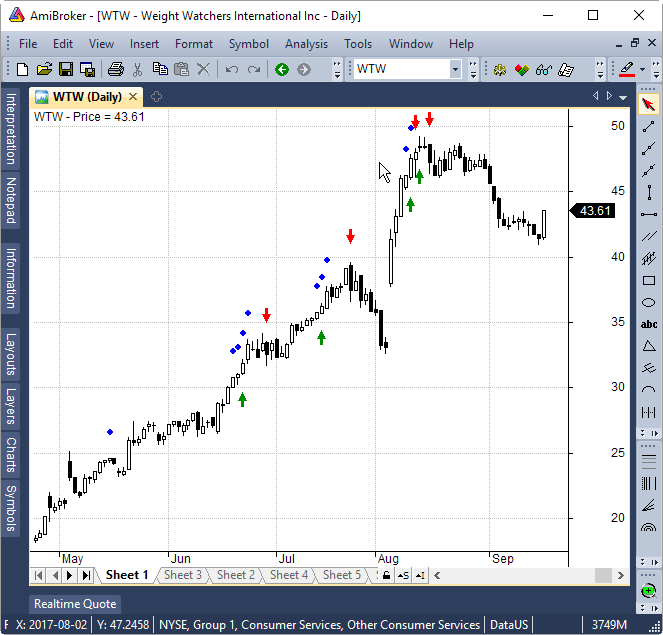
FIGURE 6: AMIBROKER. This daily
chart of Weight Watchers International (WTW) shows automatically detected
four up candle patterns (blue dots), followed by a $0.5 breakout (green arrows),
and sell signals (red arrows) generated by $2 trailing stop.
// stocks within 20...70 price range
PriceFilter = Close >= 20 AND Close <= 70;
UpCandle = Close > Open;

// number of consecutive UP candles
ConsecutiveUp = BarsSince( ! UpCandle );

Filter = PriceFilter AND ConsecutiveUp >= 4;
AddColumn( ConsecutiveUp, "ConsecutiveUp", 1.0 );

// trigger price 0.5 above prev high
TriggerPrice = Ref( High, -1 ) + 0.5;

Buy = Ref( Filter, -1 ) AND High > TriggerPrice;
Sell = 0;

// $2 trailing stop
ApplyStop( stopTypeTrailing, stopModePoint, 2 );

Equity( 1, 0 ); // eval stops

Plot( C, "Price", colorDefault, styleCandle );

// four up candle setup (blue dots)
PlotShapes( shapeSmallCircle * Filter, colorBlue, 0, H, 25 );
// buy / sell arrows
PlotShapes( Buy * shapeUpArrow, colorGreen, 0, Low, -25 );
PlotShapes( ( Sell != 0) * shapeDownArrow, colorRed, 0, H, -25 );
—Tomasz Janeczko, AmiBroker.com
www.amibroker.com
BACK TO LIST

AIQ: NOVEMBER 2017
This AIQ code is based on Ken Calhoun’s article from the October 2017
issue of S&C, “Swing Trading Four-Day Breakouts.”
I ran the author’s entry and exit rules using the list of the NASDAQ
100 stocks. Figure 7 shows the backtest results from taking all trades over
the last 10-year period. Also in Figure 7, I show how to set up the pricing
for the test. Neither commission nor slippage was subtracted from the results.

FIGURE 7: AIQ. Here is a sample
EDS summary report and pricing settings for the strategy.
!SWING TRADING FOUR-DAY BREAKOUTS
!Author: Ken Calhoun, TASC Nov 2017
!Coded by: Richard Denning 9/15/17
!www.TradersEdgeSystems.com

!CODING ABBREVIATIONS:
O is [open].
C is [close].
C1 is valresult(C,1).
H is [high].
H1 is valresult(H,1).
L is [low].

Price if C >=20 and C <= 70.
UpTrend if C > simpleavg(C,50).
Green if C > O.
FourGreen if countof(Green,4)=4.
EntryPr is max(H1,O).
Buy if (O > H1 or H > H1) and UpTrend and valrule(FourGreen,1) and Price.
Exit if  C < {position entry price} - 2 or C < {position high price} - 2.
ExitPr is C.
The code and EDS file can be downloaded from www.TradersEdgeSystems.com/traderstips.htm.
—Richard Denning
info@TradersEdgeSystems.com
for AIQ Systems
BACK TO LIST

NINJATRADER: NOVEMBER 2017
The multiday breakout strategy that was discussed in an article by Ken Calhoun
in the October 2017 issue of S&C titled “Swing Trading Four-Day Breakouts” is
available for download at the following links for NinjaTrader 8 and for NinjaTrader
7:
Once the file is downloaded, you can import the strategy in NinjaTrader 8
from within the control center by selecting Tools → Import → NinjaScript
Add-On and then selecting the downloaded file for NinjaTrader 8.
To import in NinjaTrader 7 from within the control center window, select the
menu File → Utilities → Import NinjaScript and select the downloaded
file.
You can review the strategy’s source code in NinjaTrader 8 by selecting
the menu New → NinjaScript Editor → Strategies from within the control
center window and selecting the MultiDayBreakouts file. You can review the
strategy’s source code in NinjaTrader 7 by selecting the menu Tools → Edit
NinjaScript → Strategy from within the control center window and selecting
the MultiDayBreakouts file.
NinjaScript uses compiled DLLs that run native, not interpreted, which provides
you with the highest performance possible.
A sample chart implementing the strategy is shown in Figure 8.

FIGURE 8: NINJATRADER. This shows
an example of the multiday breakout strategy taking trades on a daily chart
of Weight Watchers International (WTW) between July and August 2017.
—Raymond Deux & Jim Dooms
NinjaTrader, LLC
www.ninjatrader.com
BACK TO LIST

TRADERSSTUDIO: NOVEMBER 2017
The TradersStudio code based on Ken Calhoun’s article from the October
2017 issue of S&C, “Swing Trading Four-Day Breakouts,” can
be found at www.TradersEdgeSystems.com/traderstips.htm.
I ran the author’s entry and exit rules using the 10-year bond future
(TY) from 1983 to 2014. Figure 9 shows the equity curve for trading one contract
on each signal. Neither commission nor slippage were subtracted from the results.
Note that I added a time exit set to 100 bars. I also changed the stop amount
to 4.5. For futures trading, I did not use the price filter.

FIGURE 9: TRADERSSTUDIO. Here is
a sample equity curve that resulted from backtesting the strategy on one
contract of the 10-year bond future (TY) from 1983 to 2014.
Again, the code can be found at www.TradersEdgeSystems.com/traderstips.htm.
It is also shown here:
'SWING TRADING FOUR-DAY BREAKOUTS
'Author: Ken Calhoun, TASC Nov 2017
'Coded by: Richard Denning 9/15/17
'www TradersEdgeSystems com

Sub FOUR_DAY(StopAmt,ExitBars,usePriceFilter)
Dim myPrice,UpTrend,Green As Boolean
Dim FourGreen As BarArray
Dim EntryPr As BarArray

myPrice = IIF(usePriceFilter,C >= 20 And C <= 70,1)
UpTrend = C > Average(C,50)
Green = C > O
FourGreen = countof(Green,4,0)=4

If UpTrend And FourGreen And myPrice Then Buy("LE",1,H,Stop,Day)
If C < EntryPrice - StopAmt Then ExitLong("LXstop","",1,0,Market,Day)
If C < Highest(C,BarsSinceEntry,0) - StopAmt Then ExitLong("LXtrail","",1,0,Market,Day)
If BarsSinceEntry > ExitBars Then ExitLong("LXtime","",1,0,Market,Day)
End Sub
—Richard Denning
info@TradersEdgeSystems.com
for TradersStudio
BACK TO LIST

UPDATA: NOVEMBER 2017
This month’s Traders’ Tip is based on an article from the October
2017 issue of S&C by Ken Calhoun, “Swing Trading Four-Day Breakouts.”
In the article, the author proposes a candlestick strategy, with both long
and short scenarios claiming a record on NYSE stocks of approximately 60% forecasting
accuracy since January 1, 2013. A simple stochastic and/or RSI is proposed
to exit trades.
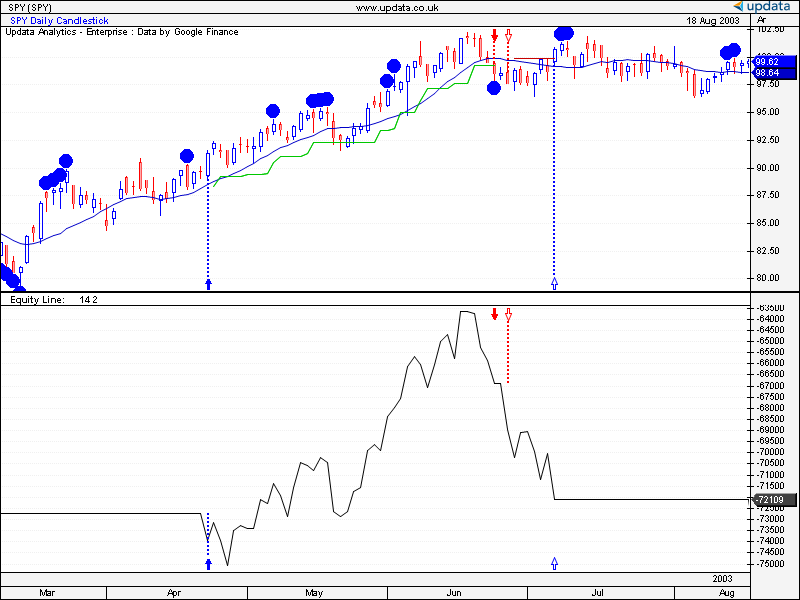
FIGURE 10: UPDATA. A long and short
trade is shown on the SPY ETF. Blue dots indicate a four-candle trend.
The Updata code based on the strategy presented in the article is now in the
Updata library and may be downloaded by clicking the custom menu and system
library. Those who cannot access the library due to a firewall may paste
the code shown here into the Updata custom editor and save it.
PARAMETER "Period" #PERIOD=14
PARAMETER "Stop [$]" @STOP=2
DISPLAYSTYLE 2LINES
INDICATORTYPE TOOL
COLOUR RGB(0,0,200)
NAME "" ""
@AVG=0
@CANDLELONG=0
@CANDLESHORT=0
@LONGENTRY=0
@SHORTENTRY=0
@TRAILINGSTOPLONG=0
@TRAILINGSTOPSHORT=0
FOR #CURDATE=0 TO #LASTDATE
      'EXITS AT TRAILING STOP
      IF ORDERISOPEN=1
         IF CLOSE<@TRAILINGSTOPLONG
            SELL CLOSE
         ENDIF
         @TRAILINGSTOPLONG=MAX(LOW(1)-@STOP,@TRAILINGSTOPLONG)
         @PLOT2=@TRAILINGSTOPLONG
         COLOUR2 RGB(0,200,0)
      ELSEIF ORDERISOPEN=-1
         IF CLOSE>@TRAILINGSTOPSHORT
            COVER CLOSE
         ENDIF
         @TRAILINGSTOPSHORT=MIN(HIGH(1)+@STOP,@TRAILINGSTOPSHORT)
         @PLOT2=@TRAILINGSTOPSHORT
         COLOUR2 RGB(200,0,0)
      ELSE
         @PLOT2=-10000
      ENDIF
     @AVG=MAVE(#PERIOD)
     'CANDLE IN UPTREND SET UP
     IF CLOSE>@AVG AND (CLOSE>20 AND CLOSE<70)
        IF HIGH>HIGH(1) AND HIGH(1)>HIGH(2) AND HIGH(2)>HIGH(3) AND HIGH(3)>HIGH(4)
           @CANDLELONG=1
           @LONGENTRY=HIGH
           DRAWIMAGE ABOVE,#CURDATE,HIGH,Dot 14,RGB(0,0,255)
        ENDIF
     ENDIF
     IF @CANDLELONG=1
        IF CLOSE>@LONGENTRY
           IF ORDERISOPEN=0
              @TRAILINGSTOPLONG=@LONGENTRY-@STOP
           ENDIF
           BUY @LONGENTRY
        ENDIF
        IF CLOSE<@AVG
           @CANDLELONG=0
        ENDIF
     ENDIF
     IF CLOSE<@AVG AND (CLOSE>20 AND CLOSE<70)        '
        IF LOW<LOW(1) AND LOW(1)<LOW(2) AND LOW(2)<LOW(3) AND LOW(3)<LOW(4)
           @CANDLESHORT=1
           @SHORTENTRY=LOW
           DRAWIMAGE BELOW,#CURDATE,LOW,Dot 14,RGB(0,0,255)
        ENDIF
     ENDIF
     IF @CANDLESHORT=1
         IF CLOSE<@SHORTENTRY
           IF ORDERISOPEN=0
              @TRAILINGSTOPSHORT=@SHORTENTRY+@STOP
           ENDIF
            SHORT @SHORTENTRY
         ENDIF
         IF CLOSE>@AVG
            @CANDLESHORT=0
         ENDIF
     ENDIF
     @PLOT=@AVG
NEXT
—Updata support team
support@updata.co.uk
www.updata.co.uk
BACK TO LIST

TRADE NAVIGATOR: NOVEMBER 2017
We’re making available a file for download within the Trade Navigator
library to make it easy for users to implement the strategy discussed in “Swing
Trading Four-Day Breakouts” by Ken Calhoun from the October 2017 issue
of S&C.
The filename is “SC201711.” To download it, click on Trade Navigator’s
blue telephone button, select download special file, and replace the
word “upgrade” with “SC201711” (without the quotes).
Then click the start button. When prompted to upgrade, click the yes button.
If prompted to close all software, click on the continue button. Your
library will now download.
This library contains a highlight bar named “four consecutive green
bar,” a template named “SC swing trading four day,” a criteria
named “four consecutive green,” and a strategy named “SC
Swing Trading Four Day Strategy.”
TradeSense language for the four consecutive green bar:

Consecutive (Close > Open) = 4
If you wish to recreate this indicator manually, click on the edit dropdown
menu, open the trader’s toolbox (or use CTRL + T) and click on the functions tab.
Next, click on the new button, and a new function dialog
window will open. In its text box, input the code for the highlight bar. Ensure
that there are no extra spaces at the end of each line. When completed, click
on the verify button. You may be presented with an add inputs pop-up
message if there are variables in the code. If so, click the yes button,
then enter a value in the default value column. If all is well, when
you click on the function tab, the code you entered will convert to
italic font. Click on the save button and type a name for the indicator.
Adding to your chart
Once complete, you can insert this highlight bar onto your chart by opening
the charting dropdown menu, selecting the add to chart command,
then on the highlight bars tab. Find your named indicator, select
it, then click the add button. Repeat this procedure for additional
indicators as well if you wish.
Template
This library contains a template named “SC Swing Trading Four Day.” This
template can be inserted onto your chart by opening the charting dropdown
menu, selecting the templates command, then selecting the “SC
Swing Trading Four Day” template.
Strategy
This library also contains a strategy named “SC Swing Trading Four Day
Strategy.” This prebuilt strategy can be overlaid onto your chart by
opening the charting dropdown menu, selecting the add to chart command,
then selecting the strategies tab.
A sample chart is shown in Figure 11.
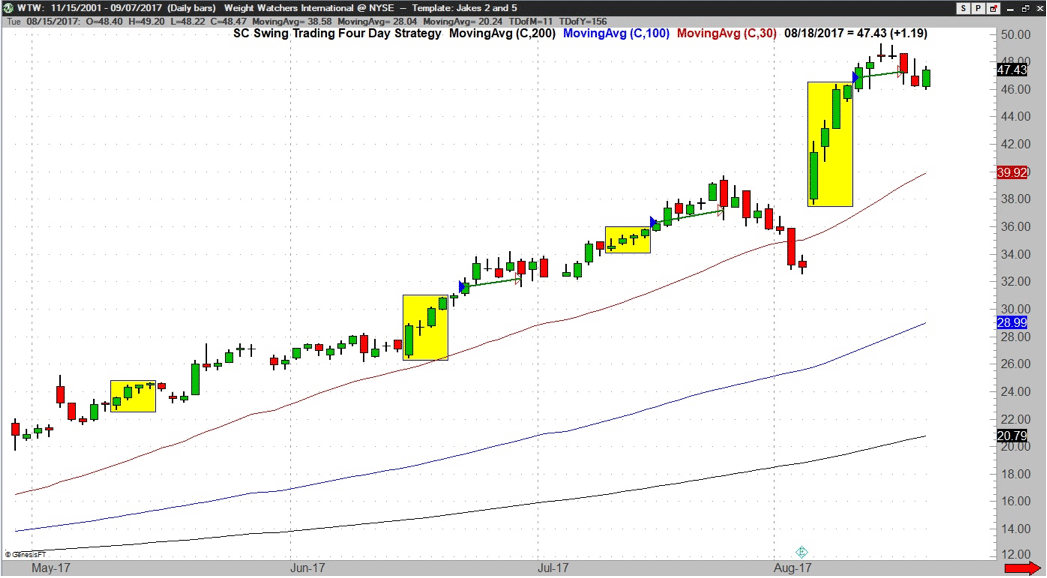
FIGURE 11: TRADE NAVIGATOR. Here,
the swing trading four-day strategy is shown on the chart.
If any assistance is needed while creating or using the indicators and/or
template, feel free to call our technical support staff or use the live chat
feature. Support hours are M–F 6am–6pm US Mountain Time. Happy
Trading!
—Genesis Financial Technologies
Tech support 719 884-0245
www.TradeNavigator.com
BACK TO LIST
Originally published in the November 2017 issue of
Technical Analysis of STOCKS & COMMODITIES magazine.
All rights reserved. © Copyright 2017, Technical Analysis, Inc.


