TRADERS’ TIPS
December 2017

For this month’s Traders’ Tips, the focus is Vitali Apirine’s
article in this issue, “Weekly & Daily MACD.” Here, we present
the December 2017 Traders’ Tips code with possible implementations
in various software.
The Traders’ Tips section is provided to help the reader implement
a selected technique from an article in this issue or another recent issue.
The entries here are contributed by software developers or programmers for
software that is capable of customization.

TRADESTATION: DECEMBER 2017
In the article “Weekly & Daily MACD” in this issue, author
Vitali Apirine introduces a novel approach to using the classic MACD indicator
in a way that simulates calculations based on different timeframes while using
just a daily-interval chart. He describes a number of ways to use this new
indicator that allows traders to adapt it to differing markets and conditions.
Here, we are providing some TradeStation EasyLanguage code for an indicator
based on the author’s ideas.
Indicator: WeeklyAndDailyMACD

// TASC DEC 2017
// Weekly And Daily MACD
// Vitali Apirine

inputs:
	DailyFastLength( 12 ),
	DailySlowLength( 26 ),
	WeeklyFastLength( 60 ),
	WeeklySlowLength( 130 ) ;

variables:
	DailyMACD( 0 ),
	WeeklyMACD( 0 ),
	RelativeDailyLine( 0 ) ;

DailyMACD = MACD( Close,
	DailyFastLength, DailySlowLength ) ;
WeeklyMACD = MACD( Close,
	WeeklyFastLength, WeeklySlowLength ) ;
RelativeDailyLine = WeeklyMACD + DailyMACD ;

if RelativeDailyLine Crosses over
	WeeklyMACD then
	Alert( "Relative Crossing Over Weekly" )
else if RelativeDailyLine Crosses under
	WeeklyMACD then
	Alert( "Relative Crossing Under Weekly" ) ;

Plot1( WeeklyMACD, "Weekly MACD" ) ;
Plot2( RelativeDailyLine, "Relative MACD" ) ;
Plot3( 0, "Zero Line" ) ;
To download the EasyLanguage code, please visit our TradeStation and EasyLanguage
support forum. The files for this article can be found here: https://community.tradestation.com/Discussions/Topic.aspx?Topic_ID=142776.
The filename is “TASC_DEC2017.ZIP.” For more information about
EasyLanguage in general, please see https://www.tradestation.com/EL-FAQ.
A sample chart is shown in Figure 1.

FIGURE 1: TRADESTATION. Here is
a daily chart of Apple (AAPL) with the WeeklyAndDailyMACD indicator applied.
This article is for informational purposes. No type of trading or investment
recommendation, advice, or strategy is being made, given, or in any manner
provided by TradeStation Securities or its affiliates.
—Doug McCrary
TradeStation Securities, Inc.
www.TradeStation.com
BACK TO LIST

eSIGNAL: DECEMBER 2017
For this month’s Traders’ Tip, we’ve provided the study WD_MACD.efs based
on Vitali Apirine’s article in this issue, “Weekly & Daily
MACD.”
The study contains formula parameters that may be configured through the edit
chart window (right-click on the chart and select edit chart). A sample chart
is shown in Figure 2.

FIGURE 2: eSIGNAL. Here is an example
of the study plotted on a daily chart of $NYA.
To discuss this study or download a complete copy of the formula code, please
visit the EFS library discussion board forum under the forums link from the
support menu at www.esignal.com or
visit our EFS KnowledgeBase at www.esignal.com/support/kb/efs/.
The eSignal formula script (EFS) is also available for copying & pasting here:
/*********************************
Provided By:
eSignal (Copyright c eSignal), a division of Interactive Data
Corporation. 2016. All rights reserved. This sample eSignal
Formula Script (EFS) is for educational purposes only and may be
modified and saved under a new file name.  eSignal is not responsible
for the functionality once modified.  eSignal reserves the right
to modify and overwrite this EFS file with each new release.

Description:
    Weekly & Daily MACD by Vitali Apirine

Version:            1.00  10/11/2017

Formula Parameters:                     Default:
Fast Length                             12
Slow Length                             26
Multiplier                              5


Notes:
The related article is copyrighted material. If you are not a subscriber
of Stocks & Commodities, please visit www.traders.com.

**********************************/

var fpArray = new Array();

function preMain(){
    setPriceStudy(false);
    setCursorLabelName("WMACD", 0);
    setCursorLabelName("W&D MACD", 1);
    setDefaultBarFgColor(Color.RGB(255,106,0), 1);

    var x = 0;
    fpArray[x] = new FunctionParameter("fast", FunctionParameter.NUMBER);
	with(fpArray[x++]){
        setLowerLimit(1);
        setDefault(12);
        setName("Fast Length");
    }
    fpArray[x] = new FunctionParameter("slow", FunctionParameter.NUMBER);
	with(fpArray[x++]){
        setLowerLimit(1);
        setDefault(26);
        setName("Slow Length");
    }
    fpArray[x] = new FunctionParameter("mult", FunctionParameter.NUMBER);
	with(fpArray[x++]){
        setLowerLimit(1);
        setDefault(5);
        setName("Multiplier");
    }
}

var bInit = false;
var bVersion = null;

var xMACDD = null;
var xMACDW = null;


function main(fast, slow, mult){
    if (bVersion == null) bVersion = verify();
    if (bVersion == false) return;

    if (getBarState() == BARSTATE_ALLBARS){
        bInit = false;
    }

    if (!bInit){
        xMACDD = macd(fast, slow, 1);
        xMACDW = macd(fast * mult, slow * mult, 1);
        addBand(0, PS_DASH, 1, Color.grey, 2);
        bInit = true;
    }

    nMACDD = xMACDD.getValue(0);
    nMACDW = xMACDW.getValue(0);

    if (nMACDD != null && nMACDW != null){
        return [nMACDW, (nMACDW + nMACDD)];
    }
}


function verify(){
    var b = false;
    if (getBuildNumber() < 779){

        drawTextAbsolute(5, 35, "This study requires version 10.6 or later.",
            Color.white, Color.blue, Text.RELATIVETOBOTTOM|Text.RELATIVETOLEFT|Text.BOLD|Text.LEFT,
            null, 13, "error");
        drawTextAbsolute(5, 20, "Click HERE to upgrade.@URL=https://www.esignal.com/download/default.asp",
            Color.white, Color.blue, Text.RELATIVETOBOTTOM|Text.RELATIVETOLEFT|Text.BOLD|Text.LEFT,
            null, 13, "upgrade");
        return b;
    }
    else
        b = true;

    return b;
}
—Eric Lippert
eSignal, an Interactive Data company
800 779-6555, www.eSignal.com
BACK TO LIST

WEALTH-LAB: DECEMBER 2017
The W&D MACD oscillator discussed by Vitali Apirine in his article in
this issue, “Weekly & Daily MACD,” combines the two MACD oscillators
(weekly and daily) on a daily chart. The author suggests that relative daily
MACD line crossovers, weekly and daily centerline crossovers, and divergences
can be used to generate trading signals.
The latter (divergence detection) is the basis of our example trading system
(Figure 3). A bearish divergence forms when a security records a higher high
(or a series of them) and the weekly W&D MACD line forms a lower high (and
vice versa for a bullish divergence). As Apirine notes in his article, weekly
MACD divergences are more important than daily MACD divergences.

FIGURE 3: WEALTH-LAB. This example
chart shows a divergence in Procter & Gambler stock (PG) with three tops
that formed in a year.
After you update the TASCIndicators library to v2017.11 (or higher) in Wealth-Lab,
the RelativeDailyMACD and WeeklyMACD indicators can be found under the TASC
Magazine Indicators group. You can plot them on a chart or use them as an entry
or exit condition in a rule-based strategy without having to program any code
yourself.
You can run the C# strategy code provided here to make your own conclusions
regarding the efficiency of indicator’s application to spot medium-term
divergences on the chart.
C# Code

using System;
using System.Collections.Generic;
using System.Text;
using System.Drawing;
using WealthLab;
using WealthLab.Indicators;
using TASCIndicators;

namespace WealthLab.Strategies
{
	/*
		Divergence: price sets a lowest low but the indicator fails to confirm the new low and turns up
	*/

	public class WDMACD_Divergence : WealthScript
	{
		private StrategyParameter paramHighest;
		private StrategyParameter paramExitDays;

		private StrategyParameter paramDailyLength1;
		private StrategyParameter paramDailyLength2;
		private StrategyParameter paramWeeklyLength1;
		private StrategyParameter paramWeeklyLength2;

		public WDMACD_Divergence()
		{
			paramHighest = CreateParameter("Highest high of", 130, 60, 300, 10);
			paramExitDays = CreateParameter("Exit after", 20, 1, 50, 1);

			paramDailyLength1 = CreateParameter("Daily Length 1",12,2,300,20);
			paramDailyLength2 = CreateParameter("Daily Length 2",26,2,300,20);
			paramWeeklyLength1 = CreateParameter("Weekly Length 1",60,2,300,20);
			paramWeeklyLength2 = CreateParameter("Weekly Length 2",130,2,300,20);
		}

		protected override void Execute()
		{
			if( Bars.Scale != BarScale.Daily )
			{
				DrawLabel(PricePane, "Switch to Daily scale");
				Abort();
			}

			bool peak = false; int peakBar = -1;
			int high = paramHighest.ValueInt;
			bool trough = false; int troughBar = -1;
			int low = paramHighest.ValueInt;
			int days = paramExitDays.ValueInt;

			var RDM = RelativeDailyMACD.Series(Close,paramDailyLength1.ValueInt,
paramDailyLength2.ValueInt, paramWeeklyLength1.ValueInt,paramWeeklyLength2.ValueInt);
			var WM = WeeklyMACD.Series(Close,paramWeeklyLength1.ValueInt,
paramWeeklyLength2.ValueInt);

			HideVolume(); LineStyle solid = LineStyle.Solid;
			ChartPane paneWDMACDPane1 = CreatePane(40,true,true);
            PlotSeries( paneWDMACDPane1,RDM,Color.FromArgb(255,0,100,0),LineStyle.Solid,2);
			PlotSeries( paneWDMACDPane1,WM,Color.FromArgb(255,0,0,0),LineStyle.Solid,2);
			DrawHorzLine( paneWDMACDPane1,0,Color.Blue,LineStyle.Solid,1);

			Lowest indicatorLowest = Lowest.Series( WM, low );
			Lowest hLow = Lowest.Series( Low, low );

			for(int bar = GetTradingLoopStartBar( 130 ); bar < Bars.Count; bar++)
			{
				if (!IsLastPositionActive)
				{
					/* 1st peak: both price and indicator */

					if( peak == false )
					{
						if( ( High[bar-1] == Highest.Series( High, high )[bar-1] )
							& ( WM[bar-1] == Highest.Series( WM, high )[bar-1] )
							& TurnDown( bar, High ) & TurnDown( bar, WM ) )
						{
							peak = true; peakBar = bar-1;
						}
					}

					if( peak == true )
					{
						if( ( High[bar] != Highest.Series( High, high )[bar] )
							& ( WM[bar] == Highest.Series( WM, high )[bar] ) )
							peak = false;
                    }

					/* 2nd peak: price high not confirmed by the indicator */

					if( peak == true )
					{
						if( ( High[bar-1] == Highest.Series( High, high )[bar-1] )
							& ( High[bar-1] >= High[peakBar] )
							& ( WM[bar-1] != Highest.Series( WM, high )[bar-1] )
							& ( WM[bar-1] < WM[peakBar] ) &
							TurnDown( bar, High ) & TurnDown( bar, WM ) )
						{
							peak = false;
							ShortAtMarket( bar+1 );

							/* Highlight divergence */

							for (int b = peakBar; b <= bar; b++)
								SetPaneBackgroundColor( paneWDMACDPane1, b, Color.FromArgb( 30, Color.LightCoral ) );

							DrawLine( PricePane, peakBar, High[peakBar], bar-1, High[bar-1], Color.Red, solid, 2 );
							DrawLine( paneWDMACDPane1, peakBar, WM[peakBar], bar-1, WM[bar-1], Color.Blue, solid, 2 );
						}
					}

					/* 1st trough: both price and indicator */

					if( trough == false )
					{
						if( ( Low[bar-1] == Lowest.Series( Low, low )[bar-1] )
							& ( WM[bar-1] == Lowest.Series( WM, low )[bar-1] )
							& TurnUp( bar, Low ) & TurnUp( bar, WM ) )
						{
							trough = true; troughBar = bar-1;
						}
					}

					if( trough == true )
					{
						if( ( Low[bar] != Lowest.Series( Low, low )[bar] )
							& ( WM[bar] == Lowest.Series( WM, low )[bar] ) )
							trough = false;
                    }

					/* 2nd trough: price low not confirmed by the indicator */

					if( trough == true )
					{
						if( ( Low[bar-1] == Lowest.Series( Low, low )[bar-1] )
							& ( Low[bar-1] <= Low[troughBar] )
							& ( WM[bar-1] != Lowest.Series( WM, low )[bar-1] )
							& ( WM[bar-1] > WM[troughBar] ) &
							TurnUp( bar, Low ) & TurnUp( bar, WM ) )
						{
							trough = false;
							BuyAtMarket( bar+1 );

							/* Highlight divergence */

							for (int b = troughBar; b <= bar; b++)
								SetPaneBackgroundColor( paneWDMACDPane1, b,
									Color.FromArgb( 30, Color.LightGreen ) );

							DrawLine( PricePane, troughBar, Low[troughBar],
								bar-1, Low[bar-1], Color.Blue, solid, 2 );
							DrawLine( paneWDMACDPane1, troughBar, WM[troughBar],
								bar-1, WM[bar-1], Color.Red, solid, 2 );
						}
					}
				} else
				{
					/* Exit after N days */

					Position p = LastPosition;
					if ( bar+1 - p.EntryBar >= days )
						ExitAtMarket( bar+1, p, "Timed" );
				}
			}
		}
	}
}
—Eugene (Gene Geren), Wealth-Lab team
MS123, LLC
www.wealth-lab.com
BACK TO LIST

NEUROSHELL TRADER: DECEMBER 2017
The weekly and daily MACD discussed in Vitali Apirine’s article in this
issue can be easily implemented with a few of NeuroShell Trader’s 800+
indicators. Simply select new indicator from the insert menu
and use the indicator wizard to create the following indicators:
Add2( MACD(Close,60,130), MACD(Close,12,26) )
Users of NeuroShell Trader can go to the Stocks & Commodities section
of the NeuroShell Trader free technical support website to download a copy
of this or any previous Traders’ Tips.
A sample chart is shown in Figure 4.

FIGURE 4: NEUROSHELL TRADER. This
example NeuroShell Trader chart shows the weekly and daily MACD.
—Marge Sherald, Ward Systems Group, Inc.
301 662-7950, sales@wardsystems.com
www.neuroshell.com
BACK TO LIST

AIQ: DECEMBER 2017
The AIQ code based on Vitali Apirine’s article in this issue, “Weekly & Daily
MACD,” is provided at www.TradersEdgeSystems.com/traderstips.htm.
Figure 5 shows the daily & weekly MACD indicator on a chart of Apple Inc.
(AAPL) during 2016 and 2017, when there was a change from a downtrend to an
uptrend.

FIGURE 5: AIQ. Here is an example
of the daily & weekly MACD on a chart of AAPL.
The code and EDS file can be downloaded from www.TradersEdgeSystems.com/traderstips.htm,
or copied here:
!WEEKLY & DAILY MACD
!Author: Vitali Apirine, TASC Dec 2017
!Coded by: Richard Denning 10/13/17
!www.TradersEdgeSystems.com

!INPUTS:
S is 12.
L is 25.

EMA1 is expavg([Close],S).
EMA2 is expavg([Close],L).
EMA3 is expavg([Close],S*5).
EMA4 is expavg([Close],L*5).
MACD is EMA1 - EMA2.
MACDW is EMA3 - EMA4.
rdMACD is MACD + MACDW.
—Richard Denning
info@TradersEdgeSystems.com
for AIQ Systems
BACK TO LIST

TRADERSSTUDIO: DECEMBER 2017
The TradersStudio code based on Vitali Apirine’s article in this issue, “Weekly & Daily
MACD,” is provided at www.TradersEdgeSystems.com/traderstips.htm.
Figure 6 shows the daily & weekly MACD indicator on a chart of Apple Inc.
(AAPL) during 2013 and 2014, when there was a change from a downtrend to an
uptrend.

FIGURE 6: TRADERSSTUDIO. The daily & weekly
MACD is shown on a chart of AAPL. White line = daily MACD, yellow line =
weekly MACD, and green line = relative daily MACD.
The code is shown here:
'WEEKLY & DAILY MACD
'Author: Vitali Apirine, TASC Dec 2017
'Coded by: Richard Denning 10/13/17
'www.TradersEdgeSystems.com

function RD_MACD(len1,len2)
Dim DMACD As BarArray
Dim WMACD As BarArray
DMACD = macd(C,len1,len2,0)
WMACD = macd(C,len1*5,len2*5,0)
RD_MACD = DMACD + WMACD

End Function
'------------------------------------
sub RD_MACD_IND(len1,len2)
plot1(macd(C,len1,len2,0))
plot2(macd(C,len1*5,len2*5,0))
plot3(RD_MACD(len1,len2))
Plot4(0)
End Sub
'------------------------------------
—Richard Denning
info@TradersEdgeSystems.com
for TradersStudio
BACK TO LIST

NINJATRADER: DECEMBER 2017
The weekly & daily MACD strategy, as discussed in the article “Weekly & Daily
MACD” by Vitali Apirine in this issue, is available for download at the
following links for NinjaTrader 8 and NinjaTrader 7:
Once you have downloaded the file, you can import the strategy into NinjaTader
8 from within the Control Center by selecting Tools → Import → NinjaScript
Add-On and then selecting the downloaded file for NinjaTrader 8. To import
into NinjaTrader 7, from within the Control Center window, select the menu
File → Utilities → Import NinjaScript and select the downloaded file.
You can review the strategy’s source code in NinjaTrader 8 by selecting
the menu New → NinjaScript Editor → Strategies from within the Control
Center window and selecting the WeeklyAndDailyMACDStrategy file. You can review
the strategy’s source code in NinjaTrader 7 by selecting the menu Tools → Edit
NinjaScript → Strategy from within the Control Center window and selecting
the WeeklyAndDailyMACDStrategy file.
NinjaScript uses compiled DLLs that run native, not interpreted, which provides
you with the highest performance possible.
A sample chart implementing the strategy is shown in Figure 7.

FIGURE 7: NINJATRADER. Here is
the weekly & daily MACD strategy taking bullish divergence trades on
a daily FDAX 12–17 chart between February 2014 and December 2016.
—Raymond Deux & Jim Dooms
NinjaTrader, LLC
www.ninjatrader.com
BACK TO LIST

UPDATA: DECEMBER 2017
This month’s Traders’ Tip is based on the article by Vitali Apirine
in this issue, “Weekly & Daily MACD.”
In the article, the author proposes a technical indicator comprised of linearly
adding a long-term and short-term MACD to better capture divergences with price
action and periods’ persistence momentum. Periods for the indicator above
the central line when approaching identified resistance might imply continued
momentum through those levels, and vice versa when below the line.
The Updata code based on this article is in the Updata library and may be
downloaded by clicking the custom menu and indicator library.
Those who cannot access the library due to a firewall may paste the code shown
here into the Updata custom editor and save it.
'Weekly & Daily MACD
'Ref : Stocks & Commodities Magazine, Dec 17
DISPLAYSTYLE 2LINES
INDICATORTYPE CHART
NAME MACD
PARAMETER "MACD Period 1" #PERIOD1=12
PARAMETER "MACD Period 2" #PERIOD2=26
PARAMETER "MACD Period 3" #PERIOD3=60
PARAMETER "MACD Period 4" #PERIOD4=130
@MACD1=0
@MACD2=0
COLOUR2 RGB(200,0,0)
FOR #CURDATE=#PERIOD1+#PERIOD2 TO #LASTDATE
   'INDICATORS
   @MACD1=MACD(#PERIOD1,#PERIOD2,E)
   @MACD2=MACD(#PERIOD3,#PERIOD4,E)
   @PLOT=@MACD1+@MACD2
   @PLOT2=0
NEXT
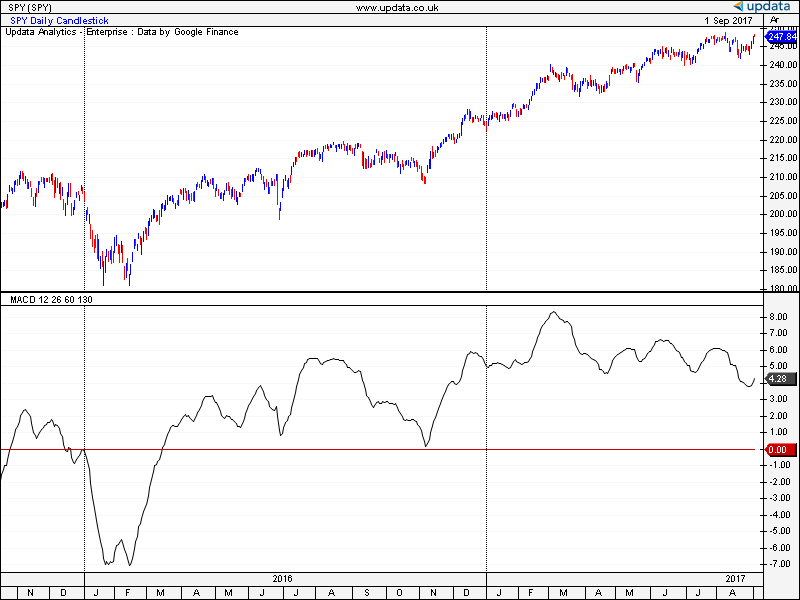
FIGURE 8: UPDATA. Here, the weekly & daily
MACD is applied to the SPY ETF of daily resolution.
—Updata support team
support@updata.co.uk
www.updata.co.uk
BACK TO LIST

AMIBROKER: DECEMBER 2017
In “Weekly & Daily MACD” in this issue, Vitali Apirine presents
another article about MACD. The code listing here shows a ready-to-use formula.
To adjust parameters, right-click on the chart and select parameters from
the context menu.
LISTING 1.
l1 = Param("Length1", 60, 1, 100 );
l2 = Param("Length2", 130, 1, 100 );
l3 = Param("Length3", 12, 1, 100 );
l4 = Param("Length4", 26, 1, 100 );


wm = EMA( C, l1 ) - EMA( C, l2 );
dm = EMA( C, l3 ) - EMA( C, l4 );

Plot( wm, "WM"+_PARAM_VALUES(), colorREd );
Plot( wm+dm, "WM+DM", colorGreen );
Plot( 0, "", colorBlue, styleNoLabel );
A sample chart is shown in Figure 9.
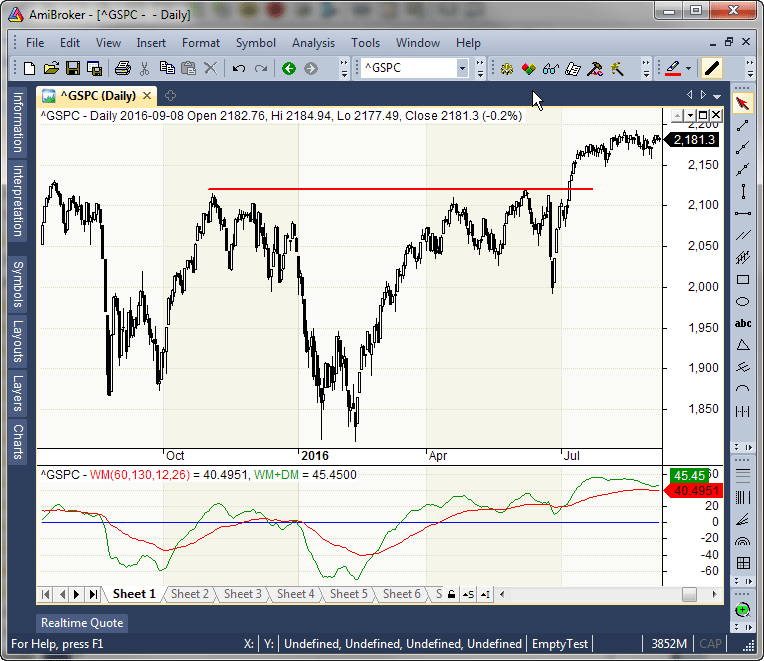
FIGURE 9: AMIBROKER. Here is a
daily chart of the S&P 500 (upper pane) with the WM-MACD shown in the
lower pane, replicating the chart from Vitali Apirine’s article in
this issue.
—Tomasz Janeczko, AmiBroker.com
www.amibroker.com
BACK TO LIST

TRADE NAVIGATOR: DECEMBER 2017
We’re making available a file for download within the Trade Navigator
library to make it easy for users to implement the strategy discussed in “Weekly & Daily
MACD” by Vitali Apirine in this issue. The file name is “SC201712.” To
download it, click on Trade Navigator’s blue telephone button, select
download special file, and replace the word “upgrade” with “SC201712” (without
the quotes). Then click the start button. When prompted to upgrade, click the
yes button. If prompted to close all software, click on the continue button.
Your library will now download.
This library contains two indicators: “W&D MACD” and “Weekly
MACD.” The TradeSense code for each of these indicators is shown in Figures
10 and 11, respectively.
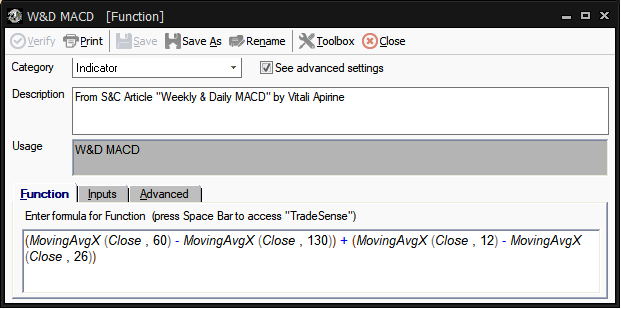
FIGURE 10: TRADE NAVIGATOR, W&D
MACD. TradeSense code is shown for recreating the W&D MACD indicator.
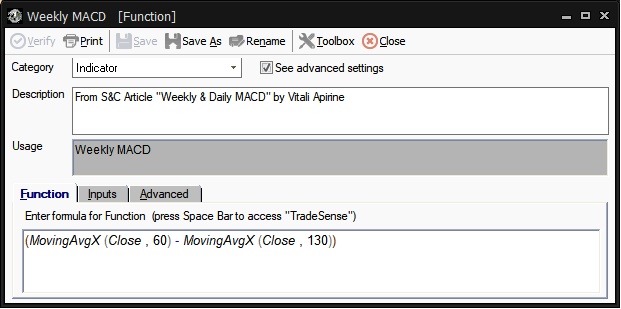
FIGURE 11: TRADE NAVIGATOR, WEEKLY
MACD. TradeSense code is shown for recreating the weekly MACD indicator.
Manually creating indicators
If you would like to create these indicators manually, click on the edit dropdown
menu, open the trader’s toolbox (or use CTRL + T) and click on the functions tab.
Next, click on the new button, and a new function dialog
window will open. In its text box, input the code for the indicator. Ensure
that there are no extra spaces at the end of each line. When completed, click
on the verify button. You may be presented with an add inputs pop-up
message if there are variables in the code. If so, click the yes button,
then enter a value in the default value column. If all is well, when
you click on the function tab, the code you entered will convert to
italic font. Click on the save button and type a name for the indicator.
Adding to your chart
Once you have the indicators created, you can insert them onto your chart by
opening the charting dropdown menu, selecting the add to chart command,
then, on the indicators tab, find your named indicator, select it,
then click on the add button. Repeat this procedure for additional
indicators as well if you wish.
Users may contact our technical support staff by phone or by live chat if
any assistance is needed in creating or using the indicators.
A sample chart implementing the indicator is shown in Figure 12.
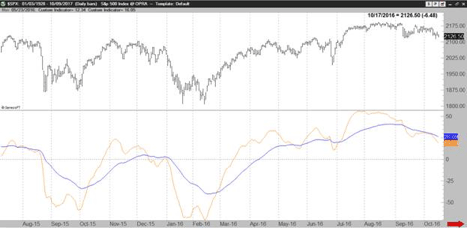
FIGURE 12: TRADE NAVIGATOR. The
W&D MACD is shown on a sample chart.
—Genesis Financial Technologies
Tech support 719 884-0245
www.TradeNavigator.com
BACK TO LIST
MICROSOFT EXCEL: DECEMBER 2017
Vitali Apirine’s article in this issue, “Weekly & Daily MACD,” starts
with two MACD series created with different lookback lengths. He then compares
and combines these MACD series to investigate their ability to track trend
strength, provide early warning of trend changes, and perhaps predict trend
strength after the trend change.
The chart clutter controls in Excel allow us to mix and match these MACD series
similar to what Apirine has done in his article (see Figure 13).
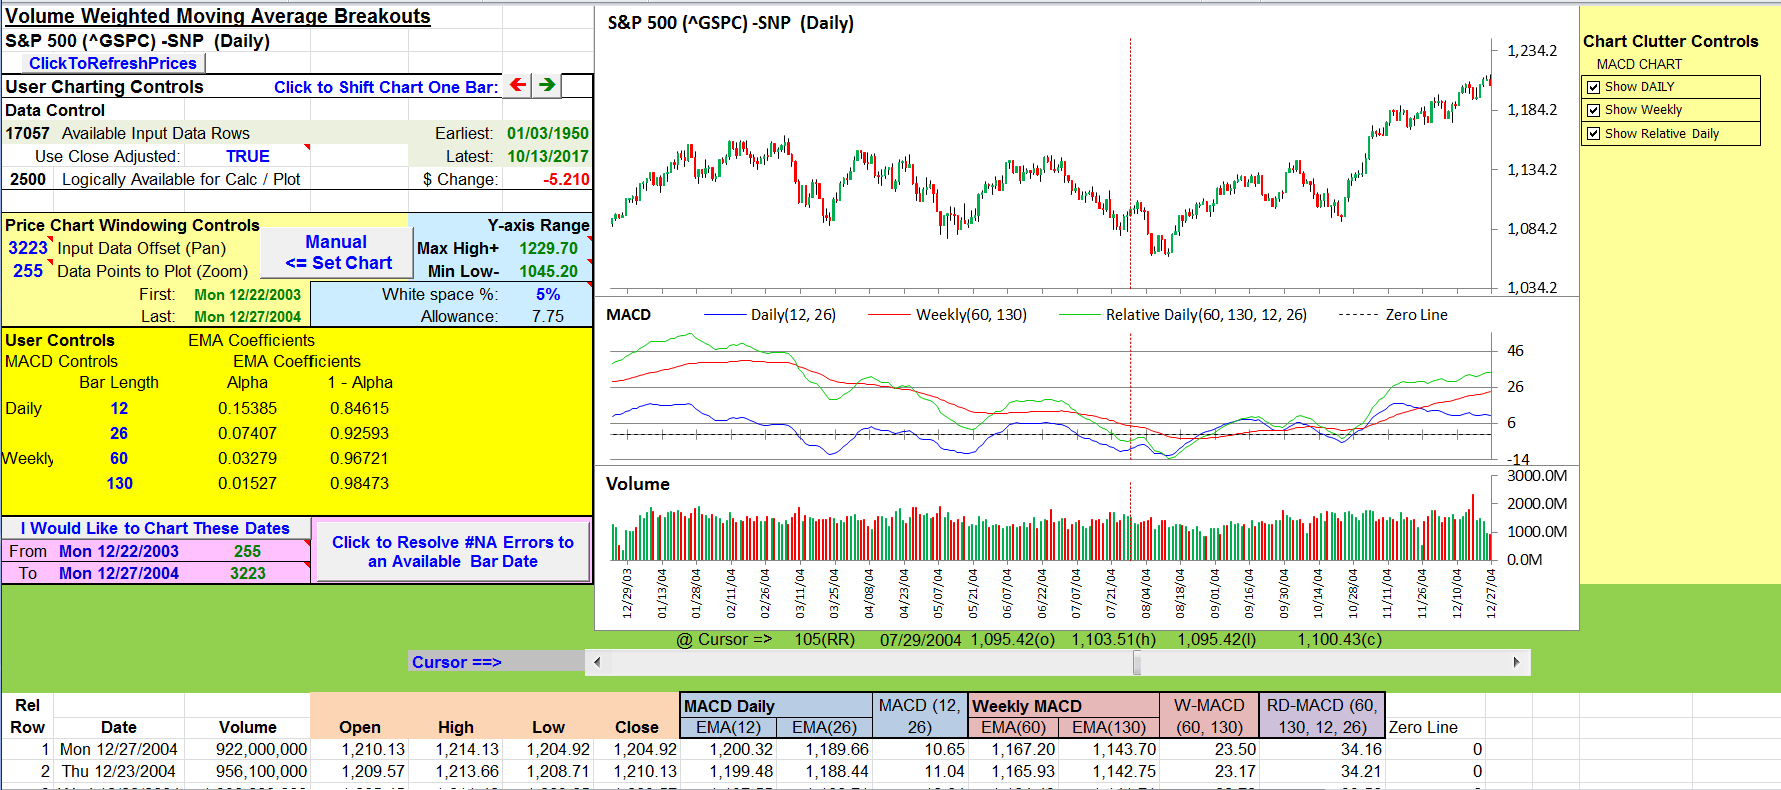
FIGURE 13: EXCEL. This sample chart
approximates Figure 4 from Vitali Apirine’s article in this issue.
The user controls area can be used to investigate other MACD lookback intervals.
In his article in this issue, Apirine has wrung a lot of potential untapped
power out of a simple concept. Enjoy!
The spreadsheet file for this Traders’ Tip can be downloaded here.
To successfully download it, follow these steps:
- Right-click on the Excel
file link, then
- Select “save as” (or “save target as”) to place
a copy of the spreadsheet file on your hard drive.
Postscript: Changes to the Yahoo Finance website impacted the history
download interface on which these Traders’ Tips spreadsheets depended.
The old Yahoo history interface ceased to exist and with its demise, the VBA
code that performed the necessary historical price data retrieval could no
longer function.
The spreadsheet I’m presenting this month incorporates a first working
cut at clearing the hurdles necessary to access the redesigned Yahoo history
download interface.
This spreadsheet will not download data for Excel on a Macintosh platform.
I am hoping to get these Traders’ Tips working for Excel in the Macintosh
environment for future Traders’ Tips.
A fix for previous Excel spreadsheets, required due to Yahoo modifications, can be found here: https://traders.com/files/Tips-ExcelFix.html
—Ron McAllister
Excel and VBA programmer
rpmac_xltt@sprynet.com
BACK TO LIST
Originally published in the December 2017 issue of
Technical Analysis of STOCKS & COMMODITIES magazine.
All rights reserved. © Copyright 2017, Technical Analysis, Inc.


