TRADERS’ TIPS
January 2018

For this month’s Traders’ Tips, the focus is Barbara Star’s
article in this issue, “The CAM Indicator For Trends And Countertrends.” Here,
we present the January 2018 Traders’ Tips code with possible implementations
in various software.
The Traders’ Tips section is provided to help the reader implement
a selected technique from an article in this issue or another recent issue.
The entries here are contributed by software developers or programmers for
software that is capable of customization.

TRADESTATION: JANUARY 2018
In the article “The CAM Indicator For Trends And Countertrends” in
this issue, author Barbara Star introduces using chart patterns based on a
coordinated ADX and MACD or, as she abbreviates it, CAM. In the article, she
describes using the CAM indicator to identify upward and downward trends as
well as pullbacks in existing trends and countertrend rallies.
Here, we are providing the TradeStation EasyLanguage code for the CAM indicator
based on the author’s work. In a chart, the indicator will highlight
the current pattern by painting the bar a user-defined color. In TradeStation
RadarScreen, the current pattern will be shown in text.
The author also suggests using other indicators such as an exponential moving
average (EMA) and the commodity channel index (CCI) to help confirm signals
generated by CAM. These indicators are part of the standard library of analysis
techniques included with the TradeStation platform and can be applied as desired.
// TASC JAN 2018
// The CAM Indicator
// Barbara Star, PhD.

inputs:
	ADXLength( 10 ),
	MACDFastLength( 12 ),
	MACDSlowLength( 26 ),
	CAMUPColor( Green ),
	CAMDNColor( Red ),
	CAMPBColor( Yellow ),
	CAMCTColor( Blue ) ;

variables:
	MACDValue( 0 ),
	ADXValue( 0 ),
	PlotColor( 0 ),
	MACDRising( false ),
	ADXRising( false ),
	intrabarpersist InAChart( false ),
	PatternLabel( "" ) ;

once
	begin
	InAChart = GetAppInfo( aiApplicationType ) = cChart ;
	end ;

MACDValue = MACD( Close, MACDFastLength,
	MACDSlowLength ) ;
ADXValue = ADX( ADXLength ) ;

MACDRising = MACDValue > MACDValue[1] ;
ADXRising = ADXValue > ADXValue[1] ;

if ADXRising and MACDRising then
	begin
	PlotColor = CAMUPColor ;
	PatternLabel = "CAM UP" ;
	end
else if not ADXRising and not MACDRising then
	begin
	PlotColor = CAMPBColor ;
	PatternLabel = "CAM PB" ;
	end
else if ADXRising and not MACDRising then
	begin
	PlotColor = CAMDNColor ;
	PatternLabel = "CAM DN" ;
	end
else if not ADXRising and MACDRising then
	begin
	PlotColor = CAMCTColor ;
	PatternLabel = "CAM CT" ;
	End ;

// Format plot style as follows:
// Plot1 Bar High
// Plot2 Bar Low
// Plot3 Left Tic
// Plot4 Right Tic
Plot1( High, "CAMH", PlotColor ) ;
Plot2( Low, "CAML", PlotColor ) ;
Plot3( Open, "CAMO", PlotColor ) ;
Plot4( Close, "CAMC", PlotColor ) ;

// Show current state in RadarScreen
If not InAChart then
	Plot5( PatternLabel, "CAM", PlotColor )
To download the EasyLanguage code, please visit our TradeStation and EasyLanguage
support forum. The files for this article can be found at https://community.tradestation.com/Discussions/Topic.aspx?Topic_ID=142776.
The filename is “TASC_JAN2018.ZIP.”
For more information about EasyLanguage in general, please see https://www.tradestation.com/EL-FAQ.
A sample chart is shown in Figure 1.

FIGURE 1: TRADESTATION. Here is
an example of a daily chart of VZ with the CAM indicator applied.
This article is for informational purposes. No type of trading or investment
recommendation, advice, or strategy is being made, given, or in any manner
provided by TradeStation Securities or its affiliates.
—Doug McCrary
TradeStation Securities, Inc.
www.TradeStation.com
BACK TO LIST

eSIGNAL: JANUARY 2018
For this month’s Traders’ Tip, we’ve provided the study
CAM_Indicator.efs based on the CAM indicator described in Barbara Star’s
article in this issue, “The CAM Indicator For Trends And Countertrends.”
The study contains formula parameters that may be configured through the edit
chart window (right-click on the chart and select edit chart).
A sample chart is shown in Figure 2.

FIGURE 2: eSIGNAL. Here is an example
of the CAM indicator study plotted on a daily chart of VZ.
To discuss this study or download a complete copy of the formula code, please
visit the EFS library discussion board forum under the forums link
from the support menu at www.esignal.com or visit our EFS KnowledgeBase at https://www.esignal.com/support/kb/efs/.
The eSignal formula script (EFS) is also available for copying & pasting
here:
/*********************************
Provided By:
eSignal (Copyright c eSignal), a division of Interactive Data
Corporation. 2016. All rights reserved. This sample eSignal
Formula Script (EFS) is for educational purposes only and may be
modified and saved under a new file name.  eSignal is not responsible
for the functionality once modified.  eSignal reserves the right
to modify and overwrite this EFS file with each new release.

Description:
    The CAM Indicator For Trends And Countertrends by Barbara Star, PhD

Version:            1.00  11/07/2017

Formula Parameters:                     Default:
    MACD Fast Length                    12
    MACD Slow Length                    26
    MACD Smoothing                      9
    ADX Length                          10
    ADX Smoothing                       14
    Show CAM UP                         true
    CAM UP                              Green
    Show CAM PB                         true
    CAM PB                              Yellow
    Show CAM DN                         true
    CAM DN                              Red
    Show CAM CT                         true
    CAM CT                              Blue

Notes:
The related article is copyrighted material. If you are not a subscriber
of Stocks & Commodities, please visit www.traders.com.

**********************************/

var fpArray = new Array();
var bInit = false;
var bVersion = null;

function preMain() {
    setPriceStudy(true);
    setShowCursorLabel(false);
    setColorPriceBars(true);
    setDefaultPriceBarColor(Color.grey);
    setStudyTitle("CAM");

    var x=0;
    fpArray[x] = new FunctionParameter("nFastLength", FunctionParameter.NUMBER);
	with(fpArray[x++]){
        setName("MACD Fast Length");
        setLowerLimit(1);
        setDefault(12);
    }

    fpArray[x] = new FunctionParameter("nSlowLength", FunctionParameter.NUMBER);
	with(fpArray[x++]){
	    setName("MACD Slow Length");
        setLowerLimit(1);
        setDefault(26);
    }

    fpArray[x] = new FunctionParameter("nSmoothingMACD", FunctionParameter.NUMBER);
	with(fpArray[x++]){
	    setName("MACD Smoothing");
        setLowerLimit(1);
        setDefault(9);
    }

    fpArray[x] = new FunctionParameter("nLength", FunctionParameter.NUMBER);
    with(fpArray[x++]){
        setName("ADX Length");
        setLowerLimit(1);
        setDefault(10);

    }

    fpArray[x] = new FunctionParameter("nSmoothingADX", FunctionParameter.NUMBER);
    with(fpArray[x++]){
        setName("ADX Smoothing");
        setLowerLimit(1);
        setDefault(10);
    }

    fpArray[x] = new FunctionParameter("CAM_UP_shown", FunctionParameter.BOOLEAN);
    with(fpArray[x++]){
        setName("Show CAM UP");
        setDefault(true);
    }

    fpArray[x] = new FunctionParameter("CAM_UP", FunctionParameter.COLOR);
    with(fpArray[x++]){
        setName("CAM UP");
        setDefault(Color.green);
    }

    fpArray[x] = new FunctionParameter("CAM_PB_shown", FunctionParameter.BOOLEAN);
    with(fpArray[x++]){
        setName("Show CAM PB");
        setDefault(true);
    }

    fpArray[x] = new FunctionParameter("CAM_PB", FunctionParameter.COLOR);
    with(fpArray[x++]){
        setName("CAM PB");
        setDefault(Color.RGB(255,192,0));
    }

    fpArray[x] = new FunctionParameter("CAM_DN_shown", FunctionParameter.BOOLEAN);
    with(fpArray[x++]){
        setName("Show CAM DN");
        setDefault(true);
    }

    fpArray[x] = new FunctionParameter("CAM_DN", FunctionParameter.COLOR);
    with(fpArray[x++]){
        setName("CAM DN");
        setDefault(Color.red);
    }

    fpArray[x] = new FunctionParameter("CAM_CT_shown", FunctionParameter.BOOLEAN);
    with(fpArray[x++]){
        setName("Show CAM CT");
        setDefault(true);
    }

    fpArray[x] = new FunctionParameter("CAM_CT", FunctionParameter.COLOR);
    with(fpArray[x++]){
        setName("CAM CT");
        setDefault(Color.blue);
    }
}

var xMACD = null;
var xADX = null;

function main(nFastLength, nSlowLength, nSmoothingMACD, nLength, nSmoothingADX,
                CAM_UP_shown, CAM_UP, CAM_PB_shown, CAM_PB, CAM_DN_shown, CAM_DN, CAM_CT_shown, CAM_CT) {

    if (bVersion == null) bVersion = verify();
    if (bVersion == false) return;


    if (!bInit) {
        xMACD = macd(nFastLength, nSlowLength, nSmoothingMACD);
        xADX = adx(nLength, nSmoothingADX);
        bInit = true;
    }

    var nMACD = xMACD.getValue(0);
    var nADX = xADX.getValue(0);
    var nMACD_Ref = xMACD.getValue(-1);
    var nADX_Ref = xADX.getValue(-1);

    if (nMACD_Ref == null || nADX_Ref == null) return;

    if (nADX >= nADX_Ref &&  nMACD > nMACD_Ref && CAM_UP_shown) {
        setPriceBarColor(CAM_UP);
    }
    if (nADX <= nADX_Ref &&  nMACD < nMACD_Ref && CAM_PB_shown) {
        setPriceBarColor(CAM_PB);
    }
    if (nADX >= nADX_Ref &&  nMACD < nMACD_Ref && CAM_DN_shown) {
        setPriceBarColor(CAM_DN);
    }
    if (nADX <= nADX_Ref &&  nMACD > nMACD_Ref && CAM_CT_shown) {
        setPriceBarColor(CAM_CT);
    }

    return;
}

function verify(){
    var b = false;
    if (getBuildNumber() < 779){

        drawTextAbsolute(5, 35, "This study requires version 10.6 or later.",
            Color.white, Color.blue, Text.RELATIVETOBOTTOM|Text.RELATIVETOLEFT|Text.BOLD|Text.LEFT,
            null, 13, "error");
        drawTextAbsolute(5, 20, "Click HERE to upgrade.@URL=https://www.esignal.com/download/default.asp",
            Color.white, Color.blue, Text.RELATIVETOBOTTOM|Text.RELATIVETOLEFT|Text.BOLD|Text.LEFT,
            null, 13, "upgrade");
        return b;
    }
    else
        b = true;

    return b;
}
—Eric Lippert
eSignal, an Interactive Data company
800 779-6555, www.eSignal.com
BACK TO LIST

WEALTH-LAB: JANUARY 2018
The CAM indicator depicted by Barbara Star in her article in this issue, “The
CAM Indicator For Trends And Countertrends,” combines two classic indicators,
MACD and ADX, into a pair that intends to highlight the price patterns of trends
and reversion.
As suggested in the article, trading this system should be approached after
filtering out false pattern fluctuations by first checking the moving average
and CCI indicator. The resulting countertrend system’s rules are:
Enter long: Buy tomorrow at open if today is a bar colored
gold (which represents the CAM-PB, meaning the 10-period ADX and MACD are declining)
but the 14-period CCI is above zero, or if today is a bar colored blue (that
is, the 10-period ADX is declining but MACD rises) and today’s close
crosses above the 13-period EMA.
Exit long: Sell tomorrow at open if today is a red-colored
bar (which represents the CAM-CT; that is, the 10-period ADX is rising but
the MACD is declining) and today’s close is below the 13-period EMA.
Nonetheless, filtering may not itself be enough; to maximize your odds, we
recommend applying the system to a preselected watchlist of securities that
demonstrate trendiness. Figure 3, which is of bitcoin, shows a characteristic
example of an asset where a trend-following system that enters on corrections
shines.

FIGURE 3: WEALTH-LAB. Recent entries
and exits are shown on a chart of BTC/USD (bitcoin).
To make your own conclusions regarding the efficiency of the indicator combo,
you can run the C# strategy code shown here (which you can download from Wealth-Lab’s open
strategy dialog).
using System;
using System.Collections.Generic;
using System.Text;
using System.Drawing;
using WealthLab;
using WealthLab.Indicators;

namespace WealthLab.Strategies
{
	public class MyStrategy : WealthScript
	{
		protected override void Execute()
		{
			var adx = ADX.Series(Bars,10);
			var macd = MACD.Series(Close);
			var cci = CCI.Series(Bars,14);
			var ema = EMAModern.Series(Close,13);
			var days = 10;

			SetBarColors( Color.Silver,Color.Silver);

			var ls = LineStyle.Solid;
			var cp = CreatePane( 30,true,true);
			var mp = CreatePane( 30,true,true);
			var ap = CreatePane( 30,true,true);
			PlotSeries( mp, macd, Color.DarkGreen, ls, 2 );
			PlotSeries( ap, adx, Color.Red, ls, 2 );
			PlotSeries( cp, cci, Color.Black, LineStyle.Histogram, 2 );
			PlotSeries( PricePane, ema, Color.Gray, ls, 2 );

			for(int bar = GetTradingLoopStartBar( 14 * 3); bar < Bars.Count; bar++)
			{
				bool CAM_UP = (adx[bar] >= adx[bar-1]) & (macd[bar] > macd[bar-1]);
				bool CAM_PB = (adx[bar] <= adx[bar-1]) & (macd[bar] < macd[bar-1]);
				bool CAM_DN = (adx[bar] >= adx[bar-1]) & (macd[bar] < macd[bar-1]);
				bool CAM_CT = (adx[bar] <= adx[bar-1]) & (macd[bar] > macd[bar-1]);

				bool buyPullback = (CAM_PB && (cci[bar] > 0)) ||
					(CAM_CT && CrossOver( bar,Close,ema));

				SetBarColor( bar, CAM_UP ? Color.Green : CAM_PB ? Color.Gold: CAM_DN ? Color.Red : CAM_CT ? Color.DarkBlue : Color.Black );
				SetSeriesBarColor( bar, cci, cci[bar] < 0 ? Color.Red : Color.Green );

				if (IsLastPositionActive)
				{
					Position p = LastPosition;
					if( CAM_DN && (Close[bar] < ema[bar]) )
						SellAtMarket( bar+1, p, "CAM-DN" );
				}
				else
				{
					if(buyPullback)
					{
						AnnotateBar("v",bar,false,Color.Black);
						BuyAtMarket( bar+1);
					}
				}
			}
		}
	}
}
—Eugene (Gene Geren), Wealth-Lab team
MS123, LLC
www.wealth-lab.com
BACK TO LIST

NEUROSHELL TRADER: JANUARY 2018
The CAM indicator patterns described by Barbara Star in her article in this
issue, “The CAM Indicator For Trends And Countertrends,” can be
easily implemented with a few of NeuroShell Trader’s 800+ indicators.
Simply select new indicator from the insert menu and use
the indicator wizard to set up the following indicators:
CAM-UP 	And2( A>=B(ADX(High,Low,Close,10,5), Lag(ADX(High,Low,Close,10,5),1)), A>B(MACD(Close,12,26), Lag(MACD(Close,12,26),1)))

CAM-PB 	And2( A<=B( ADX(High,Low,Close,10,5), Lag(ADX(High,Low,Close,10,5),1)), A<B(MACD(Close,12,26), Lag(MACD(Close,12,26),1)))

CAM-DN 	And2( A>=B( ADX(High,Low,Close,10,5), Lag(ADX(High,Low,Close,10,5),1)), A<B(MACD(Close,12,26), Lag(MACD(Close,12,26),1)))

CAM-CT 	And2( A<=B( ADX(High,Low,Close,10,5), Lag(ADX(High,Low,Close,10,5),1)), A>B(MACD(Close,12,26), Lag(MACD(Close,12,26),1)))
Users of NeuroShell Trader can go to the STOCKS & COMMODITIES section
of the NeuroShell Trader free technical support website to download a copy
of this or any previous Traders’ Tips.
A sample chart is shown in Figure 4.

FIGURE 4: NEUROSHELL TRADER. This
example NeuroShell Trader chart shows the CAM indicator patterns on VZ.
—Marge Sherald, Ward Systems Group, Inc.
301 662-7950, sales@wardsystems.com
www.neuroshell.com
BACK TO LIST

AIQ: JANUARY 2018
The AIQ code based on Barbara Star’s article in this issue, “The
CAM Indicator For Trends And Countertrends,” is provided at www.TradersEdgeSystems.com/traderstips.htm and
is also shown below.
I created an indicator for the CAM that returns a “2” for the
CAM_UP, a “1” for the CAM_PB, a “-1” for the CAM_CT,
and a “-2” for the CAM_DN. I also created three buy rules and ran
backtests.

FIGURE 5: AIQ. Here is an example
of the ADX, MACD, and CAM_IND on a chart of NFLX.
Figure 5 shows the daily ADX and the daily MACD indicator together with the
CAM_IND indicator on a chart of Netflix Inc. (NFLX) during 2017. The vertical
line is an entry from the entry rule “BuyDNCT.” Of the three buy
rules I tried, “BuyDNCT” showed the best backtest results with
an average per trade of 0.62% over the past 48 months trading the NASDAQ 100
list of stocks and exiting after a nine-bar hold.
!THE CAM INDICATOR FOR TRENDS AND COUNTERTRENDS
!Author: Barbara Star, TASC Jan 2018
!Coded by: Richard Denning 11/4/17
!www.tradersEdgeSystems.com

!SET PARAMETER FOR ADX IN CHARTS TO 10
!USE DEFAULT PARAMETERS IN CHARTS FOR MACD
CAM_UP if [adx]>=val([adx],1) and [macd]>val([macd],1).
CAM_PB if [adx]<=val([adx],1) and [macd]<val([macd],1).
CAM_DN if [adx]>=val([adx],1) and [macd]<val([macd],1).
CAM_CT if [adx]<=val([adx],1) and [macd]>val([macd],1).

CAM_IND is IFF(CAM_UP,2,IFF(CAM_DN,-2,IFF(CAM_PB,1,IFF(CAM_CT,-1,0)))).

BuyUp if CAM_UP and hasdatafor(120)>=100.
BuyPB if CAM_PB and hasdatafor(120)>=100.
BuyDNCT if valrule(CAM_DN,1) and CAM_CT and hasdatafor(120)>=100.
—Richard Denning
info@TradersEdgeSystems.com
for AIQ Systems
BACK TO LIST

TRADERSSTUDIO: JANUARY 2018
The TradersStudio code based on Barbara Star’s article in this issue, “The
CAM Indicator For Trends And Countertrends,” is provided at www.TradersEdgeSystems.com/traderstips.htm as
well as below.
The following files are included in the download:
- Function: CAM—Returns a number that is explained below
- Indicator plot: CAM_IND—Plots the CAM indicator on a chart
- System: CAM_DNCT—A trading system with a fixed-bar hold that uses
the CAM indicator or entry.
I created an indicator for the CAM that returns “2” for the CAM_UP,
a “1” for the CAM_PB, a “-1” for the CAM_CT, and a “-2” for
the CAM_DN. I also created a trading system that uses the CAM indicator and
ran backtests.
Figure 6 shows the CAM_IND indicator on a chart of the S&P 500 futures
contract (SP) for the last half of 2013. Several trades from the system are
shown on this chart. Using optimization of cam1, cam2 and exitBars, I found
the highest net profit from the system to be when cam1=-2, cam2=1, and exitBars
=12. The equity curve from trading one SP contract is shown in Figure 7.
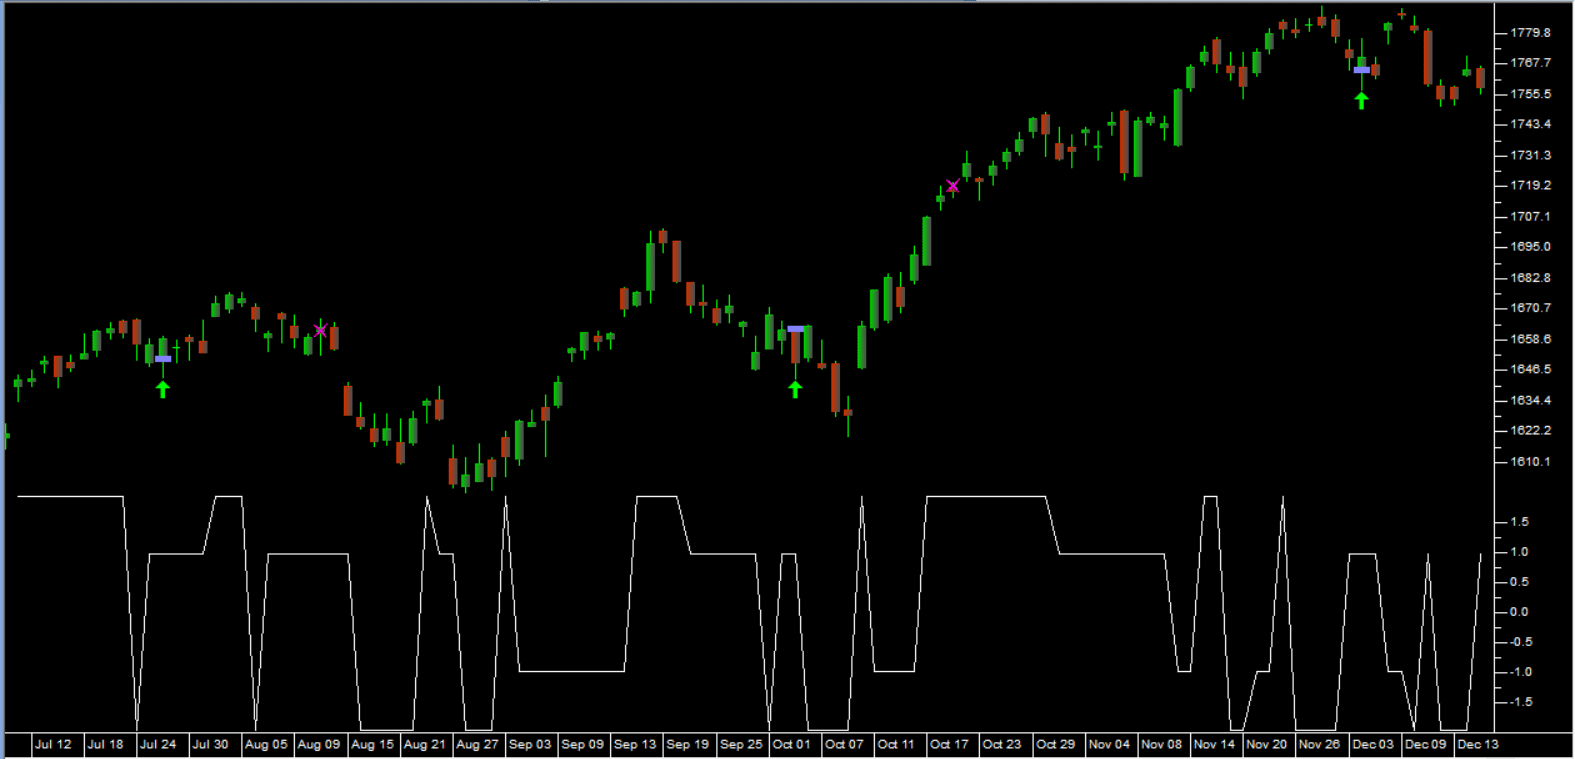
FIGURE 6: TRADERSSTUDIO, CAM_IND.
The CAM_IND indicator is shown on a chart of an S&P 500 futures contract
(SP) for the last half of 2013.
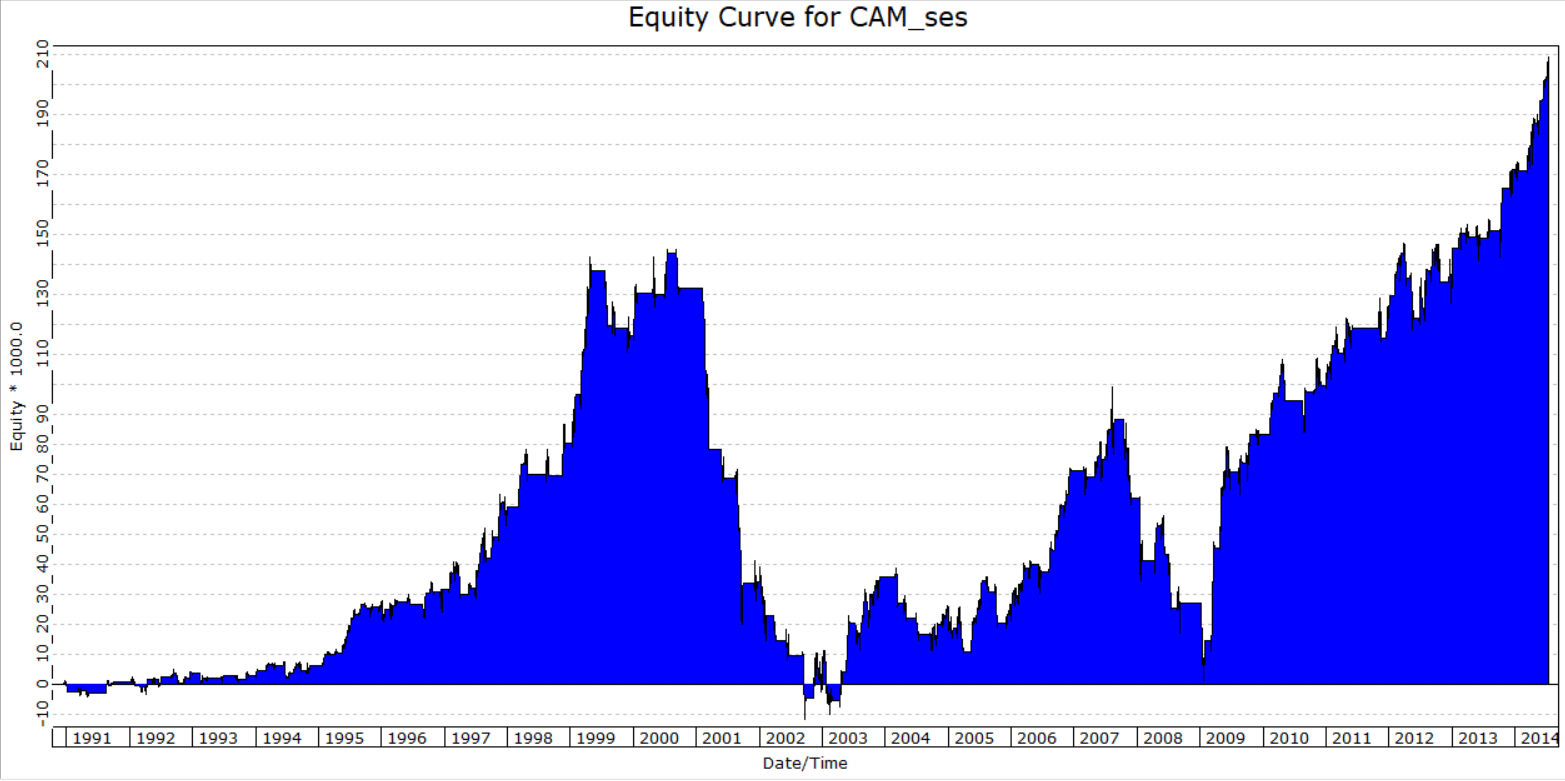
FIGURE 7: TRADERSSTUDIO, EQUITY
CURVE. Here is a sample equity curve trading one SP contract from 1991 to
2014.
The TradersStudio code is shown here:
'THE CAM INDICATOR FOR TRENDS AND COUNTERTRENDS
'Author: Barbara Star, TASC Jan 2018
'Coded by: Richard Denning 11/4/17
'www tradersEdgeSystems com

Function CAM(adxLen,macdLen1,macdLen2)
'adxLen=10,macdLen1=12,macdLen2=25
Dim theADX As BarArray
Dim theMACD As BarArray
Dim CAM_UP,CAM_PB,CAM_DN,CAM_CT
theADX = ADX(adxLen,0)
theMACD = MACD(C,macdLen1,macdLen2,0)
CAM_UP = theADX>=theADX[1] And theMACD>theMACD[1]
CAM_PB = theADX<=theADX[1] And theMACD<theMACD[1]
CAM_DN = theADX>=theADX[1] And theMACD<theMACD[1]
CAM_CT = theADX<=theADX[1] And theMACD>theMACD[1]

CAM = IIF(CAM_UP,2,IIF(CAM_DN,-2,IIF(CAM_PB,1,IIF(CAM_CT,-1,0))))

End Function
'----------------------------------------------------------------
'Indicator plot:
sub CAM_IND(adxLen,macdLen1,macdLen2)
plot1(CAM(adxLen,macdLen1,macdLen2))
End Sub
'----------------------------------------------------------------
'CAM trading systme (long only)
Sub CAM_DNCT(adxLen,macdLen1,macdLen2,cam1,cam2,exitBars)
'adxLen=10,macdLen1=12,macdLen2=25,cam1=-2,cam2=1,exitBars=12
Dim theCAM As BarArray
theCAM = CAM(adxLen,macdLen1,macdLen2)
If theCAM[1]=cam1 And theCAM=cam2 Then Buy("BuyDNCT",1,0,Market,Day)
If BarsSinceEntry>=exitBars Then ExitLong("LXtime","",1,0,Market,Day)
End Sub
'-----------------------------------------------------------------
—Richard Denning
info@TradersEdgeSystems.com
for TradersStudio
BACK TO LIST

NINJATRADER: JANUARY 2018
The CAM indicator, as discussed in the article “The CAM Indicator For
Trends And Countertrends” by Barbara Star in this issue, is available
for download at the following links for NinjaTrader 8 and NinjaTrader 7:
Once you have downloaded the file, you can import the indicator into NinjaTader
8 from within the Control Center by selecting Tools → Import → NinjaScript
Add-On and then selecting the downloaded file for NinjaTrader 8. To import
into NinjaTrader 7, from within the Control Center window, select the menu
File → Utilities → Import NinjaScript and select the downloaded file.
You can review the indicator’s source code in NinjaTrader 8 by selecting
the menu New → NinjaScript Editor → Indicators from within the Control
Center window and selecting the CAM file. You can review the indicator’s
source code in NinjaTrader 7 by selecting the menu Tools → Edit NinjaScript → Indicator
from within the Control Center window and selecting the CAM file.
NinjaScript uses compiled DLLs that run native, not interpreted, which provides
you with the highest performance possible.
A sample chart is shown in Figure 8.
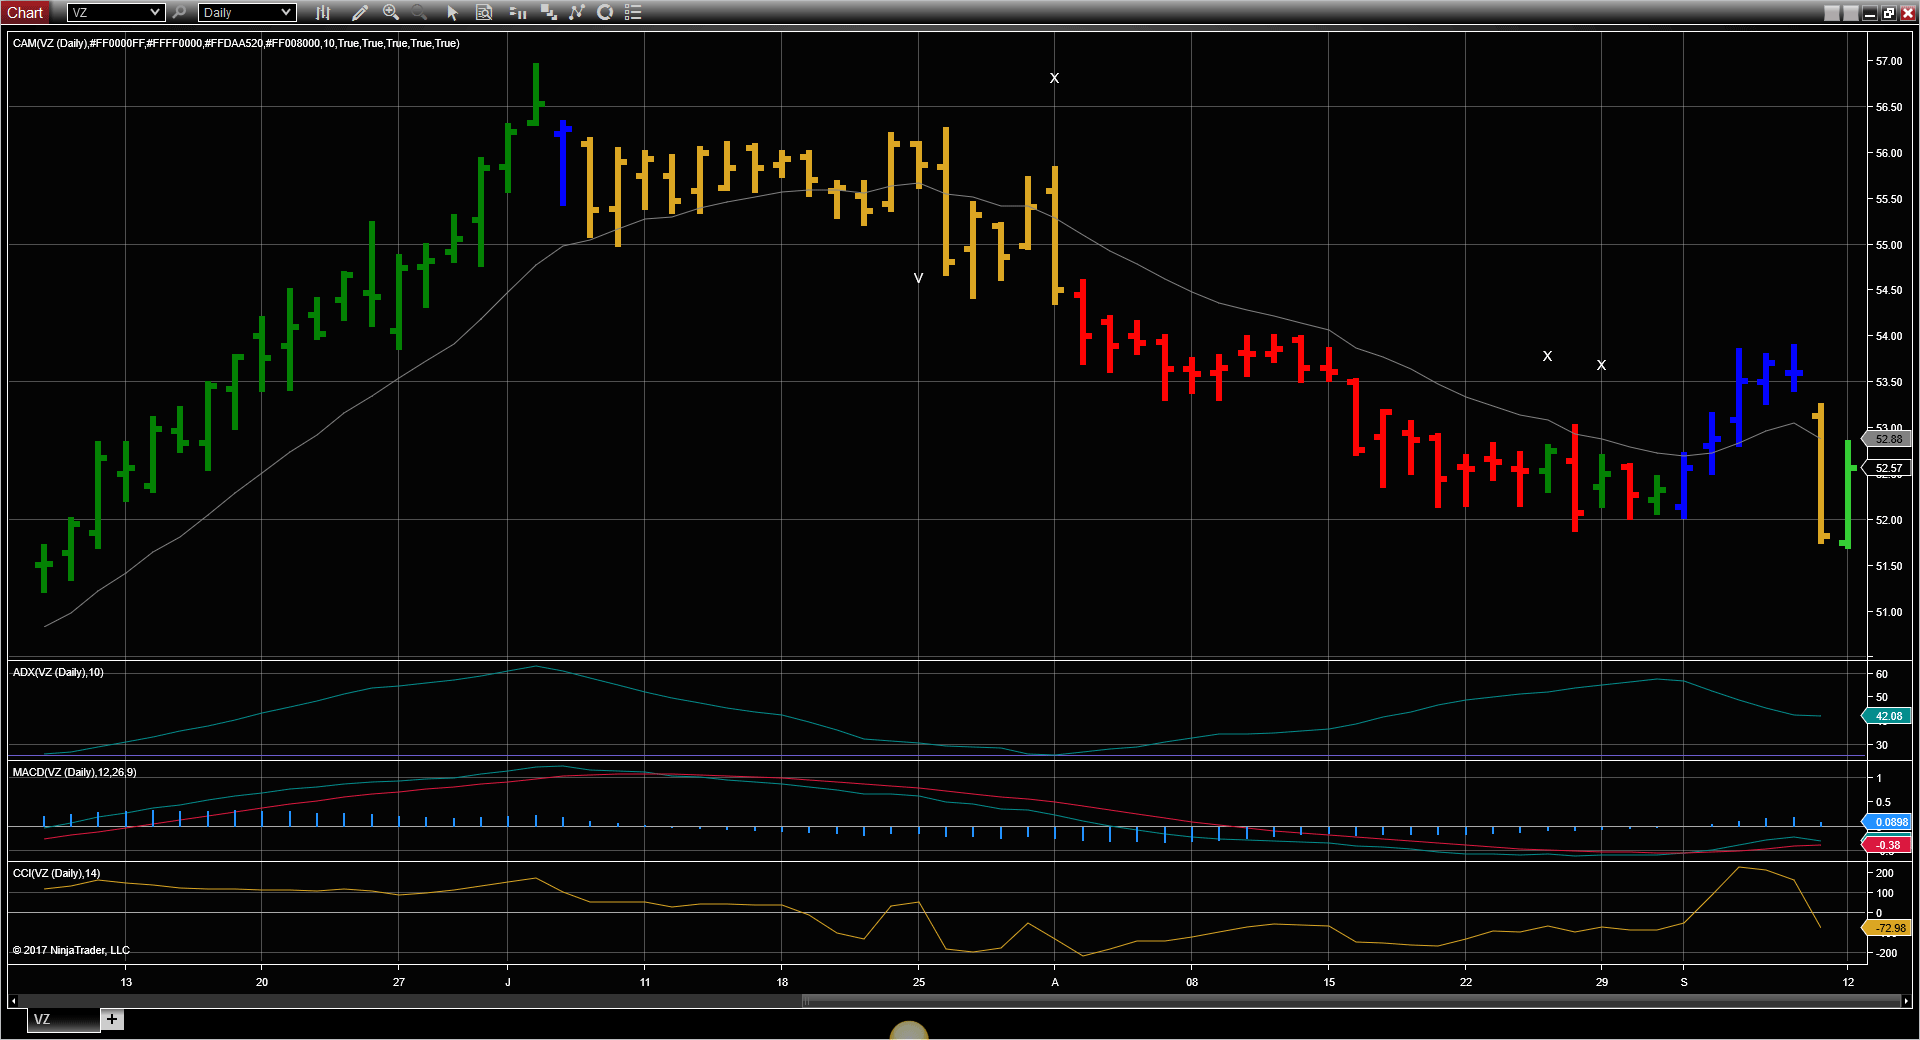
FIGURE 8: NINJATRADER. The CAM
indicator is displayed on the Verizon daily chart between May 2016 and September
2016 highlighting the signals with changes to the bar colors.
—Raymond Deux & Jim Dooms
NinjaTrader, LLC
www.ninjatrader.com
BACK TO LIST

TRADE NAVIGATOR: JANUARY 2018
We’re making available a file for download within the Trade Navigator
library to make it easy for users to implement the strategy discussed in “The
CAM Indicator For Trends And Countertrends” by Barbara Star in this issue.
The file name is “SC201801.” To download it, click on Trade Navigator’s
blue telephone button, select download special file, and replace the word “upgrade” with “SC201801” (without
the quotes). Then click the start button. When prompted to upgrade, click the
yes button. If prompted to close all software, click on the continue button.
Your library will now download.
This library contains a study named “CAM study,” the template “S&C
CAM Indicator,” and four highlight bars: CAM CT, CAM DN, CAM PB, and
CAM UP.
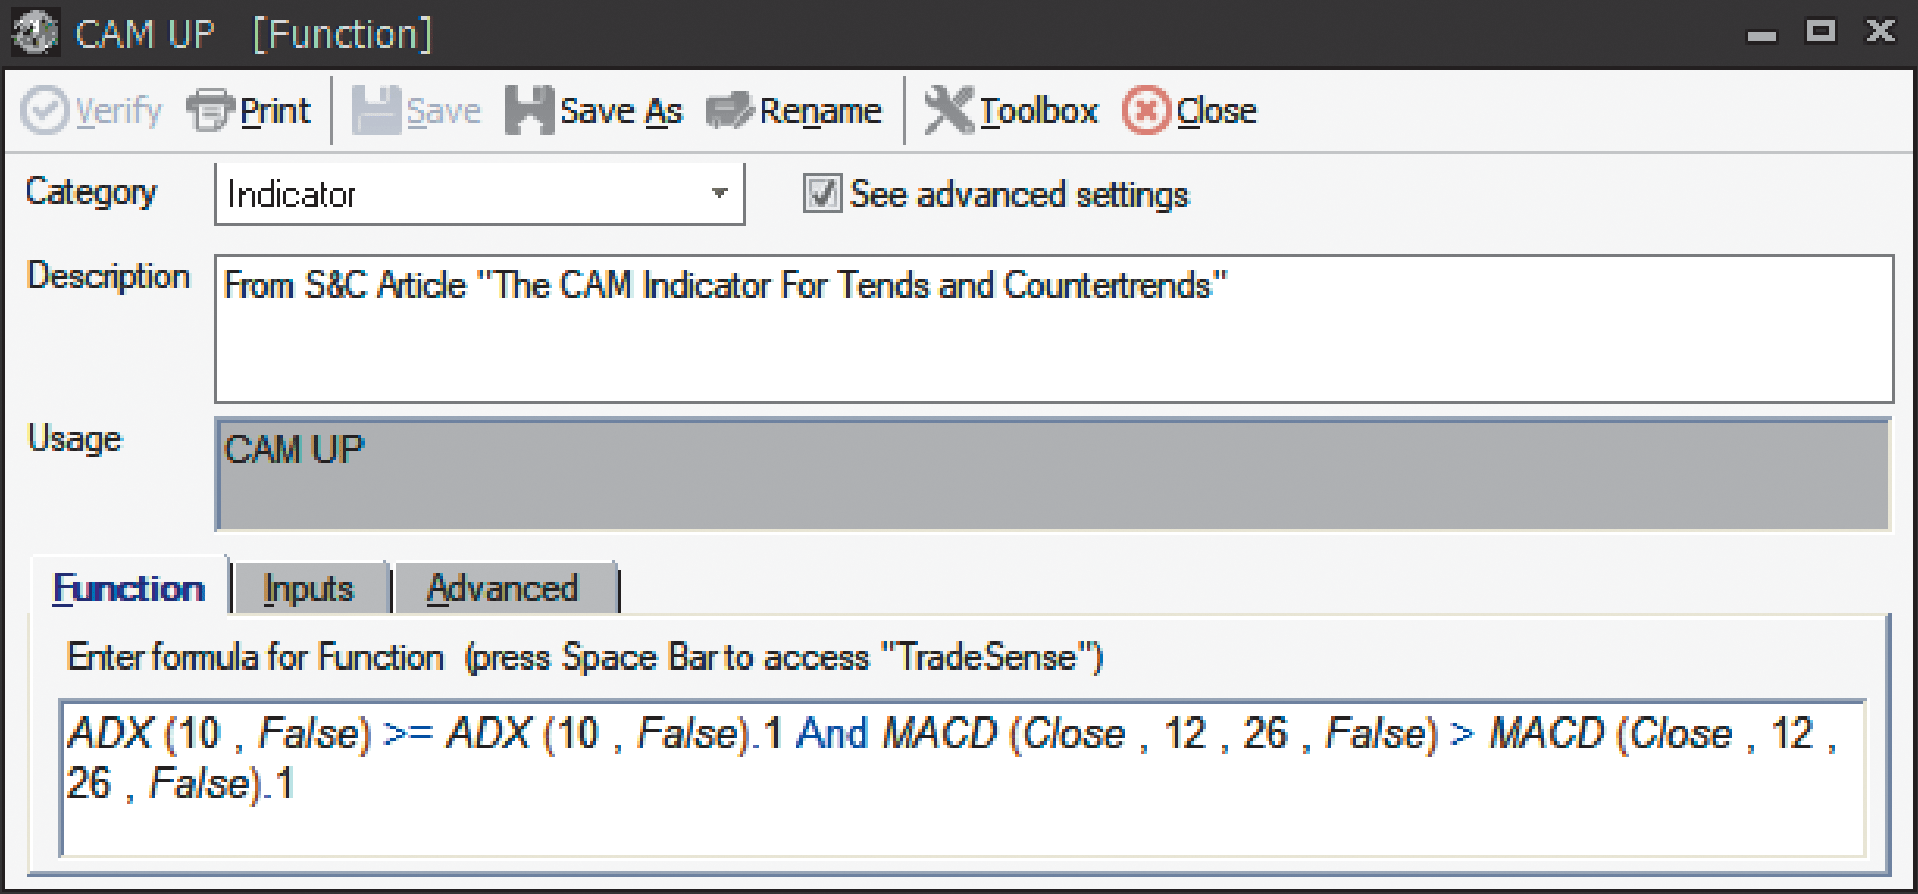
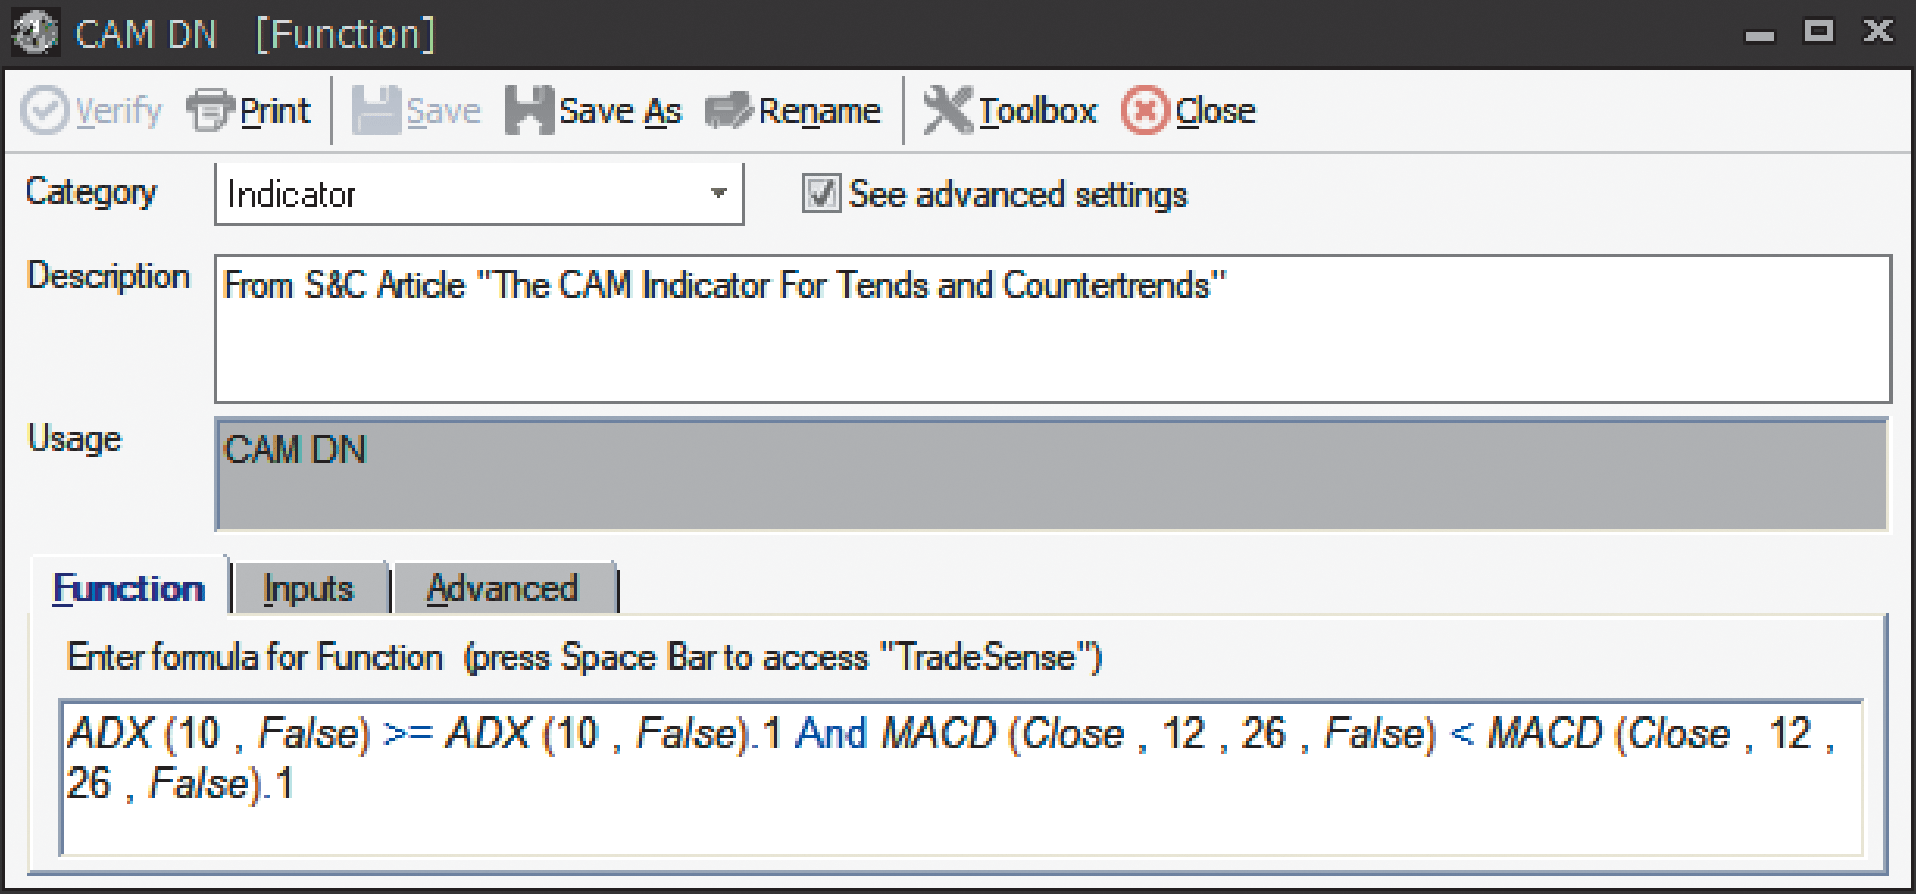
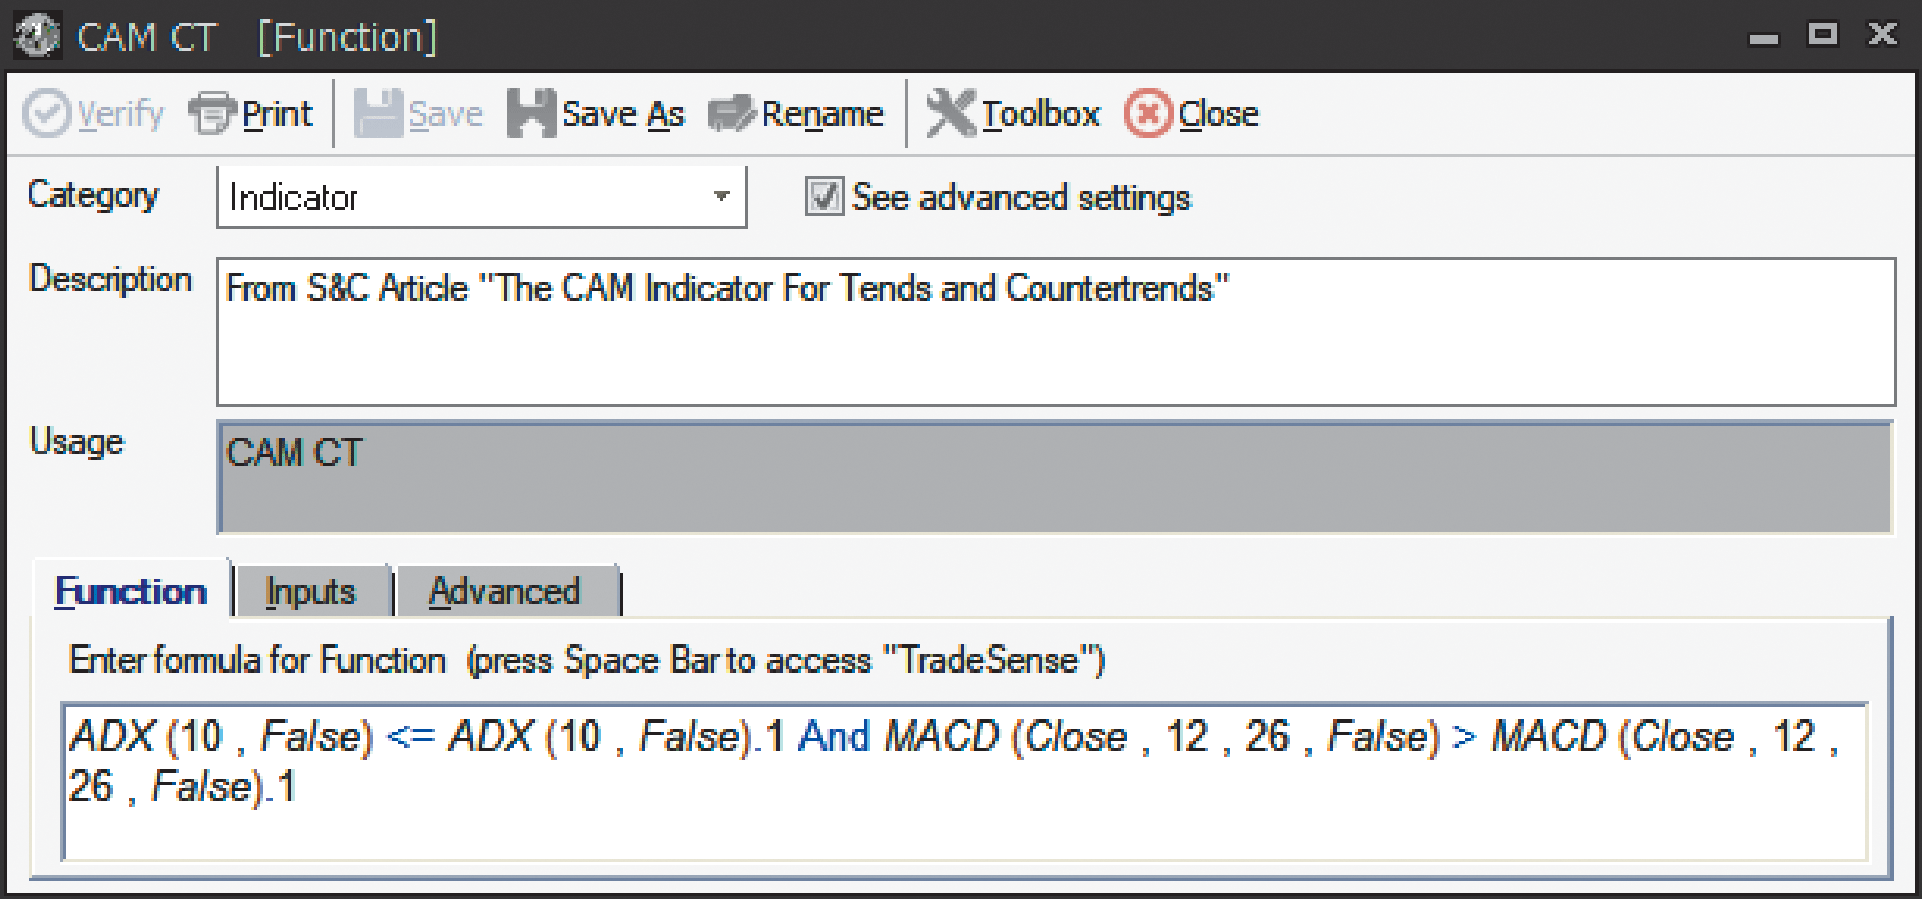
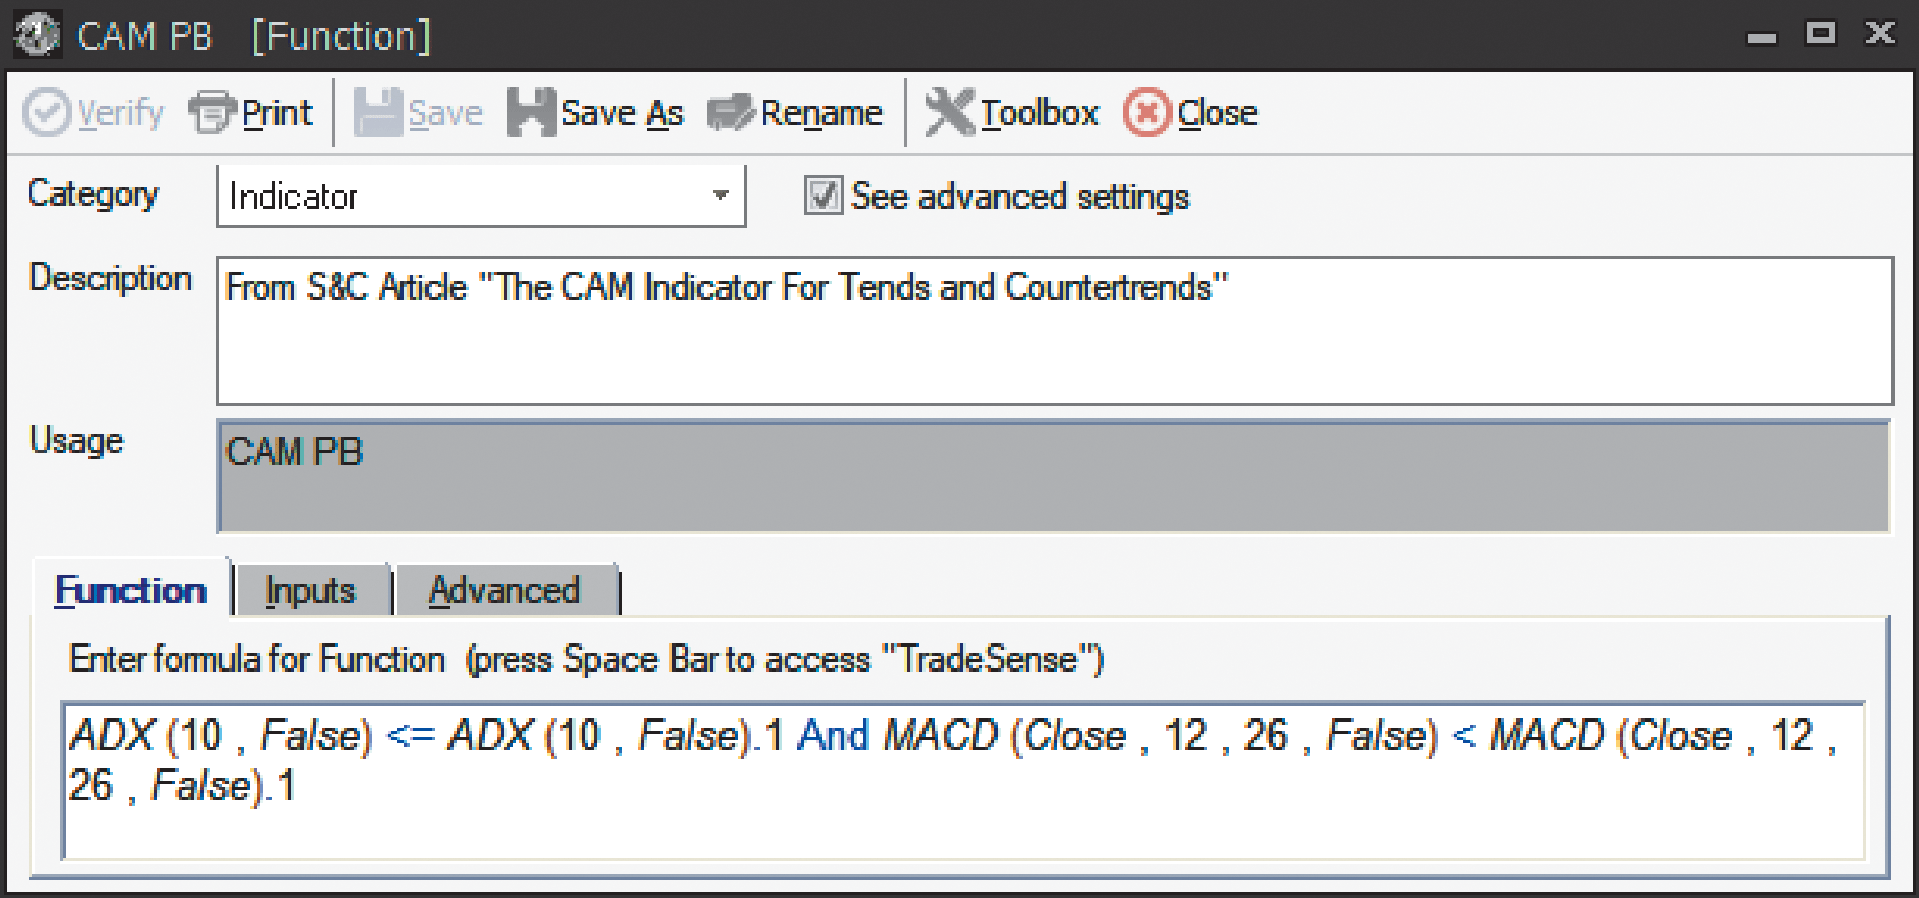
The TradeSense language for the highlight bars is shown in Figure 9.
Manually creating highlight bars
If you would like to create these highlight bars manually, click on the edit dropdown
menu, open the trader’s toolbox (or use CTRL + T) and click on the functions tab.
Next, click on the new button, and a new function dialog
window will open. In its text box, input the code for the indicator. Ensure
that there are no extra spaces at the end of each line. When completed, click
on the verify button. You may be presented with an add inputs pop-up
message if there are variables in the code. If so, click the yes button,
then enter a value in the default value column. If all is well, when
you click on the function tab, the code you entered will convert to
italic font. Click on the save button and type a name for the highlight
bar.
Adding to your chart
Once they’re completed, you can insert the highlight bars onto
your chart by opening the charting dropdown menu, selecting the add
to chart command, then, on the highlight bars tab, find your
named highlight bar. Select it, then click on the add button. Repeat
this procedure for more highlight bars if you wish.
The “S&C CAM indicator” template can be inserted
onto your chart by opening the charting dropdown menu, selecting the templates command,
then selecting the “S&C CAM Indicator” template. You can apply
the CAM study to your chart by opening the charting menu, selecting
the add to chart command, and clicking on the studies tab.
Here you will find the study in question. Select it by clicking on it, then
click the add button.
Users may contact our technical support staff by phone or by live chat if
any assistance is needed in creating or using the indicator or highlight bars.
A sample chart demonstrating the S&C CAM indicator template is shown in
Figure 10.
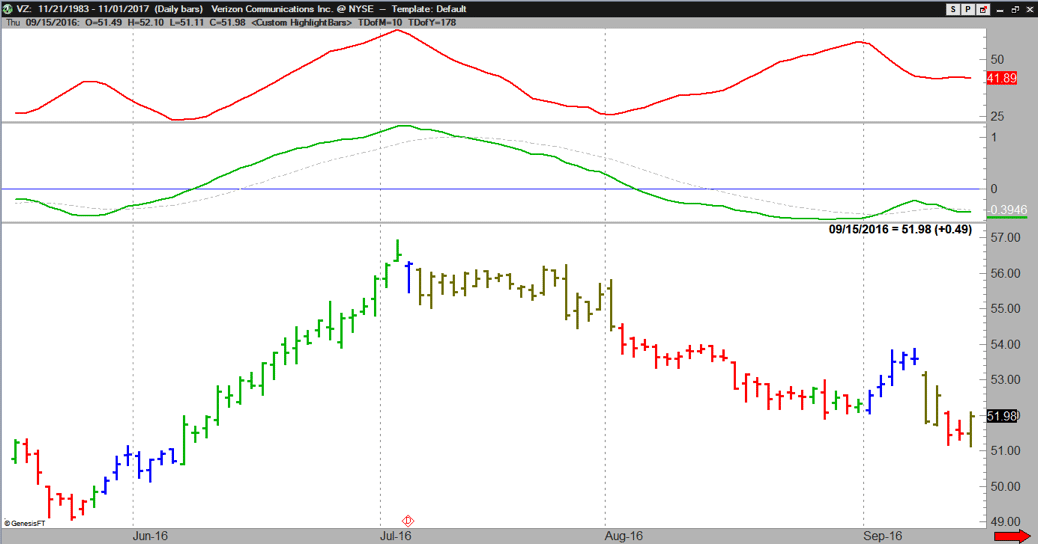
FIGURE 10: TRADE NAVIGATOR. The
S&C CAM indicator template is implemented on a sample chart.
—Genesis Financial Technologies
Tech support 719 884-0245
www.TradeNavigator.com
BACK TO LIST
MICROSOFT EXCEL: JANUARY 2018
Barbara Star’s article in this issue, “The CAM Indicator For Trends
And Countertrends,” looks for patterns to be found in the relative behaviors
of two well-known indicators—ADX and MACD.
In the article, Star shows a way of comparing them to pick out two main stages
of market trend (up/down) and two market pause situations (pullback/countertrend)
that might be interpreted as market indecision.
Star suggests that the addition of the CCI indicator and a 14-day moving average
can assist when attempting to filter out false patterns.
The spreadsheet file for this Traders’ Tip can be downloaded here. To
successfully download it, follow these steps:
- Right-click on the Excel
file link, then
- Select “save as” (or “save target as”) to place
a copy of the spreadsheet file on your hard drive.
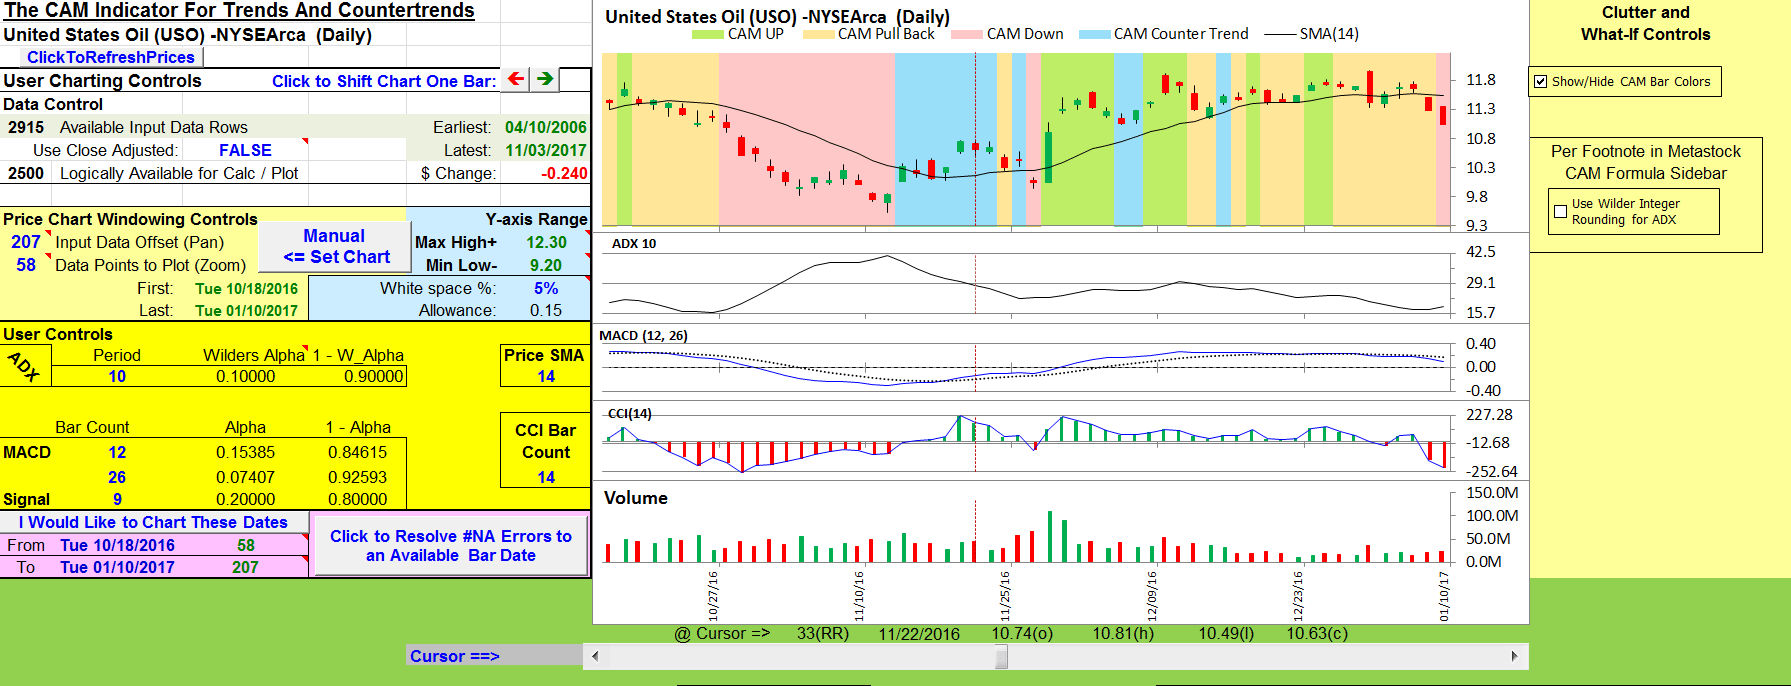
FIGURE 11: EXCEL. This chart approximates
Figure 5 from Barbara Star’s article in this issue, “The CAM
Indicator For Trends And Countertrends.”
A fix for previous Excel spreadsheets, required due to Yahoo modifications, can be found here: https://traders.com/files/Tips-ExcelFix.html
—Ron McAllister
Excel and VBA programmer
rpmac_xltt@sprynet.com
BACK TO LIST

METASTOCK: JANUARY 2018
The article “The CAM Indicator For Trends And Countertrends” by Barbara Star in this issue (January 2018 S&C) provides four custom formulas that are used to color the price bars that identify the CAM patterns. Given here are the steps to follow in MetaStock to color the CAM bars as described in the article.
Coloring the price bars as shown in the article requires that the formulas be placed in an Expert Advisor. The steps to follow are:
Creating the expert advisor:
Open the Expert Advisor. Click on new, give the Expert Advisor a name (for example, “CAM indicator”) then click the “highlights” tab.
Coloring the CAM-UP bars:
Select new from the menu on the right-hand side. This will open the experts highlights editor. Type in the name “CAM-UP.” Set the color option to green.
Type or paste the following custom formula into the condition box:
ADX(10)>=Ref(ADX(10),-1)AND When(MACD()>Ref(MACD(),-1))
Click OK.
Coloring the CAM-PB bars:
Select new from the menu on the right-hand side. Type in the name “CAM-PB.” Set the color option to yellow. Type or paste the following custom formula into the condition box:
ADX(10)<=Ref(ADX(10),-1)AND When(MACD()<Ref(MACD(),-1))
Click OK.
Coloring the CAM-DN bars:
Select new from the menu on the right-hand side. Type in the desired name, “CAM-DN.” Set the color option to red. Type or paste the following custom formula into the condition box:
ADX(10)>=Ref(ADX(10),-1)AND When(MACD()<Ref(MACD(),-1))
Click OK.
Coloring the CAM-CT bars:
Select new from the menu on the right-hand side. Type in the desired name, “CAM-CT.” Set the color option to blue. Type or paste the following custom formula into the condition box:
ADX(10)<=Ref(ADX(10),-1)AND When(MACD()>Ref(MACD(),-1))
Click OK.
Click on the small checkboxes to the left of each pattern name (that is, CAM-UP, CAM-PB, CAM-DN, CAM-CT) to select the CAM patterns you want to see colored on the price bars (see Figure 1). Hit OK to create the Expert Advisor.
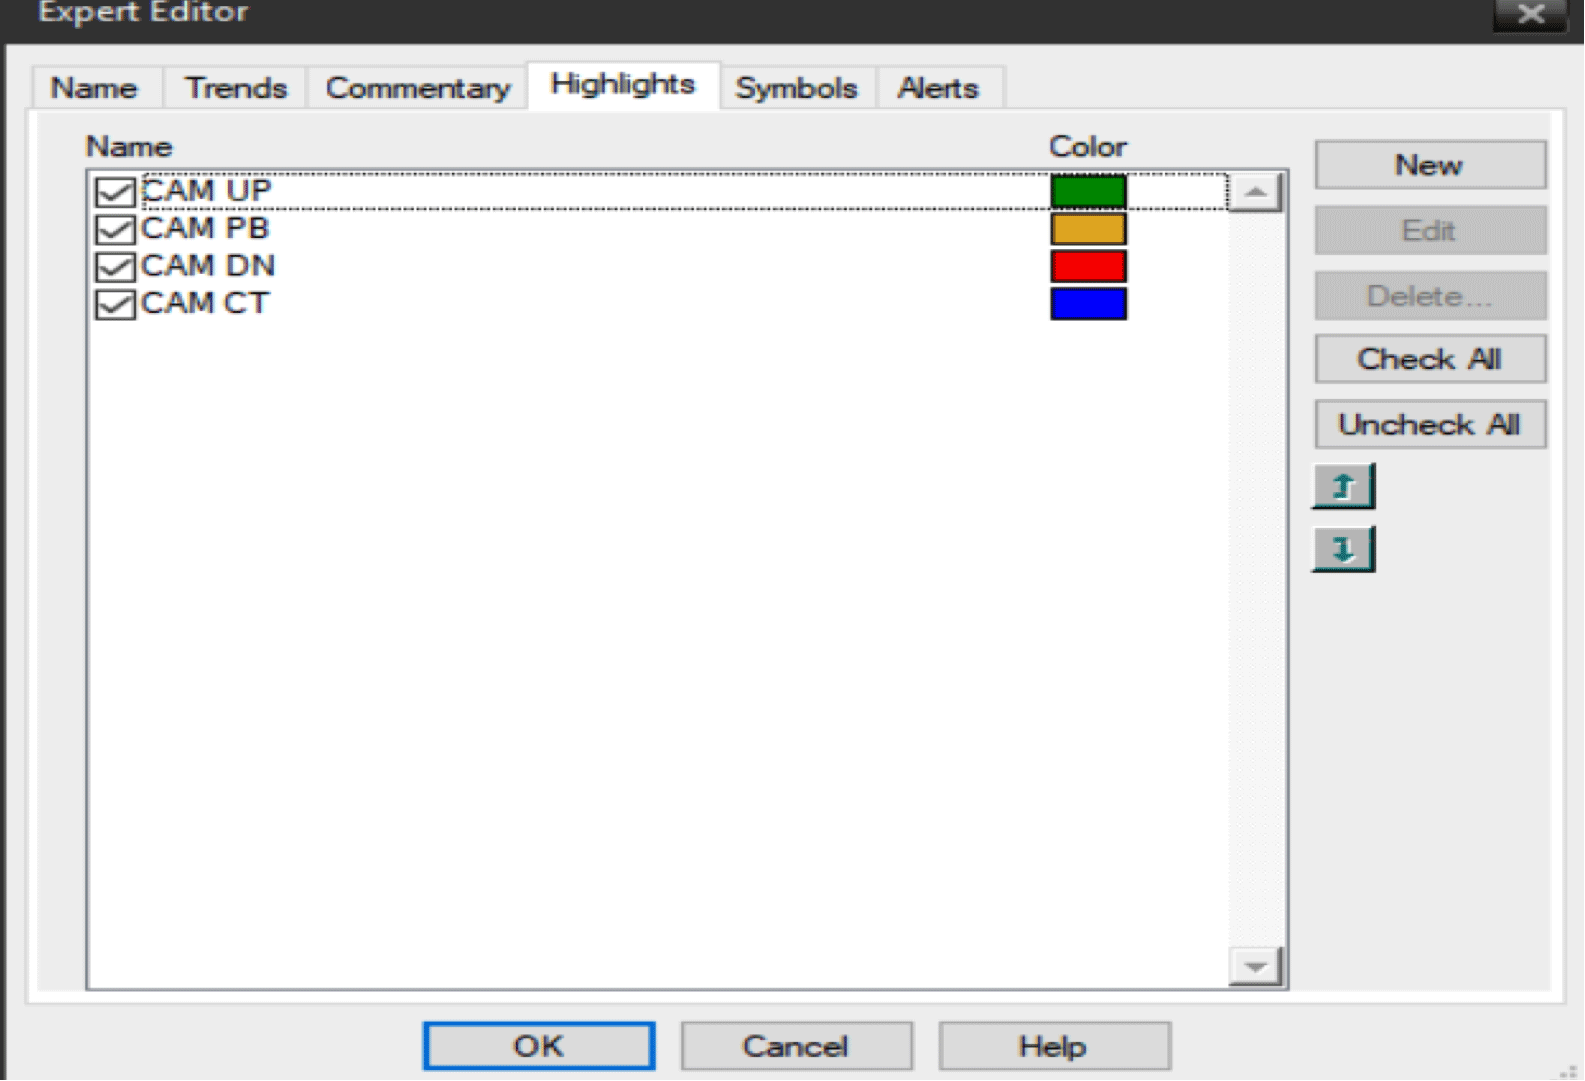
FIGURE 1: METASTOCK EXPERT ADVISOR. After entering the custom formulas into the condition box, click on the small checkboxes to the left of each pattern name (CAM-UP, CAM-PB, CAM-DN, CAM-CT, or however you have named them) to select the CAM patterns you want to see colored on the price bars.
—Barbara Star
star4070@aol.com
BACK TO LIST
Originally published in the January 2018 issue of
Technical Analysis of STOCKS & COMMODITIES magazine.
All rights reserved. © Copyright 2017, Technical Analysis, Inc.


