TRADERS’ TIPS
February 2018

For this month’s Traders’ Tips, the focus is Vitali Apirine’s article in this issue, “Weekly & Daily Percentage Price Oscillator.” Here, we present the February 2018 Traders’ Tips code with possible implementations in various software.
The Traders’ Tips section is provided to help the reader implement a selected technique from an article in this issue or another recent issue. The entries here are contributed by software developers or programmers for software that is capable of customization.

TRADESTATION: FEBRUARY 2018
In “Weekly & Daily Percentage Price Oscillator” in this issue, author Vitali Apirine expands on an idea he introduced in the December 2017 issue of STOCKS & COMMODITIES that used the classic MACD indicator. While the percentage price oscillator discussed in this issue and the MACD technique from his article December 2017 issue (“Weekly & Daily MACD”) are somewhat similar, Apirine notes that the percentage price oscillator has advantages when used with longer-term charts. In addition, the author shows that due to its construction, the percentage price oscillator is well-suited to comparing different securities, whereas the used of the MACD as described in his previous article is better suited to identifying overbought and oversold levels of a single security.
Here, we are providing some TradeStation EasyLanguage code for an indicator based on the author’s ideas.
Indicator: WeeklyAndDailyPPO

// TASC FEB 2018
// Weekly and Daily PPO
// Vitali Apirine

inputs:
	Price( Close ),
	WeeklyFastLength( 60 ),
	WeeklySlowLength( 130 ),
	DailyFastLength( 12 ),
	DailySlowLength( 26 ) ;

variables:
	WeeklyFastValue( 0 ),
	WeeklySlowValue( 0 ),
	DailyFastValue( 0 ),
	DailySlowValue( 0 ),
	WM( 0 ),
	DM( 0 ) ;

WeeklyFastValue =
	XAverage( Price, WeeklyFastLength ) ;
WeeklySlowValue =
	XAverage( Price, WeeklySlowLength ) ;
DailyFastValue =
	XAverage( Price, DailyFastLength ) ;
DailySlowValue =
	XAverage( Price, DailySlowLength ) ;

WM = iff( WeeklySlowValue <> 0, 100 *
	( WeeklyFastValue - WeeklySlowValue )
	/ WeeklySlowValue, 0 ) ;
DM = iff( WeeklySlowValue <> 0, 100 *
	( DailyFastValue - DailySlowValue )
	/ WeeklySlowValue, 0 ) ;

Plot1( WM, "Weekly PPO" ) ;
Plot2( WM + DM, "Daily PPO" ) ;
Plot3( 0, "ZL" ) ;
To download the EasyLanguage code please visit our TradeStation and EasyLanguage support forum. The files for this article can be found here: https://community.tradestation.com/Discussions/Topic.aspx?Topic_ID=142776. The filename is “TASC_FEB2018.ZIP.”
For more information about EasyLanguage in general, please see https://www.tradestation.com/EL-FAQ.
A sample chart is shown in Figure 1.

FIGURE 1: TRADESTATION. Here is a daily chart of EIX with the WeeklyAndDailyPPO indicator applied.
This article is for informational purposes. No type of trading or investment recommendation, advice, or strategy is being made, given, or in any manner provided by TradeStation Securities or its affiliates.
—Doug McCrary
TradeStation Securities, Inc.
www.TradeStation.com
BACK TO LIST

eSIGNAL: FEBRUARY 2018
For this month’s Traders’ Tip, we’ve provided a study based on the formula described in Vitali Apirine’s article in this issue, “Weekly & Daily Percentage Price Oscillator.” In the article, the author presents a modification of the percentage price oscillator.
The study contains formula parameters that may be configured through the edit chart window (right-click on the chart and select “edit chart”). A sample chart is shown in Figure 2.

FIGURE 2: eSIGNAL. Here is an example of the study plotted on a daily chart of $RUT.
To discuss this study or download a complete copy of the formula code, please visit the EFS library discussion board forum under the forums link from the support menu at www.esignal.com or visit our EFS KnowledgeBase at https://www.esignal.com/support/kb/efs/. The eSignal formula script (EFS) is also available for copying & pasting here:
/*********************************
Provided By:
eSignal (Copyright c eSignal), a division of Interactive Data
Corporation. 2016. All rights reserved. This sample eSignal
Formula Script (EFS) is for educational purposes only and may be
modified and saved under a new file name.  eSignal is not responsible
for the functionality once modified.  eSignal reserves the right
to modify and overwrite this EFS file with each new release.

Description:
    Weekly & Daily Percentage Price Oscillator by Vitali Apirine

Version:            1.00  12/04/2017

Formula Parameters:                     Default:
    Fast Length                         12
    Slow Length                         26
    Multiplier                          5


Notes:
The related article is copyrighted material. If you are not a subscriber
of Stocks & Commodities, please visit www.traders.com.

**********************************/

var fpArray = new Array();

function preMain() {

    setPriceStudy(false);
    setStudyTitle("W&D PPO");
    setCursorLabelName("WeeklyPPO", 0);
    setCursorLabelName("RelativePPO", 1);
    setDefaultBarFgColor(Color.RGB(0,148,255), 0);
    setDefaultBarFgColor(Color.RGB(255,106,0), 1);

    var x=0;

    fpArray[x] = new FunctionParameter("nFast", FunctionParameter.NUMBER);
    with(fpArray[x++]){
        setName("Fast Length");
        setLowerLimit(1);
        setDefault(12);
    }

    fpArray[x] = new FunctionParameter("nSlow", FunctionParameter.NUMBER);
    with(fpArray[x++]){
        setName("Slow Length");
        setLowerLimit(1);
        setDefault(26);
    }

    fpArray[x] = new FunctionParameter("nMult", FunctionParameter.NUMBER);
	with(fpArray[x++]){
        setLowerLimit(1);
        setDefault(5);
        setName("Multiplier");
    }

}

var bInit = false;
var bVersion = null;

var xSlowDailyEMA = null;
var xFastDailyEMA = null;
var xSlowWeeklyEMA = null;
var xFastWeeklyEMA = null;

var xDailyPPO = null;
var xWeeklyPPO = null;

function main (nFast, nSlow, nMult){

    if (bVersion == null) bVersion = verify();
    if (bVersion == false) return;

    if (getBarState() == BARSTATE_ALLBARS){
        bInit = false;
    }

    if (!bInit){

        xFastDailyEMA = ema(nFast);
        xSlowDailyEMA = ema(nSlow);
        xFastWeeklyEMA = ema(nFast * nMult);
        xSlowWeeklyEMA = ema(nSlow * nMult);

        xDailyPPO = efsInternal("CalcPPO", xFastDailyEMA, xSlowDailyEMA);
        xWeeklyPPO = efsInternal("CalcPPO", xFastWeeklyEMA, xSlowWeeklyEMA);
        addBand(0, PS_DASH, 1, Color.grey, 2);
        bInit = true;
    }

    var nDailyPPO = xDailyPPO.getValue(0);
    var nWeeklyPPO = xWeeklyPPO.getValue(0);

    if (nDailyPPO != null && nWeeklyPPO != null)
        return [nWeeklyPPO, (nWeeklyPPO + nDailyPPO)];
}

function CalcPPO (xFastEMA, xSlowEMA){

    var nFastEMA = xFastEMA.getValue(0);
    var nSlowEMA = xSlowEMA.getValue(0);

    if (nFastEMA != null && nSlowEMA != null)
        return ((nFastEMA - nSlowEMA) / nSlowEMA) * 100;
}

function verify(){

    var b = false;
    if (getBuildNumber() < 779){

        drawTextAbsolute(5, 35, "This study requires version 10.6 or later.",
            Color.white, Color.blue, Text.RELATIVETOBOTTOM|Text.RELATIVETOLEFT|Text.BOLD|Text.LEFT,
            null, 13, "error");
        drawTextAbsolute(5, 20, "Click HERE to upgrade.@URL=https://www.esignal.com/download/default.asp",
            Color.white, Color.blue, Text.RELATIVETOBOTTOM|Text.RELATIVETOLEFT|Text.BOLD|Text.LEFT,
            null, 13, "upgrade");
        return b;
    }
    else
        b = true;

    return b;
}
—Eric Lippert
eSignal, an Interactive Data company
800 779-6555, www.eSignal.com
BACK TO LIST

THINKORSWIM: FEBRUARY 2018
Thinkorswim has the ability to build the very weekly & daily percentage price oscillator studies that are featured in the article “Weekly & Daily Percentage Price Oscillator” by Vitali Apirine in this issue.
We built this study using our proprietary scripting language, thinkscript. We have made the loading process extremely easy—simply click on the link: https://tos.mx/sAv0RV and then choose to view the thinkScript strategy.
The chart in Figure 3 shows the WeeklyAndDailyPPO as well as the WeeklyAndDailyMACD plotted below a one-year daily chart of the Russell 2000 index.

FIGURE 3: THINKORSWIM. This sample chart shows the WeeklyAndDailyPPO as well as the WeeklyAndDailyMACD plotted below a one-year daily chart of the Russell 2000 index.
—thinkorswim
A division of TD Ameritrade, Inc.
www.thinkorswim.com
BACK TO LIST

NINJATRADER: FEBRUARY 2018
The WnDPPO indicator, as discussed in the article “Weekly & Daily Percentage Price Oscillator” by Vitali Apirine in this issue, is available for download at the following links for NinjaTrader 8 and NinjaTrader 7:
Once you’ve downloaded the file, you can import the indicator into NinjaTader 8 from within the Control Center by selecting Tools → Import → NinjaScript Add-On and then selecting the downloaded file for NinjaTrader 8. To import into NinjaTrader 7, from within the Control Center window, select the menu File → Utilities → Import NinjaScript and select the downloaded file.
You can review the indicator’s source code in NinjaTrader 8 by selecting the menu New → NinjaScript Editor → Indicators from within the Control Center window and selecting the WnDPPO file. You can review the indicator’s source code in NinjaTrader 7 by selecting the menu Tools → Edit NinjaScript → Indicator from within the Control Center window and selecting the WnDPPO file.
NinjaScript uses compiled DLLs that run native, not interpreted, which provides you with the highest performance possible.
A sample chart displaying the indicator can be seen in Figure 4.
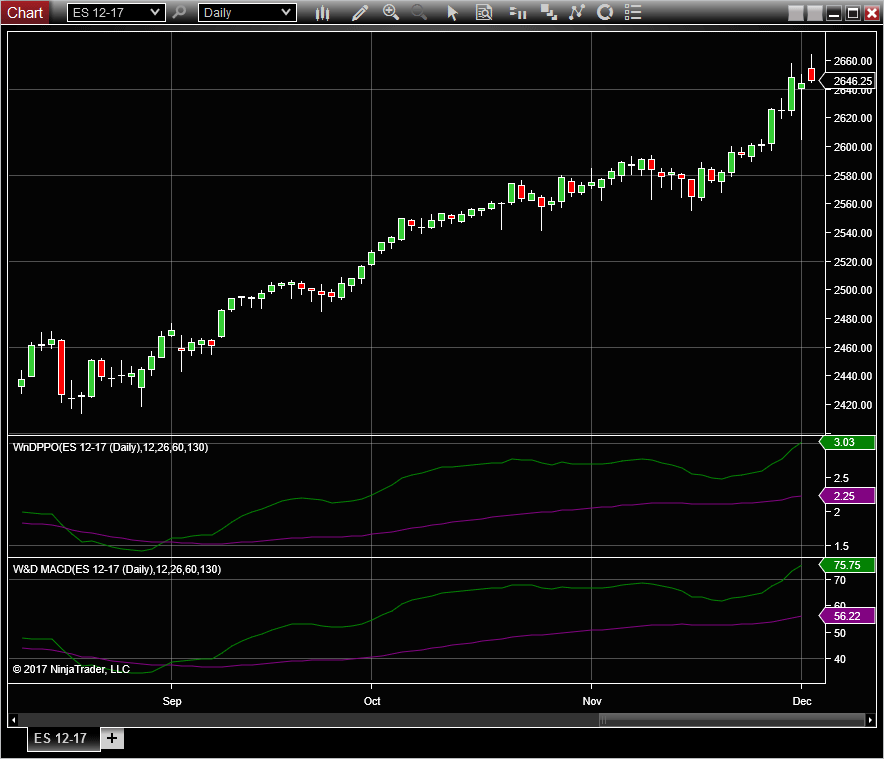
FIGURE 4: NINJATRADER. The WnDPPO indicator is shown alongside the W&D MACD indicator on a daily ES chart between August and December 2017.
—Raymond Deux & Jim Dooms
NinjaTrader, LLC
www.ninjatrader.com
BACK TO LIST

WEALTH-LAB: FEBRUARY 2018
The weekly & daily PPO (W&D PPO) oscillator described by Vitali Apirine in his article in this issue, “Weekly & Daily Percentage Price Oscillator,” combines the two PPO oscillators (weekly and daily) on a daily chart (Figure 5).

FIGURE 5: WEALTH-LAB. Here’s an example of the oscillators applied to a daily chart of ^RUT (Russell 2000).
After updating our TASCIndicators library to v2018.01 (or higher), the RelativeDailyPPO and WeeklyPPO indicators can be found under the TASC Magazine Indicators group. You can plot them on a chart or use as an entry or exit condition in a rule-based strategy without having to program any code yourself.
The following strategy code will help you plot the indicators on a chart:
using System;
using System.Collections.Generic;
using System.Text;
using System.Drawing;
using WealthLab;
using WealthLab.Indicators;
using TASCIndicators;

namespace WealthLab.Strategies
{
	public class MyStrategy : WealthScript
	{
		private StrategyParameter paramDailyLength1;
		private StrategyParameter paramDailyLength2;
		private StrategyParameter paramWeeklyLength1;
		private StrategyParameter paramWeeklyLength2;

		public MyStrategy()
		{
			paramDailyLength1 = CreateParameter("Daily Length 1",12,2,300,20);
			paramDailyLength2 = CreateParameter("Daily Length 2",26,2,300,20);
			paramWeeklyLength1 = CreateParameter("Weekly Length 1",60,2,300,20);
			paramWeeklyLength2 = CreateParameter("Weekly Length 2",130,2,300,20);
		}

		protected override void Execute()
		{
			var RDM = RelativeDailyPPO.Series(Close,paramDailyLength1.ValueInt,paramDailyLength2.ValueInt,
				paramWeeklyLength1.ValueInt,paramWeeklyLength2.ValueInt);
			var WM = WeeklyPPO.Series(Close,paramWeeklyLength1.ValueInt,paramWeeklyLength2.ValueInt);

			HideVolume(); LineStyle solid = LineStyle.Solid;
			ChartPane paneWDPPO = CreatePane( 40,true,true );

			PlotSeries( paneWDPPO,RDM,Color.FromArgb(255,0,100,0),LineStyle.Solid,2 );
			PlotSeries( paneWDPPO,WM,Color.FromArgb(255,0,0,0),LineStyle.Solid,2 );
			DrawHorzLine( paneWDPPO,0,Color.Blue,LineStyle.Solid,1 );
		}
	}
}
—Eugene (Gene Geren), Wealth-Lab team
MS123, LLC
www.wealth-lab.com
BACK TO LIST

NEUROSHELL TRADER: FEBRUARY 2018
The weekly and daily percent price oscillator described by Vitali Apirine in his article in this issue can be easily implemented with a few of NeuroShell Trader’s 800+ indicators. Simply select new indicator from the insert menu and use the indicator wizard to set up the following indicators:
WM:	Multiply( Divide( Subtract( ExpAvg(Close, 60), ExpAvg(Close, 130) ), ExpAvg(Close, 130) ),100)

DM:	Multiply( Divide( Subtract( ExpAvg(Close, 12), ExpAvg(Close, 26) ), ExpAvg(Close, 130) ),100)

WM+DM:	Add2( WM, DM )
Users of NeuroShell Trader can go to the Stocks & Commodities section of the NeuroShell Trader free technical support website to download a copy of this or any previous Traders’ Tips.
A sample chart is shown in Figure 6.

FIGURE 6: NEUROSHELL TRADER. This NeuroShell Trader chart shows the weekly and daily percent price oscillator.
—Marge Sherald, Ward Systems Group, Inc.
301 662-7950, sales@wardsystems.com
www.neuroshell.com
BACK TO LIST

UPDATA: FEBRUARY 2018
This month’s Traders’ Tip is based on the article by Vitali Apirine in this issue, “Weekly & Daily Percentage Price Oscillator.”
In the article, Apirine proposes refinements to traditional daily and weekly timeframed oscillators constructed from different-period exponential averages, summing them to produce an oscillator that highlights divergences with price action in a clearer way.
The Updata code based on this article is in the Updata library and may be downloaded by clicking the custom menu and indicator library. Those who cannot access the library due to a firewall may paste the code shown here into the Updata custom editor and save it.
PARAMETER "Period 1" #PERIOD1=60
PARAMETER "Period 2" #PERIOD2=130
PARAMETER "Period 3" #PERIOD3=12
PARAMETER "Period 4" #PERIOD4=12
NAME "W&D PPO" ""
@WM=0
@DM=0
FOR #CURDATE=0 TO #LASTDATE
   @WM=100*(EAVE(#PERIOD1)-EAVE(#PERIOD2))/EAVE(#PERIOD2)
   @DM=100*(EAVE(#PERIOD3)-EAVE(#PERIOD4))/EAVE(#PERIOD2)
   @PLOT=@WM+@DM
NEXT
A sample chart is shown in Figure 7.
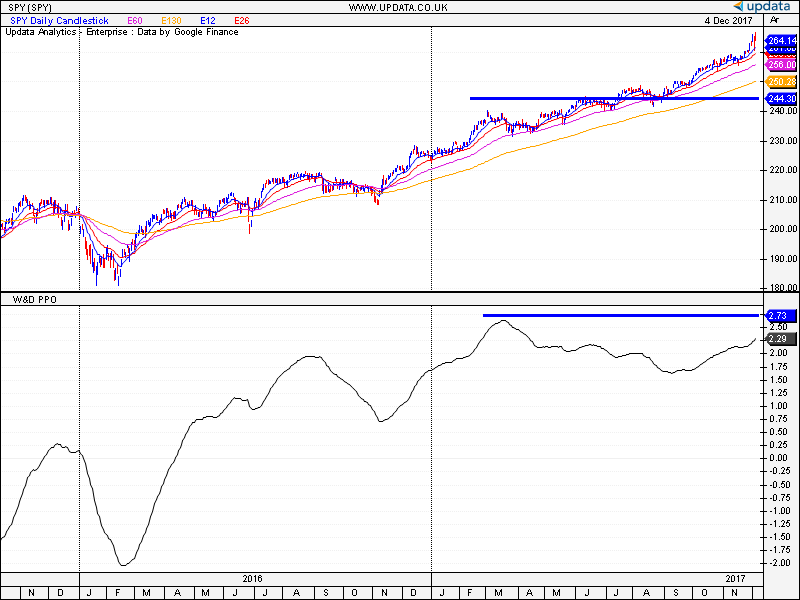
FIGURE 7: UPDATA. Here, the W&D PPO is applied to the ETF SPY in daily resolution. Divergence with the underlying price action and indicator is shown with the blue horizontal.
—Updata support team
support@updata.co.uk
www.updata.co.uk
BACK TO LIST

QUANTACULA: FEBRUARY 2018
We’ve implemented the weekly and daily PPO indicators that are discussed in “Weekly & Daily Percentage Price Oscillator” by Vitali Apirine in this issue as a free extension in Quantacula Studio and the Quantacula website.
If you want to use the indicators when building models on the Quantacula website, simply locate the extension in the Market Place, and press the add button (Figure 8).
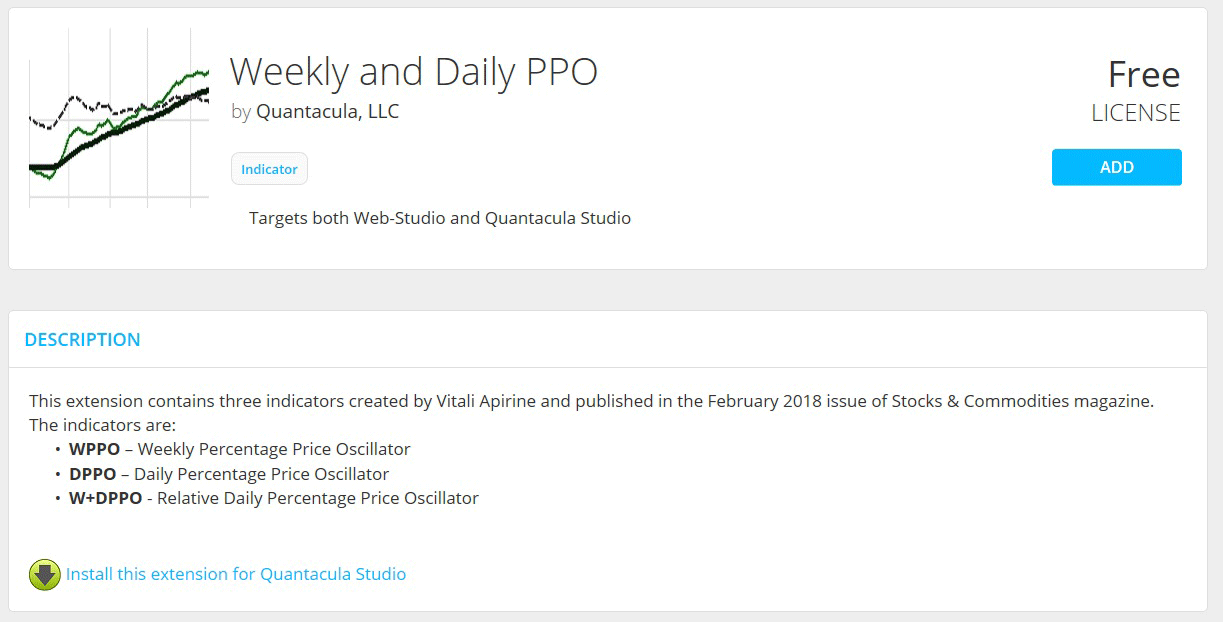
FIGURE 8: Quantacula. This screenshot shows how to add the weekly and daily PPO indicator extension from the Quantacula.com website.
You can also install the extension onto your computer if you are using Quantacula Studio. Click the install link on the product’s page to install the extension. The next time you open Quantacula Studio, you will see three new indicators in your indicator list: WPPO, DPPO, and W+DPPO. Use these indicators as you would any other—drag and drop them onto charts, use them in building block conditions, and in your C# coded models. Figure 9 demonstrates a model that uses WPPO to identify uptrends and downtrends.
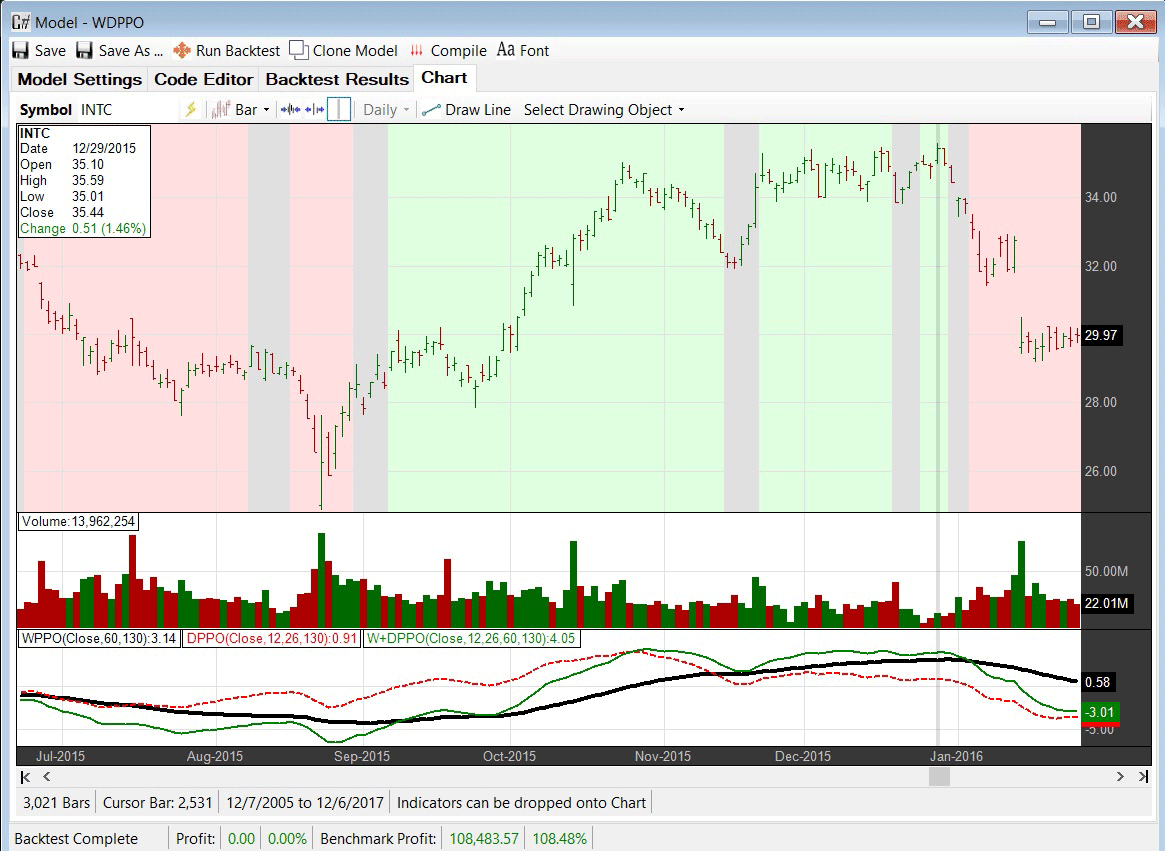
FIGURE 9: Quantacula. In this example chart, WPPO is used to indicate uptrends and downtrends.
using QuantaculaBacktest;
using QuantaculaCore;
using QuantaculaIndicators;
using System.Drawing;
using WandDPPO;

namespace Quantacula
{
    public class MyModel : UserModelBase
    {
        //create indicators and other objects here, this is executed prior to the main trading loop
        public override void Initialize(BarHistory bars)
        {
wppo = new WPPO(bars.Close, 60, 130);
	dppo = new DPPO(bars.Close, 12, 26, 130);
	wdppo = new WDPPO(bars.Close, 12, 26, 60, 130);
	Plot(wppo);
	Plot(dppo);
	Plot(wdppo);
        }

        //determine trend and set background color
        public override void Execute(BarHistory bars, int idx)
        {
	bool uptrend = ConsecUp.Calculate(idx, wppo, 1) >= 4;
	bool downtrend = ConsecDown.Calculate(idx, wppo, 1) >= 4;
	if (uptrend)
		SetBackgroundColor(idx, Color.FromArgb(220, 255, 220));
	else if (downtrend)
		SetBackgroundColor(idx, Color.FromArgb(255, 220, 220));
	else
		SetBackgroundColor(idx, Color.FromArgb(220, 220, 220));
        }

        //declare private variables below
        WPPO wppo;
        DPPO dppo;
        WDPPO wdppo;
    }
}
—Dion Kurczek, Quantacula
info@quantacula.com
www.quantacula.com
BACK TO LIST

AIQ: FEBRUARY 2018
The AIQ code based on Vitali Apirine’s article in this issue, “Weekly & Daily Percentage Price Oscillator,” is provided at www.TradersEdgeSystems.com/traderstips.htm, and is also shown here:
!WEEKLY & DAILY PPO
!Author: Vitali Apirine, TASC Feb 2018
!Coded by: Richard Denning 12/17/17
!www.TradersEdgeSystems.com

!INPUTS:
S is 12.
L is 26.

EMA1 is expavg([Close],S).
EMA2 is expavg([Close],L).
EMA3 is expavg([Close],S*5).
EMA4 is expavg([Close],L*5).
DM is (EMA1 - EMA2)/EMA4*100.
WM is (EMA3 - EMA4)/EMA4*100.
WD_PPO is WM + DM.
Figure 10 shows the daily and weekly PPO indicator on a chart of the Nasdaq 100 index (NDX) from 2015 to 2017.

FIGURE 10: AIQ. Here, the daily & weekly PPO is displayed on a chart of the NDX.
—Richard Denning
info@TradersEdgeSystems.com
for AIQ Systems
BACK TO LIST

AMIBROKER: FEBRUARY 2018
In “Weekly & Daily Percentage Price Oscillator” in this issue, author Vitali Apirine presents an EMA-based price oscillator. The code listing shown below contains a ready-to-use formula for AmiBroker. To adjust the parameters, right-click on the chart and select parameters from the context menu.
AmiBroker code

l1 = Param("Length1", 60, 1, 100 );
l2 = Param("Length2", 130, 1, 100 );
l3 = Param("Length3", 12, 1, 100 );
l4 = Param("Length4", 26, 1, 100 );


wm = 100 * ( EMA( C, l1 ) - EMA( C, l2 ) ) / EMA( C, l2 ) ;
dm = 100 * ( EMA( C, l3 ) - EMA( C, l4 ) ) / EMA( C, l2 );

Plot( wm, "WM"+_PARAM_VALUES(), colorREd );
Plot( wm+dm, "WM+DM", colorGreen );
Plot( 0, "", colorBlue, styleNoLabel );
A sample chart is shown in Figure 11.
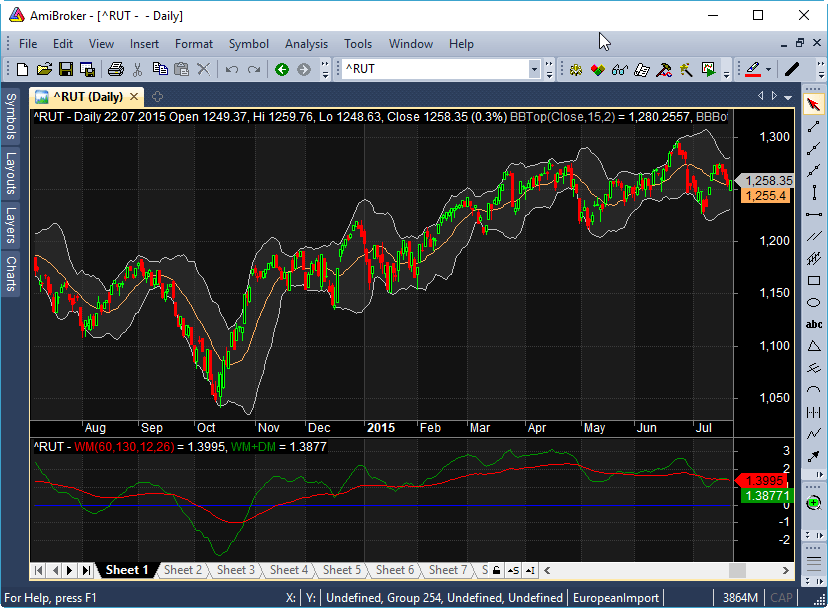
FIGURE 11: AMIBROKER. Here is a daily chart of the Russell 2000 (upper pane) with a WM-PPO chart in the lower pane, reproducing a chart from Vitali Apirine’s article in this issue.
—Tomasz Janeczko, AmiBroker.com
www.amibroker.com
BACK TO LIST
MICROSOFT EXCEL: FEBRUARY 2018
In “Weekly & Daily Percentage Price Oscillator” in this issue, author Vitali Apirine builds on the two MACD series that he discussed in his December 2017 S&C article, “Weekly & Daily MACD.” He does this by normalizing them into self-relative percentages using the slowest EMA as the divisor in common. This normalizes the scale of PPO values across periods of strong trends and sideways movements.
The resulting W&D PPO chart is very similar to the W&D MACD chart, as can be seen in Apirine’s Figure 2, which I have replicated in Figure 12 here. This similarity is clearly visible over relatively short intervals.

FIGURE 12: EXCEL. Here, you can see the similarity in shape between the D&W PPO and the D&W MACD.
When plotted over longer periods, the PPO vertical span of values is fairly constant. On the other hand, the MACD vertical span is sensitive to long-term up and down trends, as seen in the article’s Figure 3 of the S&P 500. That S&P 500 chart is rather massive, so I found CASY to illustrate the same point more compactly here in my Figure 13.

FIGURE 13: EXCEL. Over longer periods, the pattern similarity is still there but the MACD vertical scale can be quite variable and make portions of the MACD pattern difficult to discern, as seen in the left portion of this chart.
Zooming in to the left portion of the chart where the MACD was a bit muddy in Aprine’s Figure 2 and letting the MACD chart self-scale to use all of the available vertical space, we can once again see the pattern similarity (Figure 14). Note that the PPO scale does not change in this instance.

FIGURE 14: EXCEL. Here, I’ve zoomed in and used a shorter timespan to illustrate the similarity in the MACD when viewed at the finer scale.
In his article in this issue, Apirine improves on the MACD. The strength of the PPO is the vertical scale consistency over time, which means visibility.
The rules developed in his December 2017 article on W&D MACD to interpret the relative positions of the indicator lines can be carried forward to the relative positions of the PPO indictors. Adding to that, he also brought out a couple of refinements in this article. One such refinement is using the PPO indicators to compare the relative performance of a pair of tradable assets.
The spreadsheet file for this Traders’ Tip can be downloaded here. To successfully download it, follow these steps:
- Right-click on the Excel file link, then
- Select “save as” (or “save target as”) to place a copy of the spreadsheet file on your hard drive.
A fix for previous Excel spreadsheets, required due to Yahoo modifications, can be found here: https://traders.com/files/Tips-ExcelFix.html
—Ron McAllister
Excel and VBA programmer
rpmac_xltt@sprynet.com
BACK TO LIST

TRADERSSTUDIO: FEBRUARY 2018
The TradersStudio code based on Vitali Apirine’s article in this issue, “Weekly & Daily Percentage Price Oscillator,” is provided at www.TradersEdgeSystems.com/traderstips.htm as well as below.
'WEEKLY & DAILY PPO
'Author: Vitali Apirine, TASC Feb 2017
'Coded by: Richard Denning 12/20/17
'www.TradersEdgeSystems.com

Function WD_PPO(len1,len2,byref WM)
Dim EMA1 As BarArray
Dim EMA2 As BarArray
Dim EMA3 As BarArray
Dim EMA4 As BarArray
EMA1 = XAverage(C,len1)
EMA2 = XAverage(C,len2)
EMA3 = XAverage(C,len1*5)
EMA4 = XAverage(C,len2*5)
Dim DM As BarArray
'Dim WM As BarArray
DM = (EMA1-EMA2)/EMA4*100
WM = (EMA3-EMA4)/EMA4*100
WD_PPO = WM + DM
End Function
'--------------------------------------
'indicator plot
Sub WD_PPO_IND(len1,len2)
Dim WM As BarArray
Dim myPPO As BarArray
myPPO = WD_PPO(len1,len2,WM)
plot1(myPPO)
plot2 (WM)
End Sub
'--------------------------------------
Figure 15 shows the daily and weekly PPO indicator on a TradersStudio chart of the S&P 500 futures contract (SP) starting in 2007.

FIGURE 15: TRADERSSTUDIO. Here, the daily & weekly PPO is displayed on a chart of the S&P 500 futures contract (SP). White line = WD_PPO, yellow line = weekly PPO.
—Richard Denning
info@TradersEdgeSystems.com
for TradersStudio
BACK TO LIST
Originally published in the February 2018 issue of
Technical Analysis of STOCKS & COMMODITIES magazine.
All rights reserved. © Copyright 2018, Technical Analysis, Inc.


