TRADERS’ TIPS
APRIL 2018

For this month’s Traders’ Tips, the focus is Vitali Apirine’s
article in this issue, “Adaptive Moving Averages.” Here, we present
the April 2018 Traders’ Tips code with possible implementations in
various software.
You can right-click on any chart to open it in a new tab or window
and view it at it’s originally supplied size, often much larger than
the version printed in the magazine.
The Traders’ Tips section is provided to help the reader implement
a selected technique from an article in this issue or another recent issue.
The entries here are contributed by software developers or programmers for
software that is capable of customization.

TRADESTATION: APRIL 2018
In “Adaptive Moving Averages” in this issue, author Vitali Apirine
introduces an adaptive moving average (AMA) technique based on Perry Kaufman’s
KAMA (Kaufman adaptive moving average). His update to the original KAMA allows
the new method to account for the location of the close relative to the high–low
range. The author describes a trading system that combines the AMA and KAMA,
suggesting that the combination may reduce the number of whipsaws relative
to using either moving average by itself.
Here, we are providing the TradeStation EasyLanguage code for an indicator
and strategy based on the author’s work. We have also included the code
for an AMA function so you can easily include the AMA in your own EasyLanguage
code.
Indicator: Adaptive Moving Average

// TASC APR 2018
// Adaptive Moving Average
// Indicator
// Vitali Apirine

inputs:
	Periods( 10 ),
	FastAvgLength( 2 ),
	SlowAvgLength( 30 ) ;

variables:
	AMA( 0 ),
	KAMA( 0 ) ;

AMA = _AMA( Periods, FastAvgLength,
	SlowAvgLength ) ;
KAMA = AdaptiveMovAvg( Close, Periods,
	FastAvgLength, SlowAvgLength ) ;

Plot1( AMA, "AMA", Cyan ) ;
Plot2( KAMA, "KAMA", Magenta ) ;

if AlertEnabled then
begin
	if AMA crosses over KAMA then
		Alert( "AMA crossing over KAMA" )
	else if AMA crosses under KAMA then
		Alert( "AMA crossing under KAMA" ) ;
end ;


Strategy: Adaptive Moving Average

// TASC APR 2018
// Adaptive Moving Average
// Strategy
// Vitali Apirine

inputs:
	Periods( 10 ),
	FastAvgLength( 2 ),
	SlowAvgLength( 30 ),
	Capital( 100000 ) ;

variables:
	AMA( 0 ),
	KAMA( 0 ),
	TradeSize( 0 ) ;

AMA = _AMA( Periods, FastAvgLength,
	SlowAvgLength ) ;
KAMA = AdaptiveMovAvg( Close, Periods,
	FastAvgLength, SlowAvgLength ) ;

TradeSize = MaxList( 1, Capital / Close ) ;

if  AMA  crosses over KAMA then
	Buy TradeSize shares next bar at Market
else if  AMA  crosses under KAMA then
	Sell Short TradeSize shares next bar at Market ;


Function: _AMA

// TASC APR 2018
// _AMA
// Function
// Vitali Apirine

inputs:
	Periods( numericsimple ),
	FastAvgLength( numericsimple ),
	SlowAvgLength( numericsimple ) ;

variables:
	PDS( Periods + 1 ),
	FastSC( 2 / ( FastAvgLength + 1 ) ),
	SlowSC( 2 / ( SlowAvgLength + 1 ) ),
	SSC( 0 ),
	CST( 0 ),
	MLTP( 0 );

MLTP = AbsValue( ( Close - Lowest( Low, PDS ) )
	- ( Highest( High, PDS ) - Close ))
	/ ( Highest( High, PDS ) - Lowest( Low, PDS ) ) ;

SSC = MLTP * ( FastSC - SlowSC ) + SlowSC ;

CST = Square( SSC ) ;

if CurrentBar = 1 then
	_AMA = Close[1] + CST * ( Close - Close[1] )
else
	_AMA = _AMA[1] + CST * ( Close - _AMA[1] ) ;
To download the EasyLanguage code, please visit our TradeStation and EasyLanguage
support forum. The files for this article can be found at https://community.tradestation.com/Discussions/Topic.aspx?Topic_ID=142776.
The filename is “TASC_APR2018.ZIP.”
For more information about EasyLanguage in general, see www.tradestation.com/EL-FAQ.
A sample chart is shown in Figure 1.

FIGURE 1: TRADESTATION. Shown here
is a daily chart of Apple (AAPL) with the adaptive moving average indicator
and strategy applied.
This article is for informational purposes. No type of trading or investment
recommendation, advice, or strategy is being made, given, or in any manner
provided by TradeStation Securities or its affiliates.
—Doug McCrary
TradeStation Securities, Inc.
www.TradeStation.com
BACK TO LIST

eSIGNAL: APRIL 2018
For this month’s Traders’ Tip, we’ve provided the study KAMA_AMA.efs,
based on Vitali Apirine’s article in this issue, “Adaptive Moving
Averages.” The study is designed to assist you in identifying turning
points and filtering price movements.
The study contains formula parameters that may be configured through the edit
chart window (right-click on the chart and select “edit chart”).
A sample chart is shown in Figure 2.

FIGURE 2: eSIGNAL. Here is an example
of the studies plotted on a daily chart of $INDU.
To discuss this study or download a complete copy of the formula code, please
visit the EFS Library Discussion Board forum under the forums link
from the support menu at www.esignal.com or
visit our EFS KnowledgeBase at www.esignal.com/support/kb/efs/.
The eSignal formula script (EFS) is also shown here:
/*********************************
Provided By:
eSignal (Copyright c eSignal), a division of Interactive Data
Corporation. 2016. All rights reserved. This sample eSignal
Formula Script (EFS) is for educational purposes only and may be
modified and saved under a new file name.  eSignal is not responsible
for the functionality once modified.  eSignal reserves the right
to modify and overwrite this EFS file with each new release.

Description:
    Adaptive Moving Averages by Vitali Apirine

Version:            1.00  02/13/2018

Formula Parameters:                     Default:
Period                                  10
Fast                                    2
Slow                                    30


Notes:
The related article is copyrighted material. If you are not a subscriber
of Stocks & Commodities, please visit www.traders.com.

**********************************/

var fpArray = new Array();

function preMain(){
    setPriceStudy(true);
    setStudyTitle("KAMA&AMA");
    setCursorLabelName("KAMA", 0);
    setCursorLabelName("AMA", 1);

    setDefaultBarFgColor(Color.RGB(255, 106, 0), 1);

    var x = 0;
    fpArray[x] = new FunctionParameter("Period", FunctionParameter.NUMBER);
	with(fpArray[x++]){
        setLowerLimit(1);
        setDefault(10);
    }
    fpArray[x] = new FunctionParameter("Fast", FunctionParameter.NUMBER);
	with(fpArray[x++]){
        setLowerLimit(1);
        setDefault(2);
    }
    fpArray[x] = new FunctionParameter("Slow", FunctionParameter.NUMBER);
	with(fpArray[x++]){
        setLowerLimit(1);
        setDefault(30);
    }
}

var bInit = false;
var bVersion = null;

var xClose = null;
var xHighestHigh = null;
var xLowestLow = null;

var xKAMA = null;
var xAMA = null;

var pds = 0;
var fastSC = 0;
var slowSC = 0;

function main(Period, Fast, Slow){
    if (bVersion == null) bVersion = verify();
    if (bVersion == false) return;

    if (getCurrentBarCount() <= Period + 1) return;

    if (getBarState() == BARSTATE_ALLBARS){
        bInit = false;
    }

    if (!bInit){
        xClose = close();

        pds = Period + 1;
        fastSC = 2 / (Fast +1);
        slowSC = 2 / (Slow + 1);

        xHighestHigh = upperDonchian(pds);
        xLowestLow = lowerDonchian(pds);

        xKAMA = efsInternal("calc_KAMA", xClose, Period, fastSC, slowSC);
        xAMA = efsInternal("calc_AMA", xClose, xHighestHigh, xLowestLow, pds, fastSC, slowSC);

        bInit = true;
    }

    var nKAMA = xKAMA.getValue(0);
    var nKAMA_1 = xKAMA.getValue(-1);
    var nAMA = xAMA.getValue(0);
    var nAMA_1 = xAMA.getValue(-1);

    if (nKAMA_1 == null || nAMA_1 == null) return;

    if (nKAMA_1 > nAMA_1 && nKAMA <= nAMA){
        addLineTool(LineTool.VERT, getCurrentBarIndex(), 1, Color.green, rawtime(0));
    }

    else if (nKAMA_1 < nAMA_1 && nKAMA >= nAMA){
        addLineTool(LineTool.VERT, getCurrentBarIndex(), 1, Color.red, rawtime(0));
    }

    else removeLineTool(LineTool.VERT, rawtime(0));

    return [nKAMA, nAMA];

}

function calc_KAMA(xClose, periods, fastSC, slowSC){
    if (xClose.getValue(-periods) == null) return;
    var nKAMA_1 = (ref(-1) == null) ? 0 : ref(-1);
    var nVolatility = 0;

    for (var i = 0; i < periods; i++){
        nVolatility += Math.abs(xClose.getValue(-i) - xClose.getValue(-i - 1));
    }

    var nDir = Math.abs(xClose.getValue(0) - xClose.getValue(-periods));
    var nER = (nVolatility == 0) ? 0 : nDir / nVolatility;
    var nSSC = nER * (fastSC - slowSC) + slowSC;
    var nCst = nSSC * nSSC;

    var nKAMA = (nKAMA_1 == 0) ? (xClose.getValue(-1) + nCst * (xClose.getValue(0) - xClose.getValue(-1)))
                               : (nKAMA_1 + nCst * (xClose.getValue(0) - nKAMA_1));

    return nKAMA;
}


function calc_AMA(xClose, xHighestHigh, xLowestLow, pds, fastSC, slowSC){
    if (xClose.getValue(-1) == null || xHighestHigh.getValue(0) == null || xLowestLow.getValue(0) == null) return;
    if ((xHighestHigh.getValue(0) - xLowestLow.getValue(0)) == 0) return;

    var nAMA_1 = (ref(-1) == null) ? 0 : ref(-1);
    var nMLTP = Math.abs( ((xClose.getValue(0) - xLowestLow.getValue(0)) - (xHighestHigh.getValue(0) - xClose.getValue(0) )) / (xHighestHigh.getValue(0) - xLowestLow.getValue(0)) );
    var nSSC = nMLTP * (fastSC - slowSC) + slowSC;
    var nCst = nSSC * nSSC;

    var nAMA = (nAMA_1 == 0) ? (xClose.getValue(-1) + nCst * (xClose.getValue(0) - xClose.getValue(-1)))
                             : (nAMA_1 + nCst * (xClose.getValue(0) - nAMA_1));

    return nAMA;
}

function verify(){
    var b = false;
    if (getBuildNumber() < 779){

        drawTextAbsolute(5, 35, "This study requires version 10.6 or later.",
            Color.white, Color.blue, Text.RELATIVETOBOTTOM|Text.RELATIVETOLEFT|Text.BOLD|Text.LEFT,
            null, 13, "error");
        drawTextAbsolute(5, 20, "Click HERE to upgrade.@URL=https://www.esignal.com/download/default.asp",
            Color.white, Color.blue, Text.RELATIVETOBOTTOM|Text.RELATIVETOLEFT|Text.BOLD|Text.LEFT,
            null, 13, "upgrade");
        return b;
    }
    else
        b = true;

    return b;
}
—Eric Lippert
eSignal, an Interactive Data company
800 779-6555, www.eSignal.com
BACK TO LIST

WEALTH-LAB: APRIL 2018
In an attempt to improve the way that whipsaw signals may typically be generated
by price/KAMA crossovers, Vitali Apirine, in his article in this issue, “Adaptive
Moving Averages,” combines two adaptive moving averages to create a simple
AMA/KAMA crossover system.
By installing the TASCIndicators library’s latest version from our website
and restarting Wealth-Lab, users can rebuild this system from the flexible
blocks known as “rules.” By simply combining and reordering them,
one can come up with some fairly elaborate strategies. Figure 3 illustrates
the easiness of it; the process can take less than a minute and frees you from
writing code.
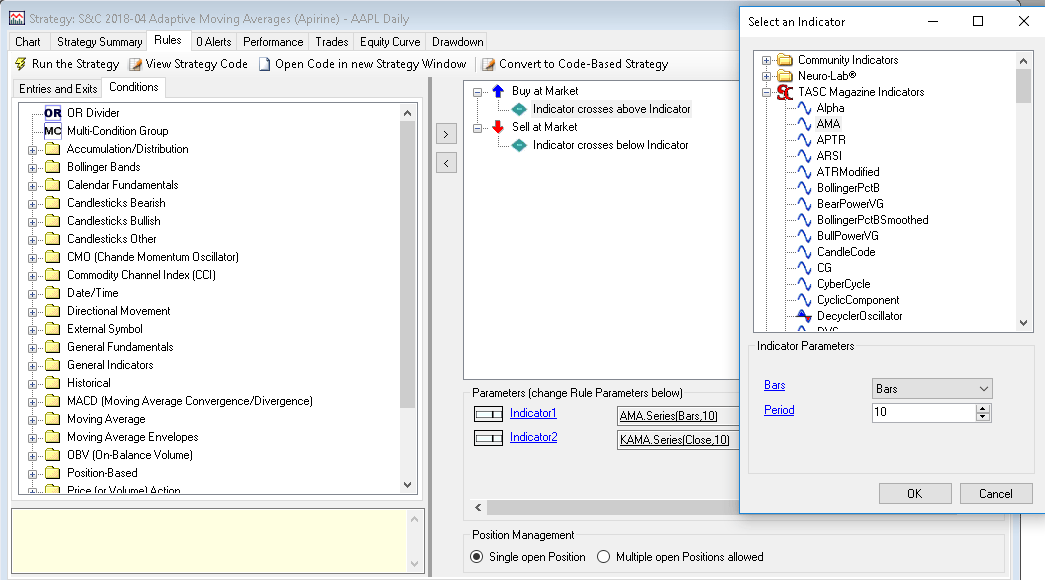
FIGURE 3: WEALTH-LAB. Here’s
an example of setting up the system in Wealth-Lab’s rules wizard.
The system naturally works better on stocks, which steadily move in the direction
of the trend rather than go sideways (even with higher volatility) or less
volatile ones. It’s the sideways movement that is one of the biggest
performance killers of a moving average system like this. A market filter might
help avoid further whipsaws (Figure 4).
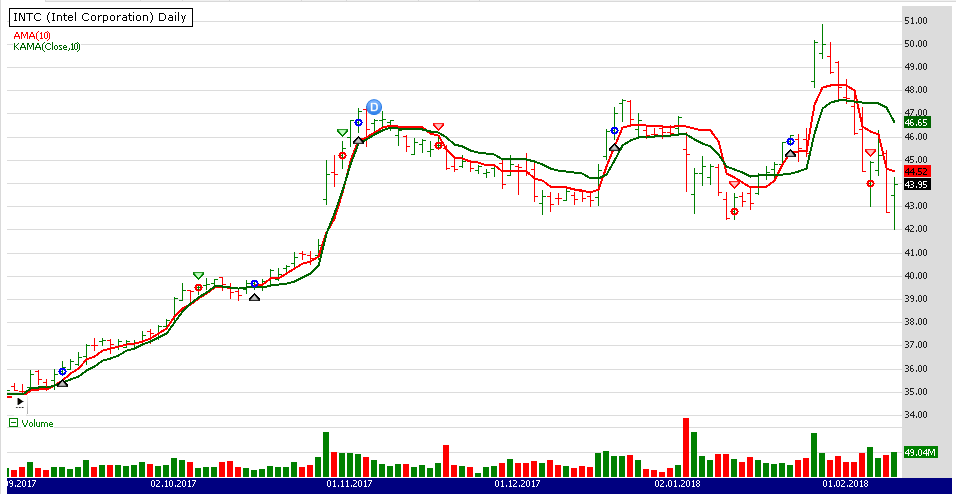
FIGURE 4: WEALTH-LAB. This shows
successful trend trades followed by losses in a sideways market in INTC (Intel).
For those of you who’d like to customize every aspect and build even
more complex logic, C# language and the power of the .NET framework is at your
disposal in Wealth-Lab. The code follows:
using System;
using System.Collections.Generic;
using System.Text;
using System.Drawing;
using WealthLab;
using WealthLab.Indicators;
using TASCIndicators;

namespace WealthLab.Strategies
{
	public class MyStrategy : WealthScript
	{
		protected override void Execute()
		{
			var ama = AMA.Series( Bars, 10);
			var kama = KAMA.Series( Close, 10);

			PlotSeries( PricePane, ama,Color.Red,LineStyle.Solid,2);
			PlotSeries( PricePane, kama,Color.DarkGreen,LineStyle.Solid,2);

			for(int bar = GetTradingLoopStartBar(11 * 3); bar < Bars.Count; bar++)
			{
				if ( IsLastPositionActive )
				{
					Position p = LastPosition;
					if ( CrossUnder( bar, ama, kama))
						SellAtMarket( bar + 1, p);
				}
				else
				{
					if ( CrossOver( bar, ama, kama))
						BuyAtMarket( bar + 1);
				}
			}
		}
	}
}
—Eugene (Gene Geren), Wealth-Lab team
MS123, LLC
www.wealth-lab.com
BACK TO LIST

THINKORSWIM: APRIL 2018
We have put together a study for thinkorswim based on the article “Adaptive
Moving Averages ” by Vitali Apirine in this issue. We built this study
using our proprietary scripting language, thinkscript. We have made the loading
process extremely easy; simply click on the link https://tos.mx/MYXu1P then
choose to view thinkScript study and name it “MovingAverageAdaptive_Updated.”
Overlaid on the daily chart of the Dow Jones Industrial Average (DJIA) in
Figure 5 is the KAMA (blue) and the AMA (yellow). See Apirine’s article
for more details on indicator interpretation.
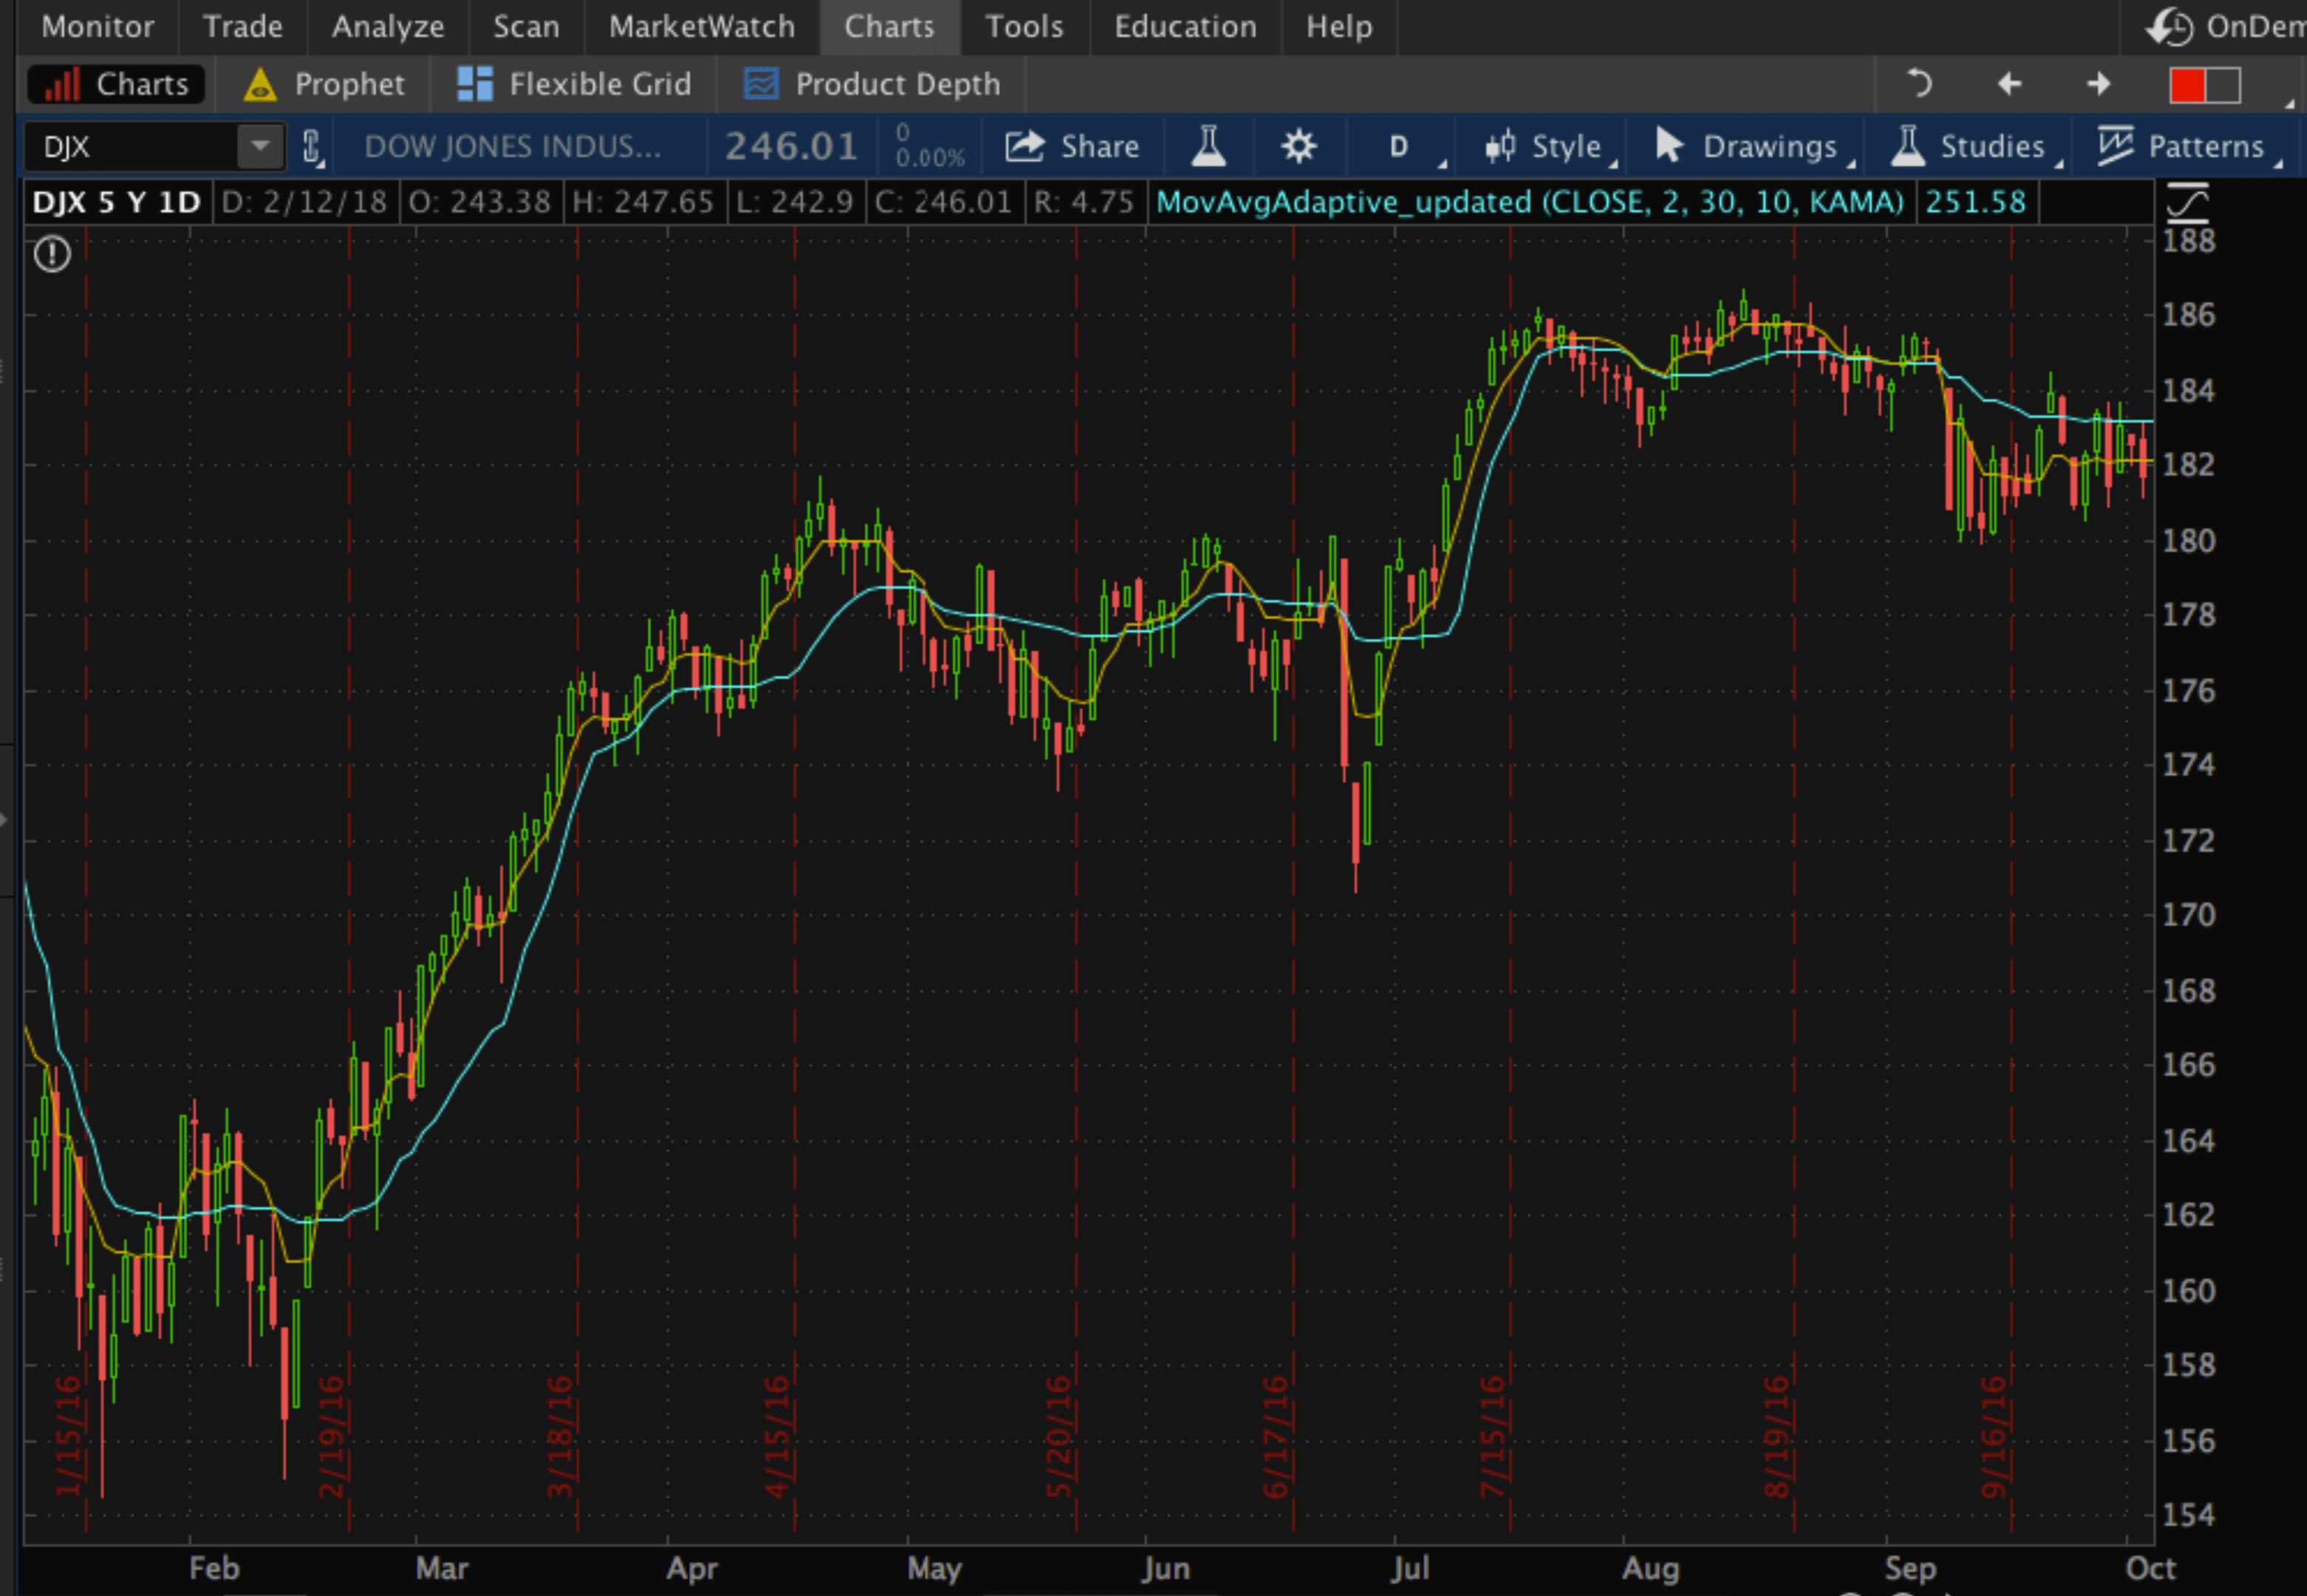
FIGURE 5: THINKORSWIM. Shown here
is a daily chart of the DJIA with an adaptive moving average and KAMA plot
in blue, AMA plot in yellow.
—thinkorswim
A division of TD Ameritrade, Inc.
www.thinkorswim.com
BACK TO LIST

NEUROSHELL TRADER: APRIL 2018
The Kaufman and adaptive moving average indicators described by Vitali Apirine
in his article in this issue, “Adaptive Moving Averages,” can be
easily implemented in NeuroShell Trader using NeuroShell Trader’s ability
to call external dynamic linked libraries. Dynamic linked libraries can be
written in C, C++, and Power Basic.
After moving the MetaStock code given in Apirine’s article to your preferred
compiler and creating a DLL, you can insert the resulting indicators as follows:
- Select new indicator from the insert menu.
- Choose the external program & library calls category.
- Select the appropriate external DLL call indicator.
- Set up the parameters to match your DLL.
- Select the finished button.
Users of NeuroShell Trader can go to the Stocks & Commodities section
of the NeuroShell Trader free technical support website to download a copy
of this or any previous Traders’ Tips.
A sample chart is shown in Figure 6.

FIGURE 6: NEUROSHELL TRADER. This
NeuroShell Trader chart displays the Kaufman and adaptive moving averages
on an S&P 500 chart.
—Marge Sherald, Ward Systems Group, Inc.
301 662-7950, sales@wardsystems.com
www.neuroshell.com
BACK TO LIST

NINJATRADER: APRIL 2018
The adaptive moving average (AMA) indicator, as discussed in “Adaptive
Moving Averages” in this issue by Vitali Apirine, is available for download
at the following links for NinjaTrader 8 and NinjaTrader 7:
Once the file has been downloaded, you can import the indicator in NinjaTader
8 from within the control center by selecting Tools → Import → NinjaScript
Add-On and then selecting the downloaded file for NinjaTrader 8. To import
in NinjaTrader 7, from within the control center window, select the menu File → Utilities → Import
NinjaScript and select the downloaded file.
You can review the indicator’s source code in NinjaTrader 8 by selecting
the menu New → NinjaScript Editor → Indicators from within the control
center window and selecting the AMA file. You can review the indicator’s
source code in NinjaTrader 7 by selecting the menu Tools → Edit NinjaScript → Indicator
from within the control center window and selecting the AMA file.
NinjaScript uses compiled DLLs that run native, not interpreted, to provide
you with the highest performance possible.
A sample chart implementing the strategy is shown in Figure 7.

FIGURE 7: NINJATRADER. The adaptive
moving average (orange) and Kaufman adaptive moving average (blue) indicators
are shown on a daily ES 03-18 chart.
—Raymond Deux & Jim Dooms
NinjaTrader, LLC
www.ninjatrader.com
BACK TO LIST

QUANTACULA: APRIL 2018
We added the adaptive moving average (AMA) indicator based on Vitali Apirine’s
article in this issue, “Adaptive Moving Averages,” to our TASC
Extensions for Quantacula.com and Quantacula Studio.
Since the AMA is a data smoother, you can use the same techniques with it
that are applicable to any smoother, such as indicator/price or indicator/indicator
crossovers. While experimenting with the AMA, we discovered that the 200-period
setting is useful for identifying buying opportunities as the underlying price
deviates from the indicator.
We mocked up a simple model on Quantacula.com’s Q-Web. To follow along
yourself, first go to the Quantacula.com Market Place link and install these
two free extensions:
- TASC Extensions (indicator)
- Indicator % above/below indicator (building block)
With the extensions installed, you can recreate our model using the setup
shown in Figure 8 in Q-Web. Be sure to change the parameters for the entry
condition to 4% below, and set the period parameter of the AMA indicator in
both instances to 200.
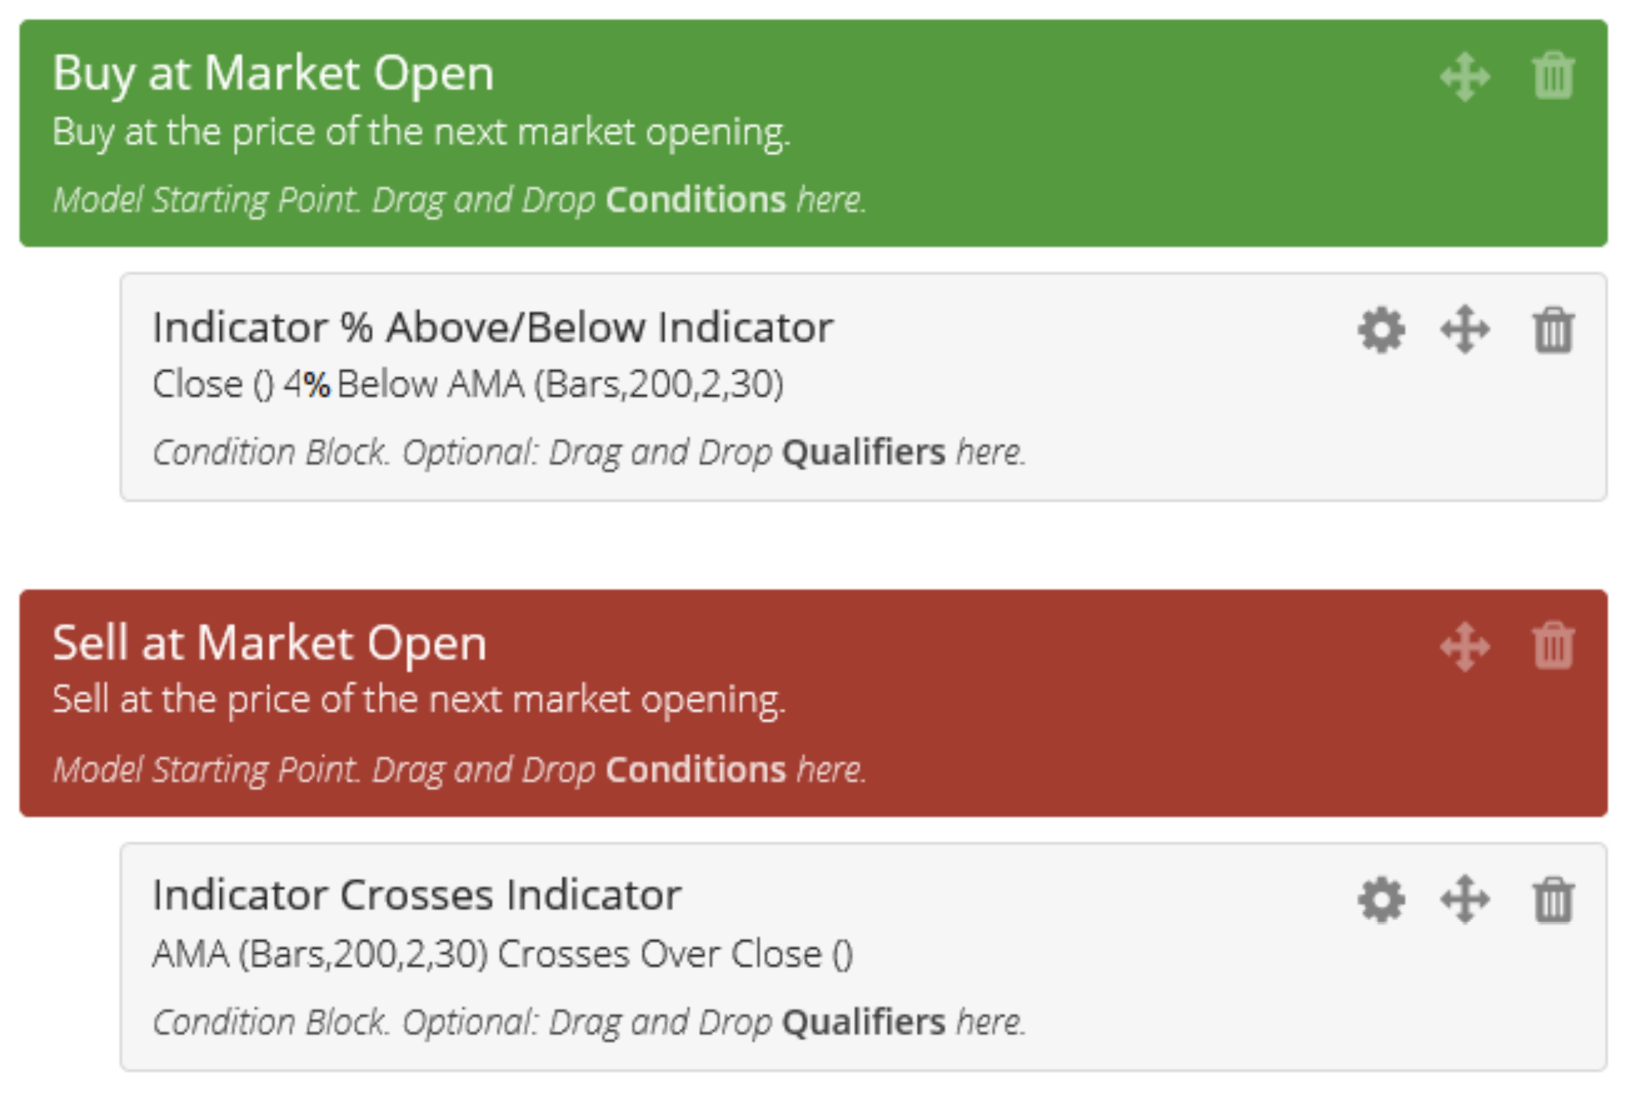
FIGURE 8: QUANTACULA. An example
setup is shown here for the AMA cross model in Q-Web.
We ran the backtest on the Q-Premium Nasdaq 100 stocks, which are not subjected
to survivorship bias, with the following settings:
- Starting capital: $500,000
- Position sizing: 10% of equity
- Data range: 10 years
The backtest resulted in a respectable APR of 17.42% and a Sharpe ratio of
1.04, handily outperforming the SPY benchmark.
On Q-Web, you can click on a trade in the backtest results positions list
in order to examine it more closely on a chart. Figure 9 is a chart of one
of the model’s trades on the stock FAST. Note how the stock deviates
from the 200-day AMA, presenting a buying opportunity, and then quickly reverts
back.
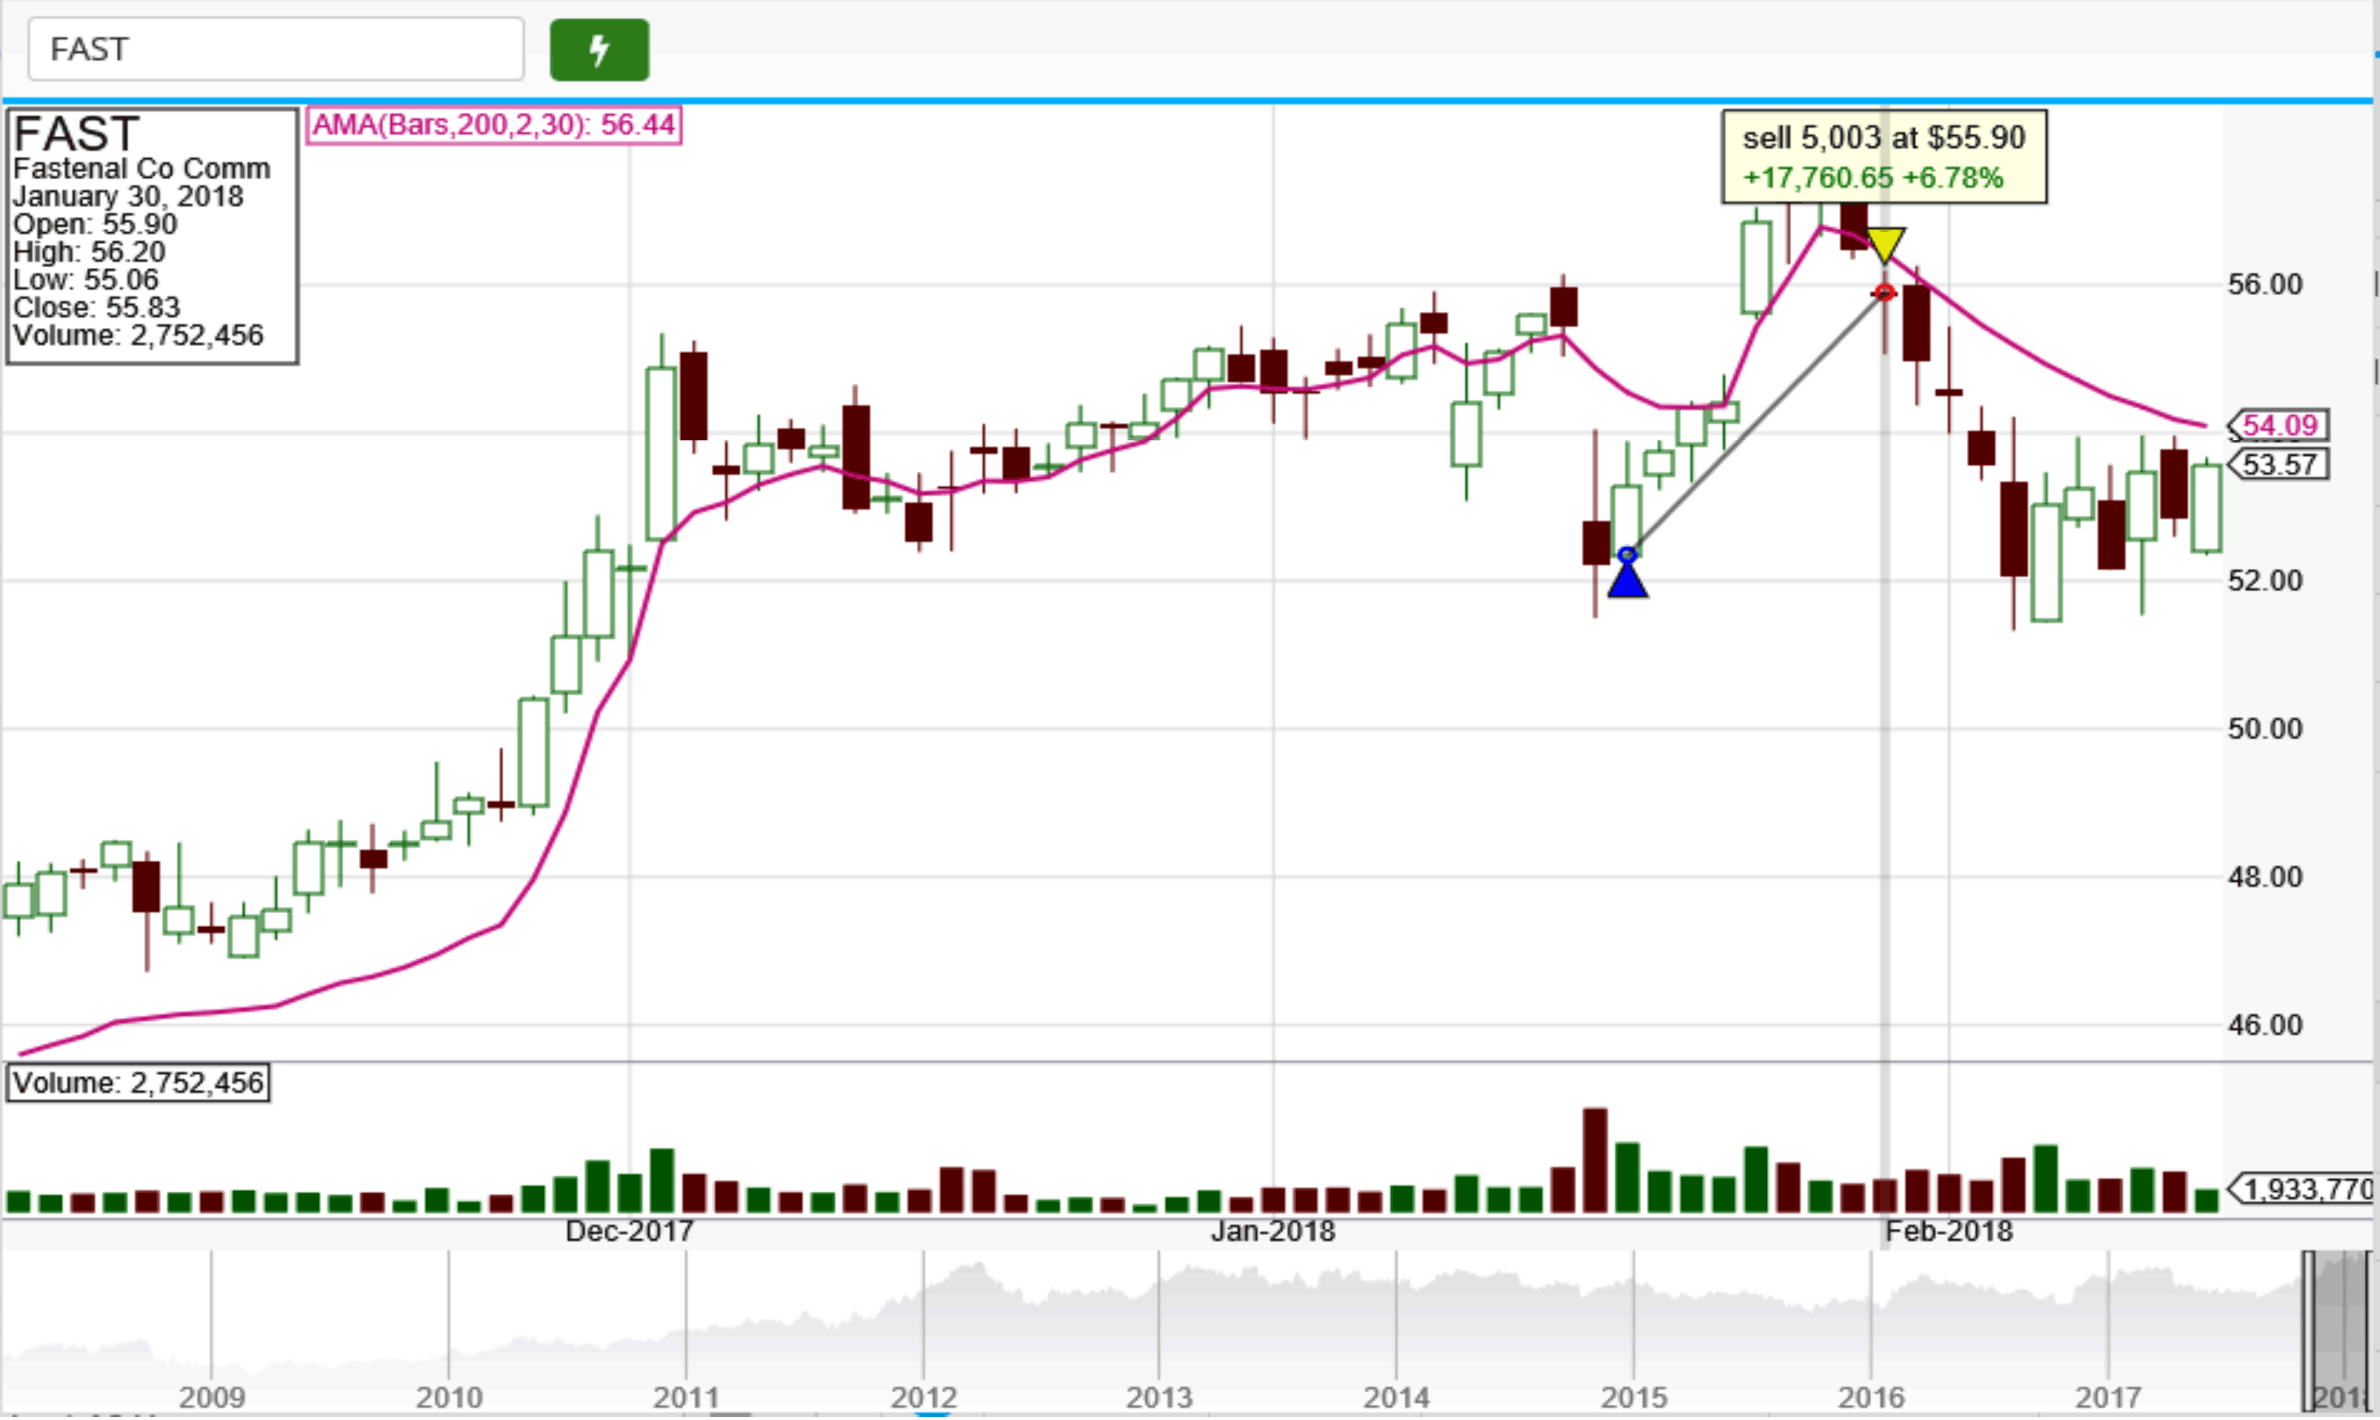
FIGURE 9: QUANTACULA. Here is an
example of the AMA cross model on a Quantacula chart of the stock FAST.
—Dion Kurczek, Quantacula LLC
info@quantacula.com
www.quantacula.com
BACK TO LIST

TRADERSSTUDIO: APRIL 2018
The TradersStudio code based on Vitali Apirine’s article in this issue, “Adaptive
Moving Averages,” can be found at www.TradersEdgeSystems.com/traderstips.htm,
and is also shown here:
'ADAPTIVE MOVING AVERAGE
'Author: Vitali Apirine, TASC April 2018
'Coded by: Richard Denning, 2/12/18
'www.TradersEdgeSystems.com

Function AMA(periods,fastSC,slowSC)
Dim pds
pds = periods + 1
Dim mltp
mltp = Abs((C - Lowest(L,pds)) - (Highest(H,pds) - C)) / (Highest(H,pds) - Lowest(L,pds))
Dim SSC
SSC = mltp * (fastSC - slowSC) + slowSC
Dim cons
cons = SSC * SSC
Dim theAMA As BarArray
If BarNumber = periods Then
theAMA = C[1] + cons*(C - C[1])
Else
theAMA = theAMA[1] + cons * (C - theAMA[1])
End If
AMA = theAMA
End Function
'-------------------------------------------
Function KAMA(periods,fastSC,slowSC)
Dim pds
pds = periods + 1
Dim dir As BarArray
dir = Abs(C - C[periods])
Dim vola As BarArray
vola = SUMMATION(Abs(C - C[1]),periods)
Dim ER As BarArray
ER = dir / vola
Dim SSC
SSC = ER * (fastSC - slowSC) + slowSC
Dim cons
cons = SSC * SSC
If BarNumber = periods Then
Dim theKAMA As BarArray
theKAMA = Close[1] + cons*(C - C[1])
Else
theKAMA = theKAMA[1] + cons*(C - theKAMA[1])
KAMA = theKAMA
End If
End Function
'---------------------------------------------
Sub AMA_IND(periods,fastSC,slowSC)
Dim theAMA As BarArray
theAMA = AMA(periods,fastSC,slowSC)
plot1(theAMA)
End Sub
'---------------------------------------------
Sub KAMA_IND(periods,fastSC,slowSC)
Dim theKAMA As BarArray
theKAMA = KAMA(periods,fastSC,slowSC)
plot1(theKAMA)
End Sub
'---------------------------------------------
Figure 10 shows the AMA (white line) and the KAMA (yellow line) indicators
on a chart of the mini S&P 500 futures contract (ES) during part of 2013
and 2014.

FIGURE 10: TRADERSSTUDIO. The AMA
(white line) and the KAMA (yellow line) indicators are shown on a chart of
the emini S&P 500 futures contract (ES) during part of 2013 and 2014.
—Richard Denning
info@TradersEdgeSystems.com
for TradersStudio
BACK TO LIST

UPDATA: APRIL 2018
Our Traders’ Tip for this month is based on the article by Vitali Apirine
in this issue, “Adaptive Moving Averages.”
In it, the author gives an analysis on a certain adaptive moving average,
which, as the name suggests, seeks to adapt its output depending on past conditions.
Parameters in its formula dynamically adjust for periods of trend or mean reversion
to better track price action.
The Updata code based on this article is in the Updata library and may be
downloaded by clicking the custom menu and indicator library.
Those who cannot access the library due to a firewall may paste the code shown
here into the Updata custom editor and save it.
PARAMETER "PERIOD" #PERIOD=10
PARAMETER "SC1" #SC1=2
PARAMETER "SC2" #SC2=30
DISPLAYSTYLE LINE
INDICATORTYPE TOOL
PLOTSTYLE THICK2 RGB(0,0,200)
NAME AMA
@MULT=0
@SC=0
@AMA=0
FOR #CURDATE=#PERIOD TO #LASTDATE
     @MULT=ABS((CLOSE-PLOW(LOW(1),#PERIOD))-(PHIGH(HIGH(1),#PERIOD)-CLOSE))/(PHIGH(HIGH(1),#PERIOD)-PLOW(LOW(1),#PERIOD))
     @SC=ExpBase(@MULT*((2/(#SC1+1))-(2/(#SC2+1)))+(2/(#SC2+1)),2)
     IF #CURDATE=#PERIOD
        @AMA=MAVE(#PERIOD-1)
     ELSE
        @AMA=HIST(@AMA,1)+(@SC*(CLOSE(1)-HIST(@AMA,1)))
     ENDIF
     @PLOT=@AMA
NEXT
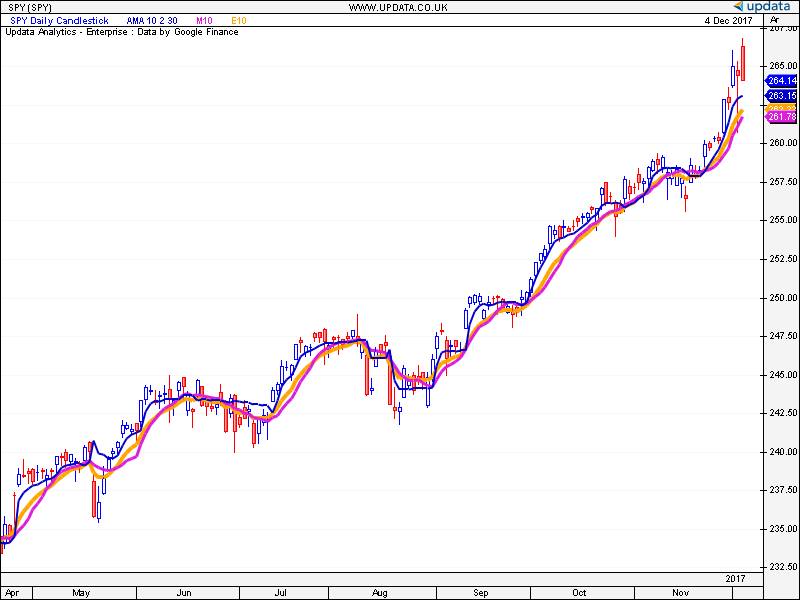
FIGURE 11: UPDATA. The adaptive
moving average (blue) is applied to the daily SPY, shown with exponential
and simple moving averages for comparison.
—Updata support team
support@updata.co.uk
www.updata.co.uk
BACK TO LIST

AMIBROKER: APRIL 2018
In “Adaptive Moving Averages” in this issue, author Vitali Apirine
presents exponential moving variables with a variable smoothing factor. The
AmiBroker code listing shown below contains a ready-to-use formula. To adjust
parameters, right-click on a chart and select parameters from the context menu.
Plot( C, "Price", colorDefault, styleBar );

// KAMA

Periods = Param("Periods", 10, 2, 100 );
Pds = Periods + 1;
FastSC = 2 / ( 2 + 1 );
SlowSC = 2 / ( 30 + 1 );

Direction = Abs( Close - Ref( Close, -periods ) );
Volatility = Sum( Abs( Close - Ref( Close, -1 ) ), periods );
ER = Direction / Volatility;
SSC = ER * ( FastSC - SlowSC ) + SlowSC;
Constant = SSC * SSC;

KAMA = AMA( Close, Constant );

Plot( KAMA, "KAMA" + periods, colorBlue, styleThick );

// AMA

Mltp = Abs( ( C - LLV( L, Pds ) ) - ( HHV( H, Pds ) - C ) ) / ( HHV( H, Pds ) - LLV( L, Pds ) );
SSC2 = Mltp * ( FastSC - SlowSC ) + SlowSC;
Constant2 = SSC2 * SSC2;


AdaptMA = AMA( C, Constant2 );

Plot( AdaptMA, "AMA" + periods, colorRed, styleThick );
A sample chart is shown in Figure 12.
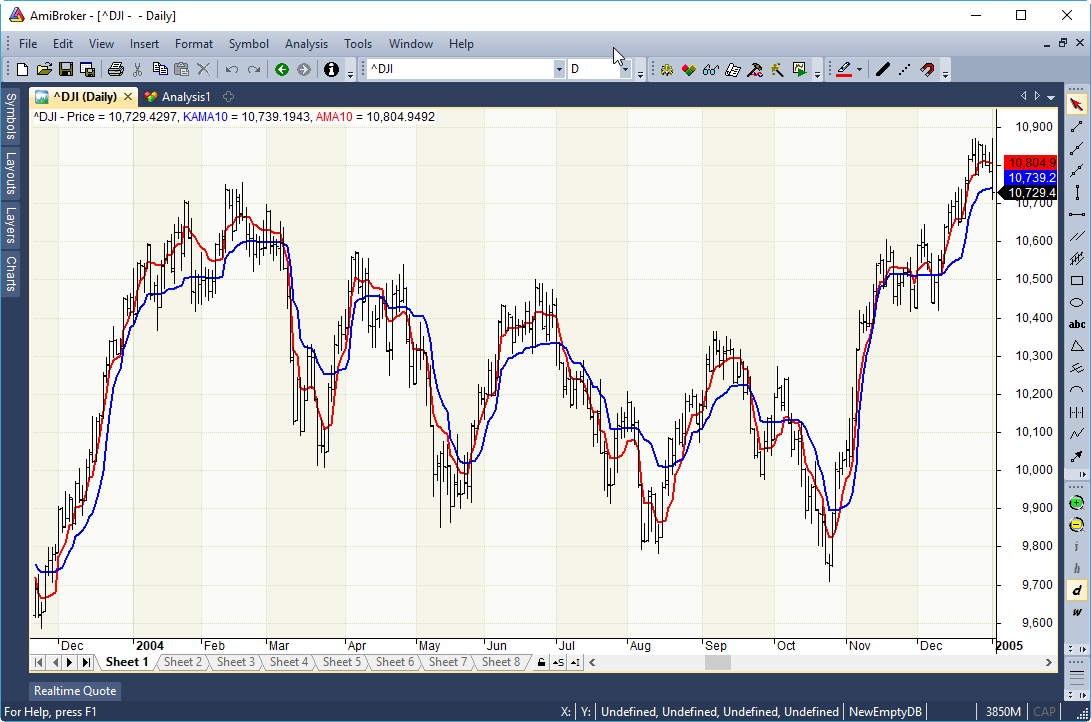
FIGURE 12: AMIBROKER. Here is a
daily chart of the Dow Jones Industrial Average with KAMA and AMA moving
averages, replicating a chart from Apirine’s article in this issue.
—Tomasz Janeczko, AmiBroker.com
www.amibroker.com
BACK TO LIST
MICROSOFT EXCEL: APRIL 2018
In his article in this issue, “Adaptive Moving Averages,” author
Vitali Apirine demonstrates an application of two complementary adaptive moving
averages as a potential swing trade signal generator. Crossovers of these two
averages can confirm trend changes within a couple of bars of what the eye
would call a local bottom or top.
The article suggests that compared to a simple KAMA/price crossover system,
by adding AMA, whipsaws are reduced (though not eliminated).
The article also suggests that whipsaws can perhaps be further reduced by
requiring that a crossover should not be considered official until an AMA/KAMA
cross has been sustained for a number of bars.
In Figure 13, there are two whipsaw examples. In the first example, a downtrend
is interrupted for two bars and then resumes. The second is a one-day interruption
of an uptrend in progress.
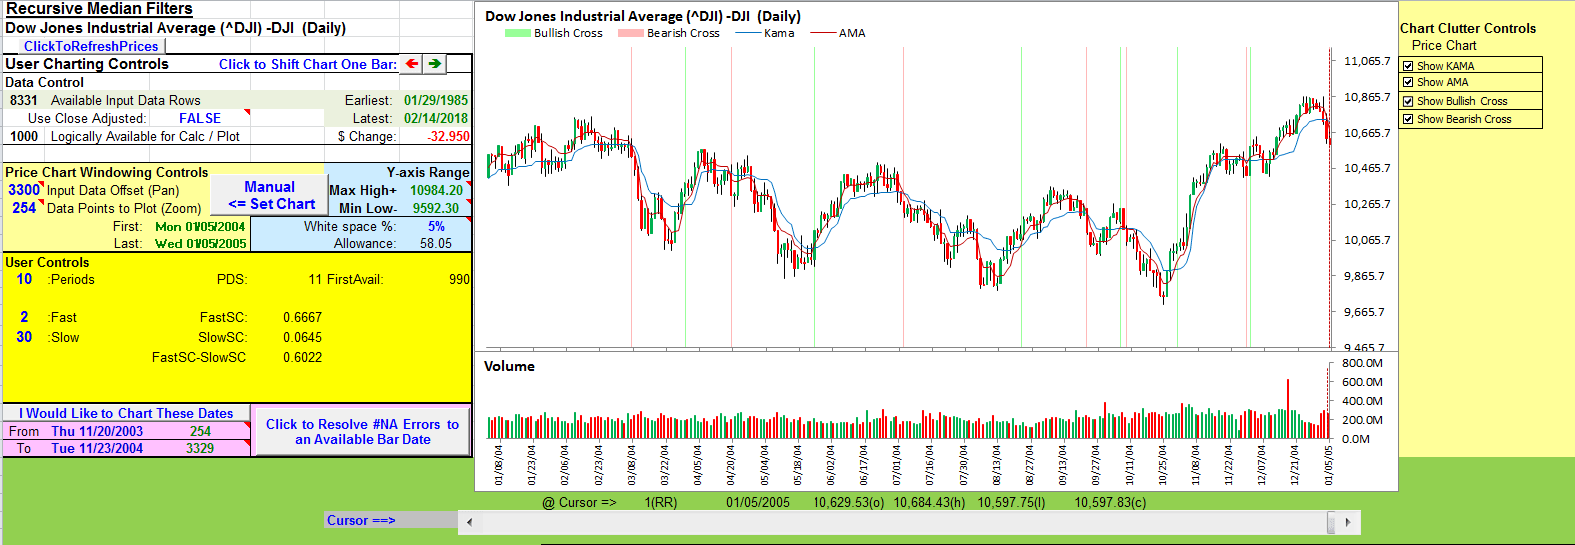
FIGURE 13: EXCEL. The DJIA with
crossovers is displayed. Note the whipsaws that occurred near 10/11/2004
and 12/01/2004.
Deciding on the correct number of bars to delay the decision to accept a signal
is a conundrum for any trading system. For this chart, one or two bars clearly
is insufficient to prevent dumping out of what the chart shows to be the prevailing
trends. Yet in an active market, a three- to five-bar delay could mean a significant
hit if the reversal signal is sustained.
The spreadsheet file for this Traders’ Tip can be downloaded here.
To successfully download it, follow these steps:
- Right-click on the Excel
file link, then
- Select “save as” (or “save target as”) to place
a copy of the spreadsheet file on your hard drive.
Important note regarding Yahoo Finance interface:
This note applies to Excel spreadsheets that I have provided here for Traders’ Tips
from the December 2017 issue (which was my first spreadsheet to support the
new Yahoo Finance interface) through the March 2018 issue.
Several readers have reported receiving the following failure message:
"User Defined Type Not Defined"
If the user selects the debug option, the following statement is highlighted
in the VBA code:
Dim MSXML2Object As MSXML2.XMLHTTP
For anyone having this failure and who is comfortable with the VBA editor,
two simple edits have proven to fix the problem. First, find:
Dim MSXML2Object As MSXML2.XMLHTTP
(which is failing) and change it to:
Dim MSXML2Object As MSXML2.XMLHTTP60
Later in the code, find and make a necessary mirroring change, from
Set MSXML2Object = New MSXML2.XMLHTTP
to
Set MSXML2Object = New MSXML2.XMLHTTP60
The problem does not seem to be universal; at least one reader has reported
having a different experience on two different computers, with the spreadsheet
working correctly on one yet failing on the other. When edited as described
above, it then works.
This month’s Traders’ Tips already has this change incorporated.
A fix for previous Excel spreadsheets, required due to Yahoo modifications, can be found here: https://traders.com/files/Tips-ExcelFix.html
—Ron McAllister
Excel and VBA programmer
rpmac_xltt@sprynet.com
BACK TO LIST
Originally published in the April 2018 issue of
Technical Analysis of STOCKS & COMMODITIES magazine.
All rights reserved. © Copyright 2018, Technical Analysis, Inc.


