TRADERS’ TIPS
May 2018

For this month’s Traders’ Tips, the focus is John Ehlers’ article
in this issue, “RocketRSI—A Solid Propellant For Your Rocket
Science Trading.” Here, we present the May 2018 Traders’ Tips
code with possible implementations in various software.
You can right-click on any chart to open it in a new tab or window
and view it at it’s originally supplied size, often much larger than
the version printed in the magazine.
EasyLanguage code is also provided by Ehlers in the article, which S&C
subscribers will find in the Article Code section of our website here.
The Traders’ Tips section is provided to help the reader implement
a selected technique from an article in this issue or another recent issue.
The entries here are contributed by software developers or programmers for
software that is capable of customization.

TRADESTATION: MAY 2018
In “RocketRSI—A Solid Propellant For Your Rocket Science Trading” in this
issue, author John Ehlers introduces a new take on the classic RSI indicator
originally developed by J. Welles Wilder. Ehlers begins by introducing a new
version of the RSI based on a simple accumulation of up and down closes rather
than averages. To this he applies a Fisher transform. He tells us that the
resultant output is statistically significant spikes that indicate cyclic turning
points with precision.
Here, we are providing the TradeStation EasyLanguage code for an indicator
and a strategy based on the author’s work.
// RocketRSI Indicator
// (C) 2005-2018 John F. Ehlers
// TASC May 2018

inputs:
	SmoothLength( 10 ),
	RSILength( 10 ),
	OBOSLevel( 2 ) ;
variables:
	a1( 0 ),
	b1( 0 ),
	c1( 0 ),
	c2( 0 ),
	c3( 0 ),
	Filt( 0 ),
	Mom( 0 ),
	count( 0 ),
	CU( 0 ),
	CD( 0 ),
	MyRSI( 0 ),
	RocketRSI( 0 ),
	DollarsPerTrade( 0 ),
	PositionSize( 0 ) ;

//Compute Super Smoother coefficients once
if CurrentBar = 1 then
begin
	a1 = expvalue( -1.414 * 3.14159
		/ ( SmoothLength ) ) ;
	b1 = 2 * a1 * Cosine( 1.414 * 180
		/ ( SmoothLength ) ) ;
	c2 = b1 ;
	c3 = -a1 * a1 ;
	c1 = 1 - c2 - c3 ;
end ;

//Create half dominant cycle Momentum
Mom = Close - Close[RSILength - 1] ;

//SuperSmoother Filter
Filt = c1 * ( Mom + Mom[1] )
	/ 2 + c2 * Filt[1] + c3 * Filt[2] ;

//Accumulate "Closes Up" and "Closes Down"
CU = 0 ;
CD = 0 ;
for count = 0 to RSILength -1
begin
	if Filt[count] - Filt[count + 1] > 0 then
		CU = CU + Filt[count] - Filt[count + 1] ;
	if Filt[count] - Filt[count + 1] < 0 then
		CD = CD + Filt[count + 1] -	Filt[count] ;
end ;

if CU + CD <> 0 then
	MyRSI = ( CU - CD ) / ( CU + CD ) ;

//Limit RocketRSI output to
//+/- 3 Standard Deviations
iF MyRSI > .999 then
	MyRSI = .999 ;
if MyRSI < -.999 then
	MyRSI = -.999 ;

//Apply Fisher Transform to establish
//Gaussian Probability Distribution
RocketRSI = .5 * Log( ( 1 + MyRSI )
	/ ( 1 - MyRSI ) ) ;

Plot1( RocketRSI, "RocketRSI" ) ;
Plot2( 0, "Zero Line" ) ;
Plot3( OBOSLevel, "OB Level" ) ;
Plot4( -OBOSLevel, "OS Level" ) ;


Strategy: RocketRSI

// RocketRSI Strategy
// (C) 2005-2018 John F. Ehlers
// TASC May 2018

inputs:
	SmoothLength( 10 ),
	RSILength( 10 ),
	OBOSLevel( 2 ),
	InitialCapital( 100000 ),
	Leverage( 2 ),
	SLAmount( 2 ) ;
variables:
	a1( 0 ),
	b1( 0 ),
	c1( 0 ),
	c2( 0 ),
	c3( 0 ),
	Filt( 0 ),
	Mom( 0 ),
	count( 0 ),
	CU( 0 ),
	CD( 0 ),
	MyRSI( 0 ),
	RocketRSI( 0 ),
	DollarsPerTrade( 0 ),
	PositionSize( 0 ) ;

//Compute Super Smoother coefficients once
if CurrentBar = 1 then
begin
	a1 = expvalue( -1.414 * 3.14159
		/ ( SmoothLength ) ) ;
	b1 = 2 * a1 * Cosine( 1.414 * 180
		/ ( SmoothLength ) ) ;
	c2 = b1 ;
	c3 = -a1 * a1 ;
	c1 = 1 - c2 - c3 ;
end ;

//Create half dominant cycle Momentum
Mom = Close - Close[RSILength - 1] ;

//SuperSmoother Filter
Filt = c1 * ( Mom + Mom[1] )
	/ 2 + c2 * Filt[1] + c3 * Filt[2] ;

//Accumulate "Closes Up" and "Closes Down"
CU = 0 ;
CD = 0 ;
for count = 0 to RSILength -1
begin
	if Filt[count] - Filt[count + 1] > 0 then
		CU = CU + Filt[count] - Filt[count + 1] ;
	if Filt[count] - Filt[count + 1] < 0 then
		CD = CD + Filt[count + 1] -	Filt[count] ;
end ;

if CU + CD <> 0 then
	MyRSI = ( CU - CD ) / ( CU + CD ) ;

//Limit RocketRSI output to
//+/- 3 Standard Deviations
iF MyRSI > .999 then
	MyRSI = .999 ;
if MyRSI < -.999 then
	MyRSI = -.999 ;

//Apply Fisher Transform to establish
//Gaussian Probability Distribution
RocketRSI = .5 * Log( ( 1 + MyRSI )
	/ ( 1 - MyRSI ) ) ;

// Calculate Position Size
DollarsPerTrade = ( InitialCapital + NetProfit
	+ OpenPositionProfit ) * Leverage ;
PositionSize = DollarsPerTrade / Close ;


if RocketRSI crosses below -OBOSLevel then
	Buy PositionSize shares next bar at Market
else if RocketRSI crosses above OBOSLevel then
	SellShort PositionSize shares next bar at Market ;

// Apply a Stop Loss
SetStopShare ;
SetStopLoss( SLAmount )
To download the EasyLanguage code, please visit our TradeStation and EasyLanguage
support forum. The files for this article can be found here: https://community.tradestation.com/Discussions/Topic.aspx?Topic_ID=142776.
The filename is “TASC_MAY2018.ZIP.”
For more information about EasyLanguage in general, please see https://developer.tradestation.com/easylanguage.
A sample chart is shown in Figure 1.

FIGURE 1: TRADESTATION. Here is
an example daily chart of SPY with the RocketRSI indicator and strategy applied.
This article is for informational purposes. No type of trading or investment
recommendation, advice, or strategy is being made, given, or in any manner
provided by TradeStation Securities or its affiliates.
—Doug McCrary
TradeStation Securities, Inc.
www.TradeStation.com
BACK TO LIST

METASTOCK: MAY 2018
John Ehlers’ article in this issue, “RocketRSI—A Solid Propellant For Your
Rocket Science Trading,” presents two variations on the standard RSI calculation.
Here are the MetaStock formulas for these indicators:
MYRSI:

sml:= 8; {smooth length}
rsil:= 10; {RSI length}

{super smoother}
a1:= Exp(-1.414 * 3.14159 / sml);
b1:= 2*a1 * Cos(1.414*180 / sml);
c2:= b1;
c3:= -a1 * a1;
c1:= 1 - c2 - c3;
filt:= c1 * (C + Ref(C, -1))/2 + c2*PREV + c3*Ref(PREV,-1);

{RSI}
change:= ROC(filt, 1, $);
CU:= Sum(If(change > 0, change, 0), rsil);
CD:= Sum(If(change < 0, Abs(change), 0), rsil);
denom:= If(CU+CD = 0, -1, CU+CD);
If(denom=-1, 0, (CU-CD)/denom)


RocketRSI:

sml:= 8; {smooth length}
rsil:= 10; {RSI length}

{super smoother}
a1:= Exp(-1.414 * 3.14159 / sml);
b1:= 2*a1 * Cos(1.414*180 / sml);
c2:= b1;
c3:= -a1 * a1;
c1:= 1 - c2 - c3;

rmom:= C-Ref(C, -(rsil-1));
filt:= c1 * (rmom + Ref(rmom, -1))/2 + c2*PREV + c3*Ref(PREV,-1);

{RSI}
change:= ROC(filt, 1, $);
CU:= Sum(If(change > 0, change, 0), rsil);
CD:= Sum(If(change < 0, Abs(change), 0), rsil);
denom:= If(CU+CD = 0, -1, CU+CD);
myRSI:= If(denom=-1, 50, (CU-CD)/denom);

limit:= If(myRSI>0.999, 0.999, If(myRSI<-0.999, -0.999, myRSI));
.5*Log((1+limit) / (1-limit))
—William Golson
MetaStock Technical Support
www.metastock.com
BACK TO LIST

eSIGNAL: MAY 2018
For this month’s Traders’ Tip, we’ve provided the study RocketRSI.efs based
on the article by John Ehlers in this issue, “RocketRSI—A Solid Propellant
For Your Rocket Science Trading.” The study is designed to assist you in identifying
cyclic reversal points.
The study contains formula parameters that may be configured through the edit
chart window (right-click on the chart and select “edit chart”). A sample
chart is shown in Figure 2.

FIGURE 2: eSIGNAL. Here is an example
of the study plotted on a daily chart of SPY.
To discuss this study or download a complete copy of the formula code, please
visit the members community section of our website at https://www.esignal.com/members/community or
visit our KnowledgeBase at https://kb.esignal.com.
The eSignal formula script (EFS) is also available for copying & pasting here:
/*********************************
Provided By:
eSignal (Copyright c eSignal), a division of Interactive Data
Corporation. 2016. All rights reserved. This sample eSignal
Formula Script (EFS) is for educational purposes only and may be
modified and saved under a new file name.  eSignal is not responsible
for the functionality once modified.  eSignal reserves the right
to modify and overwrite this EFS file with each new release.

Description:
    RocketRSI - A Solid Propellant For Your Rocket Science Trading by John F. Ehlers

Version:            1.00  21/03/2018

Formula Parameters:                     Default:
Smoothing Length                        8
RSI Length                              10


Notes:
The related article is copyrighted material. If you are not a subscriber
of Stocks & Commodities, please visit www.traders.com.

**********************************/

var fpArray = new Array();

function preMain(){
    setPriceStudy(false);
    setStudyTitle("Rocket RSI");

    var x = 0;
    fpArray[x] = new FunctionParameter("SmLength", FunctionParameter.NUMBER);
	with(fpArray[x++]){
        setName("Smoothing Length");
        setLowerLimit(1);
        setDefault(8);
    }
    fpArray[x] = new FunctionParameter("RSILength", FunctionParameter.NUMBER);
	with(fpArray[x++]){
        setName("RSI Length");
        setLowerLimit(1);
        setDefault(10);
    }
}

var bInit = false;
var bVersion = null;
var xRocketRSI = null

function main(SmLength, RSILength){
    if (bVersion == null) bVersion = verify();
    if (bVersion == false) return;

    if (getCurrentBarCount() <= SmLength + RSILength + 1) return;

    if (getBarState() == BARSTATE_ALLBARS){
        bInit = false;
    }

    if (!bInit){
        var a1 = Math.exp(-Math.SQRT2 * Math.PI / SmLength);
        var b1 = 2 * a1* Math.cos( (Math.PI / 180) * Math.SQRT2 * 180 / SmLength);
        var c2 = b1;
        var c3 = - a1 * a1;
        var c1 = 1 - c2 - c3;

        var xMomentum = mom(RSILength-1);
        var xSSFilter = efsInternal("calc_SSFilter", xMomentum, c1, c2, c3);
        xRocketRSI = efsInternal("calc_RocketRSI", RSILength, xSSFilter);

        addBand(0, PS_DASH, 1, Color.grey, 1);

        bInit = true;
    }

    if( xRocketRSI.getValue(0) != null) return xRocketRSI.getValue(0);
}

var nSSFilter = 0;
var nSSFilter_1 = 0;
var nSSFilter_2 = 0;

function calc_SSFilter(xMomentum, c1, c2, c3){
    if (xMomentum.getValue(-1) == null) return;

    if (getBarState() == BARSTATE_NEWBAR){
        nSSFilter_2 = nSSFilter_1;
        nSSFilter_1 = nSSFilter;
    }

    nSSFilter = c1 * (xMomentum.getValue(0) + xMomentum.getValue(-1)) / 2 + c2 * nSSFilter_1 + c3 * nSSFilter_2;

    if (nSSFilter == null) return;

    return nSSFilter;
}

function calc_RocketRSI(RSILength, xSSFilter){
    if (xSSFilter.getValue(-RSILength - 1) == null) return;

    var nCU = 0;
    var nCD = 0;
    var nMyRSI = 0;
    var nRocketRSI = 0;

    for (var i = 0; i < RSILength; i++){

        if (xSSFilter.getValue(-i) - xSSFilter.getValue(-i - 1) > 0)
            nCU += (xSSFilter.getValue(-i) - xSSFilter.getValue(-i - 1));

        if (xSSFilter.getValue(-i) - xSSFilter.getValue(-i - 1) < 0)
            nCD += (xSSFilter.getValue(-i - 1) - xSSFilter.getValue(-i));
    }


    if ((nCU + nCD) != 0) nMyRSI = (nCU - nCD) / (nCU + nCD);

    if (nMyRSI > 0.999) nMyRSI = 0.999;
    if (nMyRSI < -0.999) nMyRSI = -0.999;

    nRocketRSI = 0.5 * Math.log((1 + nMyRSI) / (1 - nMyRSI));

    return nRocketRSI;
}

function verify(){
    var b = false;
    if (getBuildNumber() < 779){

        drawTextAbsolute(5, 35, "This study requires version 10.6 or later.",
            Color.white, Color.blue, Text.RELATIVETOBOTTOM|Text.RELATIVETOLEFT|Text.BOLD|Text.LEFT,
            null, 13, "error");
        drawTextAbsolute(5, 20, "Click HERE to upgrade.@URL=https://www.esignal.com/download/default.asp",
            Color.white, Color.blue, Text.RELATIVETOBOTTOM|Text.RELATIVETOLEFT|Text.BOLD|Text.LEFT,
            null, 13, "upgrade");
        return b;
    }
    else
        b = true;

    return b;
}
—Eric Lippert
eSignal, an Interactive Data company
800 779-6555, www.eSignal.com
BACK TO LIST

WEALTH-LAB: MAY 2018
In good tradition, in this issue we’re pleased to find two new indicators
introduced by John Ehlers in his article, “RocketRSI—A Solid Propellant For
Your Rocket Science Trading.” Is RocketRSI the new dawn for the RSI? Let’s
take a look.
From our brief encounter with this new indicator, it seems that its applicability
greatly depends on finding the dominant cycle period. The “$64,000 question”
is whether this cycle actually exists in the data, and how stable it is over
time.
We created a barebones system to put to test the idea that a spike below -2
provides a long entry timing signal (we’ll skip the opposite signal this time).
Figure 3 illustrates some typical entries. Its only exit rule is to “exit after fixed
bars” (where fixed bars is a parameter). Looking ahead, this
parameter had the biggest impact on the system’s net profit (as shown in Figure
4). Then we ran a portfolio simulation on 10 years of daily data for the 30
DJIA stocks allocating 10% equity to each signal.
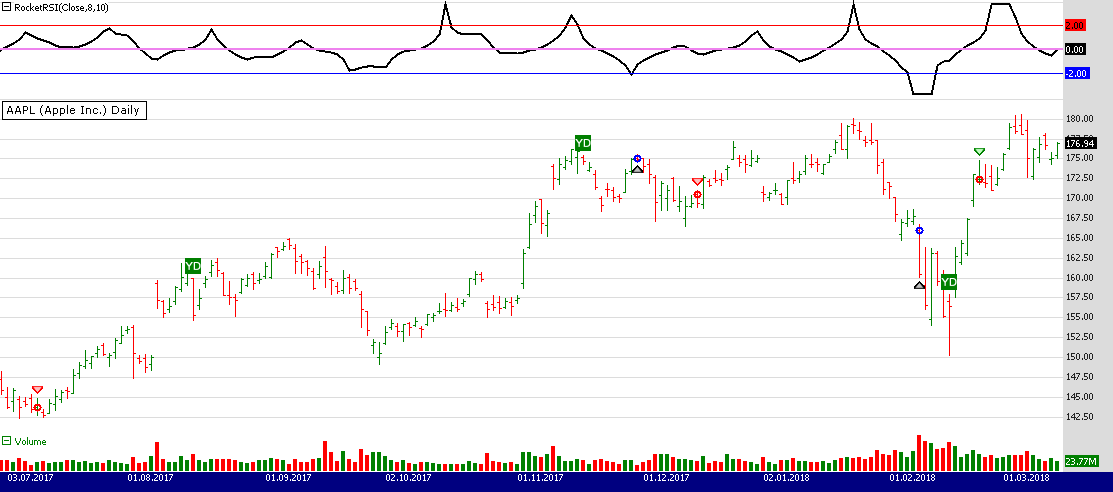
FIGURE 3: WEALTH-LAB. This shows
some typical long entries following spikes below -2 standard deviations on
a daily chart of Apple (AAPL).
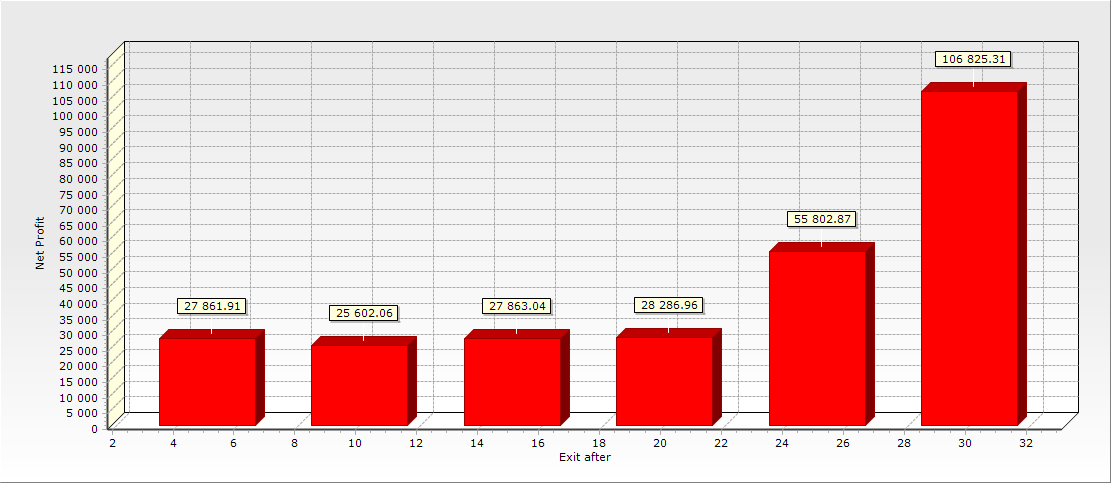
FIGURE 4: WEALTH-LAB. Increasing
the bars to hold parameter had the most visible effect on the system’s net
profit.
On a 3D optimization graph we plotted the system’s net profit on axis Y, and
the RSI length and fixed bars parameters on axes X and Z, respectively (Figure
5).
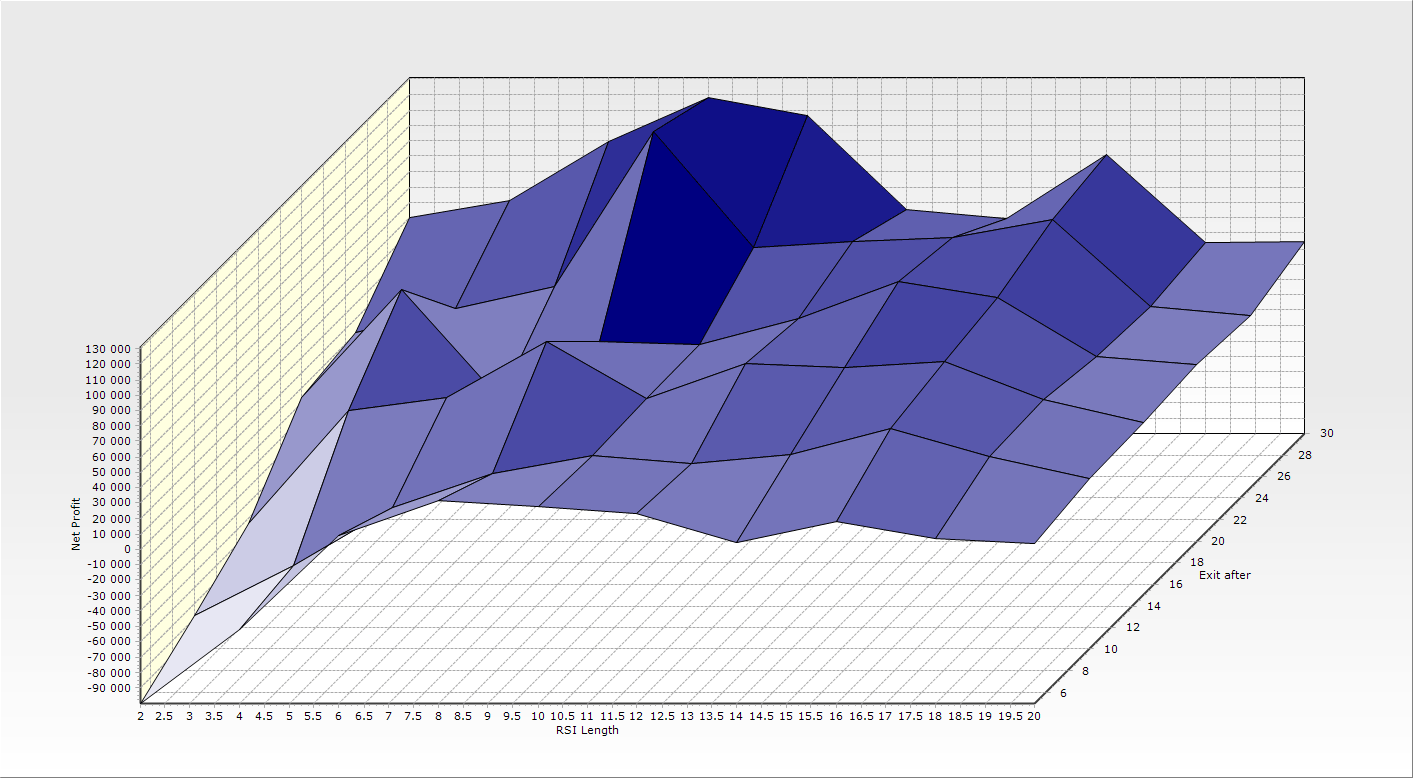
FIGURE 5: WEALTH-LAB. This 3D optimization
graph plots the system’s net profit on axis Y, the RSI length on axis x,
and fixed bars parameters on axis Z.
The best net profit amount came from the eight-period RSI length, which suggests
that there may be a 16-bar cycle period in the 30 DJIA stocks. However, the
3D graph indicates there’s a sharp peak around this value. The smooth area
of the curve nearby suggests a stable and profitable zone with multiple adjacent
parameter values, which leads to more consistent results. Hence, we’d rather
pick the half-cycle period from this area in the 10 to 14 ballpark—which is
close to the author’s suggestion.
To give the RocketRSI the more thorough testing that it deserves and to start
building your own systems, install or update our TASCIndicators library to
its latest version and restart Wealth-Lab. This makes it instantly applicable
to any building blocks called rules. By simply combining and reordering
them, the user can come up with fairly elaborate strategies. The test system’s
code follows:
Wealth-Lab strategy code C#

using System;
using System.Collections.Generic;
using System.Text;
using System.Drawing;
using WealthLab;
using WealthLab.Indicators;
using TASCIndicators;

namespace WealthLab.Strategies
{
	public class MyStrategy : WealthScript
	{
		StrategyParameter slider1;
		StrategyParameter slider2;
		StrategyParameter paramExitDays;

		public MyStrategy()
		{
			slider1 = CreateParameter("Smoothing Length", 8, 2, 20, 2);
			slider2 = CreateParameter("RSI Length", 10, 2, 20, 2);
			paramExitDays = CreateParameter("Exit after", 10, 5, 30, 5);
		}

		protected override void Execute()
		{
			var rr = RocketRSI.Series(Close,slider1.ValueInt,slider2.ValueInt);
			var fixedBars = paramExitDays.ValueInt;

			for(int bar = GetTradingLoopStartBar(1); bar < Bars.Count; bar++)
			{
				if (IsLastPositionActive)
				{
					Position p = LastPosition;
					if ( bar+1 - p.EntryBar >= fixedBars )
						SellAtMarket( bar+1, p, "Exit after N bars" );
				}
				else
				{
					if( rr[bar] <= -2.0 )
						BuyAtMarket(bar+1);
				}
			}

			var ls = LineStyle.Solid;
			ChartPane paneRocketRSI = CreatePane(40,true,true);
			PlotSeries(paneRocketRSI,rr,Color.Black,ls,2);
			DrawHorzLine(paneRocketRSI,0,Color.Violet,ls,2);
			DrawHorzLine(paneRocketRSI,2,Color.Red,ls,1);
			DrawHorzLine(paneRocketRSI,-2,Color.Blue,ls,1);
		}
	}
}
—Gene Geren & Robert Sucher
Wealth-Lab (MS123, LLC)
www.wealth-lab.com
BACK TO LIST

AMIBROKER: MAY 2018
In “RocketRSI—A Solid Propellant For Your Rocket Science Trading” in this
issue, author John Ehlers presents a new variation of the RSI indicator. The
AmiBroker code listing shown here provides a ready-to-use formula. To adjust
parameters, right-click on the chart and select parameters from the
context menu.
// RocketRSI Indicator
// based on TS code by John F. Ehlers, S&C May 2018

SmoothLength = Param("SmoothLength", 10, 2, 50 );
RSILength = Param("RSILength", 10, 2, 50 );

// Compute Super Smoother coefficients once

PI = 3.1415926;

a1 = exp( -1.414 * PI / SmoothLength );
b1 = 2 * a1 * Cos( 1.414 * PI / SmoothLength );
c2 = b1;
c3 = -a1 * a1;
c1 = 1 - c2 - c3;

// Create half dominant cycle Momentum
Mom = Close - Ref( Close, RSILength - 1 );

// SuperSmoother Filter
Filt = IIR( Mom, 0.5 * c1, c2, 0.5 * c1, c3 );

// Accumulate "Closes Up" and "Closes Down"
Diff = Ref( Filt, -1 ) - Filt;

Up = Max( Diff, 0 );
Dn = Max( -Diff, 0 );

CU = Sum( Up, RSILength );
CD = Sum( Dn, RSILength );

MyRSI = ( CU - CD ) / ( CU + CD );

MyRSI = Ref( MyRSI, - RSILength + 1 );

// Limit RocketRSI output to +/- 3 Standard Deviations

MyRSI = Min( 0.999, MyRSI );
MyRSI = Max( -0.999, MyRSI );

// Apply Fisher Transform to establish Gaussian Probability Distribution
RocketRSI = .5 * Log( ( 1 + MyRSI ) / ( 1 - MyRSI ) );

Plot( RocketRSI, "RocketRSI" + _PARAM_VALUES(), colorRed, styleThick );

Plot( 0, "", colorBlue, styleNoLabel );
A sample chart is shown in Figure 6.
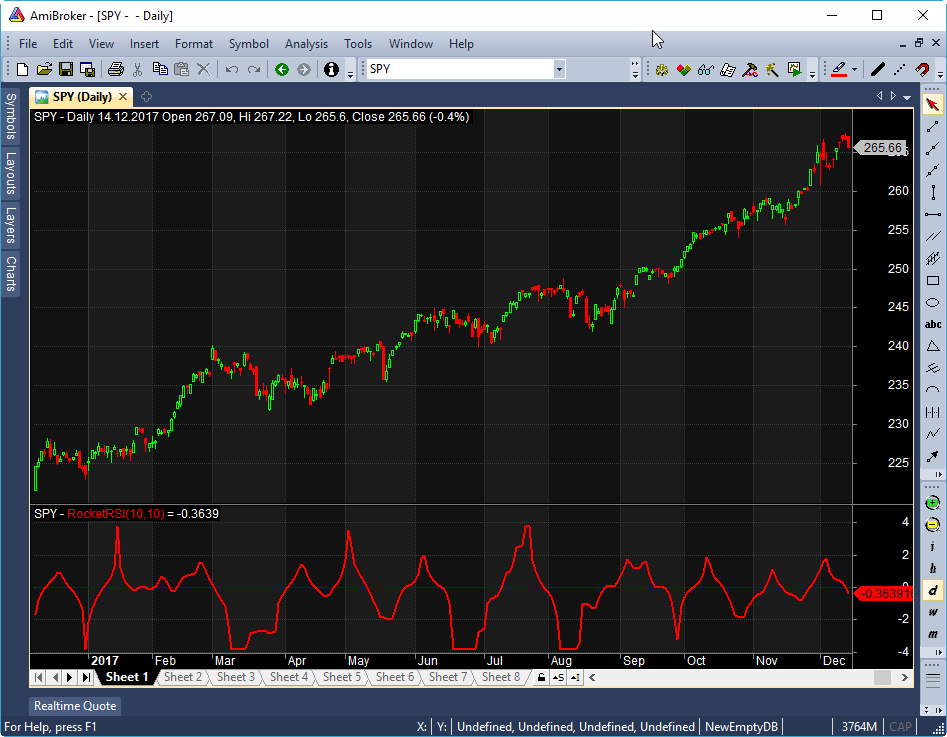
FIGURE 6: AMIBROKER. Here is a
daily chart of the SPY (upper pane) with the RocketRSI (lower pane), replicating
a chart from Ehlers’ article in this issue.
—Tomasz Janeczko, AmiBroker.com
www.amibroker.com
BACK TO LIST

NEUROSHELL TRADER: MAY 2018
The RocketRSI indicator presented by John Ehlers in his article in this issue,
“RocketRSI—A Solid Propellant For Your Rocket Science Trading,” can be easily
implemented in NeuroShell Trader using NeuroShell Trader’s ability to call
external dynamic linked libraries. Dynamic linked libraries can be written
in C, C++ and Power Basic.
After moving the code given in the article to your preferred compiler and
creating a DLL, you can insert the resulting indicator as follows:
- Select new indicator from the insert menu.
- Choose the External Program & Library Calls category.
- Select the appropriate external DLL call indicator.
- Set up the parameters to match your DLL.
- Select the finished button.
Users of NeuroShell Trader can go to the Stocks & Commodities section
of the NeuroShell Trader free technical support website to download a copy
of this or any previous Traders’ Tips.
A sample chart is shown in Figure 7.

FIGURE 7: NEUROSHELL TRADER. This
sample NeuroShell Trader chart shows the RocketRSI on a chart of SPY.
—Marge Sherald, Ward Systems Group, Inc.
301 662-7950, sales@wardsystems.com
www.neuroshell.com
BACK TO LIST

TRADERSSTUDIO: MAY 2018
The TradersStudio code based on John Ehlers’ article in this issue, “RocketRSI—A
Solid Propellant For Your Rocket Science Trading,” is provided at www.TradersEdgeSystems.com/traderstips.htm as
well as here:
'RocketRSI
'Author: John Ehlers, TASC May 2018
'Coded by: Richard Denning, 3/12/18
'www.TradersEdgeSystems.com

Function RocketRSI(SmoothLength, RSILength)
    Dim a1
    Dim b1
    Dim c1
    Dim c2
    Dim c3
    Dim Filt As BarArray
    Dim count
    Dim CU
    Dim CD
    Dim myRSI

    'SmoothLength = 8
    'RSILength = 10

    If CurrentBar - 1 Then
        a1 = Exp(-1.414*3.14159 / (SmoothLength))
        b1 = 2*a1*Cos(DegToRad(1.414*180 / (SmoothLength)))
        c2 = b1
        c3 = -a1*a1
        c1 = 1 - c2 - c3
    End If
    Filt = c1*(Close + Close[1]) / 2 + c2*Filt[1] + c3*Filt[2]
    CU = 0
    CD = 0
    For count = 0 To RSILength -1
        If Filt[count] - Filt[count + 1] > 0 Then
            CU = CU + Filt[count] - Filt[count + 1]
        End If
        If Filt[count] - Filt[count + 1] < 0 Then
            CD = CD + Filt[count + 1] - Filt[count]
        End If
    Next
    If CU + CD <> 0 Then
         myRSI = (CU - CD) / (CU + CD)
    End If
    If myRSI > 0.999 Then myRSI = 0.999
    If myRSI < -0.999 Then myRSI = -0.999
    RocketRSI = 0.5*Log((1+myRSI) / (1 - myRSI))
End Function
'---------------------------------------------------------------
Sub Ehlers_RocketRSI_IND(SmoothLength, RSILength)
  Dim MyRSI
  MyRSI = RocketRSI(SmoothLength,RSILength)
  plot1(MyRSI)
  plot2(0)
End Sub
'----------------------------------------------------------------
Figure 8 shows the RocketRSI indicator (yellow line) on a chart of S&P
500 futures contract (SP) during part of 2006 and 2007.

FIGURE 8: TRADERSSTUDIO. This shows
the RocketRSI indicator (yellow line) on a chart of S&P 500 futures (SP)
during part of 2006 and 2007.
—Richard Denning
info@TradersEdgeSystems.com
for TradersStudio
BACK TO LIST

QUANTACULA: MAY 2018
We added John Ehlers’ RocketRSI indicator (described in his article in this
issue, “RocketRSI—A Solid Propellant For Your Rocket Science Trading”) to our
free TASC Extensions package for Quantacula that you can obtain by clicking
our marketplace link at www.quantacula.com.
Once the extension is installed, you will see the RocketRSI among the other
indicators adapted from previous Traders’ Tips the next time you launch Quantacula
Studio.
You can now use RocketRSI anywhere in the product that accepts an indicator
input, for example, the building block model builder. We built a simple model
by dragging and dropping the following building blocks:
- Entry: Buy at market open
- Condition: Indicator crosses value (RocketRSI
crosses below -2.00)
- Exit: Sell at market open
- Condition: Indicator crosses value (RocketRSI
crosses below 2.00)
Note we used “crosses below 2.00” for the exit condition, rather than “crosses
above 2.00.” This lets the winning positions ride further, and resulted in
a better overall return in our backtesting.
Figure 10 shows the model applied to a chart of Intel Corporation daily historical
data, illustrating how it can pinpoint entry and exit points with surgical
precision. A suggested next step would be to perform some portfolio backtesting
on a universe of data you’re interested in trading.
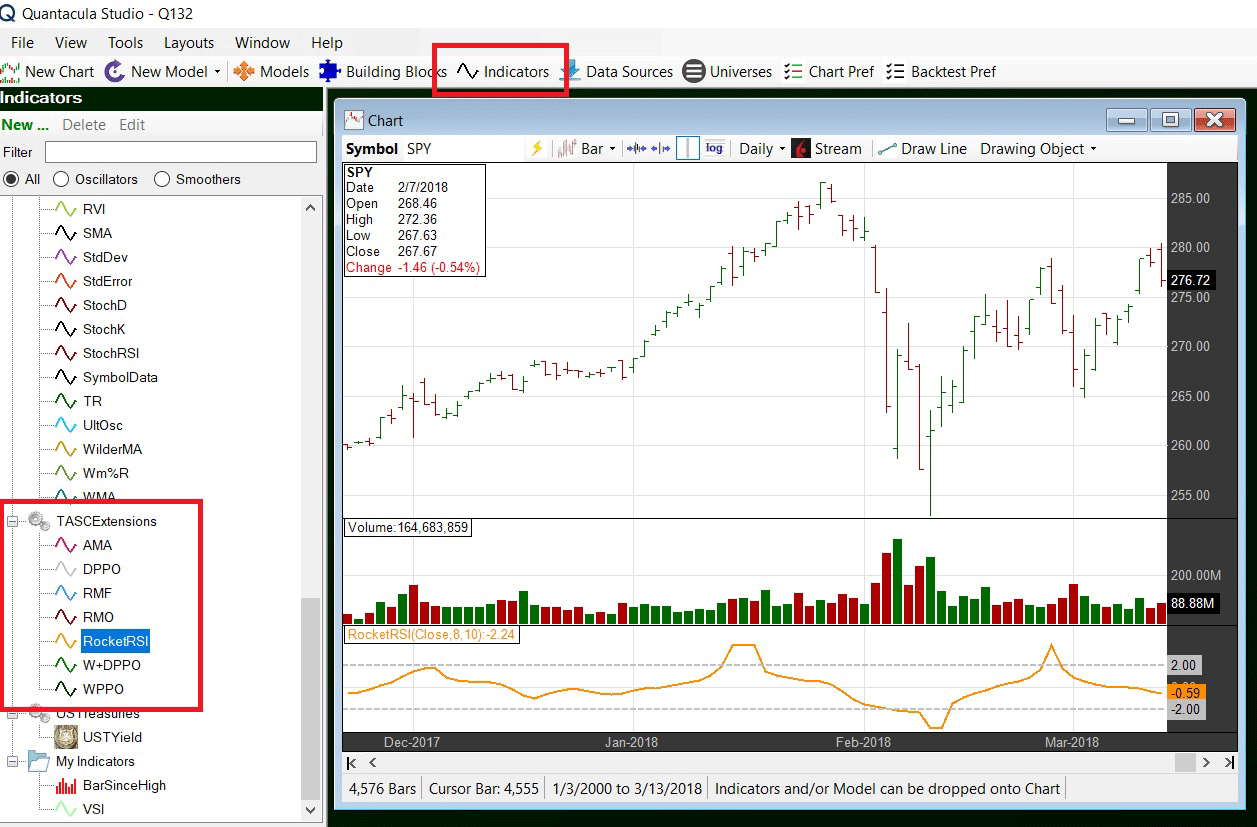
FIGURE 9: QUANTACULA. This sample
chart shows the TASC Extensions indicators and the RocketRSI dragged onto
a chart in Quantacula Studio.
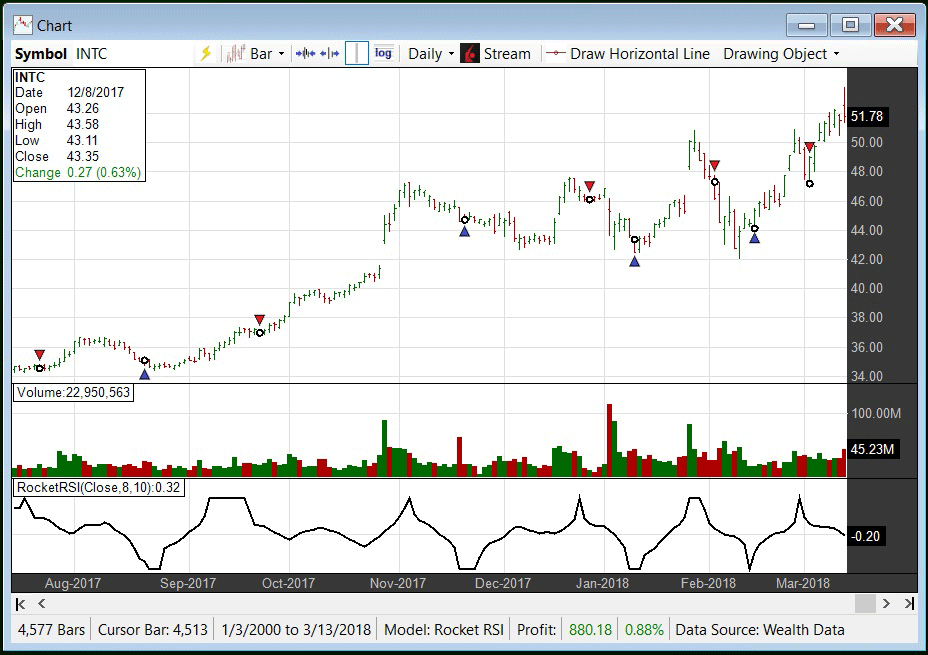
FIGURE 10: QUANTACULA. Here, the
RocketRSI model is applied to Intel Corporation historical data.
—Dion Kurczek, Quantacula LLC
info@quantacula.com
www.quantacula.com
BACK TO LIST

NINJATRADER: MAY 2018
The RocketRSI and MyRSI indicators, as discussed in John Ehlers’ article in
this issue, “RocketRSI—A Solid Propellant For Your Rocket Science Trading,”
is available for download at the following links for NinjaTrader 8 and NinjaTrader
7:
Once the file is downloaded, you can import the indicator in NinjaTader 8
from within the control center by selecting Tools → Import → NinjaScript
Add-On and then selecting the downloaded file for NinjaTrader 8. To import
in NinjaTrader 7, from within the control center window, select the menu File → Utilities → Import
NinjaScript and select the downloaded file.
You can review the indicators’ source code in NinjaTrader 8 by selecting the
menu New → NinjaScript Editor → Indicators from within the control
Center window and selecting the RocketRSI and MyRSI files. You can review the
indicators’ source code in NinjaTrader 7 by selecting the menu Tools → Edit
NinjaScript → Indicator from within the control center window and selecting
the RocketRSI and MyRSI files.
NinjaScript uses compiled DLLs that run native, not interpreted, which provides
you with the highest performance possible.
A sample chart implementing the strategy is shown in Figure 11.

FIGURE 11: NINJATRADER. Here, the
RocketRSI and MyRSI indicators are shown on a daily SPY chart.
—Raymond Deux & Jim Dooms
NinjaTrader, LLC
www.ninjatrader.com
BACK TO LIST

TRADE NAVIGATOR: MAY 2018
The RocketRSI indicator presented by John Ehlers in his article in this issue,
“RocketRSI—A Solid Propellant For Your Rocket Science Trading,” has now been
recreated in Trade Navigator software for your use. If you have an older version
of the software, you can get the indicator by downloading the upgrade special file.
When prompted to upgrade, click the yes button. If prompted to close
all software, click on the continue button. It should automatically
re-import and verify the libraries. Once the program restarts, you will then
be able to hit the “A” key on your keyboard and then select the RocketRSI indicator
from the list under the indicators tab.
If you would like to recreate the indicator manually, the TradeSense language
for it is as follows:
&Mom := Expression - (Expression).(RsiLength - 1)
&Filt := Ehlers SuperSmoother (&Mom , SmoothLength)
&CU := MovingSum (&Filt - (&Filt).1 , RsiLength , 1)
&CD := MovingSum ((&Filt).1 - &Filt , RsiLength , 1)
&MyRSI := (&CU - &CD) / (&CU + &CD)
&LimitRSI := IFF (&MyRSI > 0.999 , 0.999 , IFF (&MyRSI < -0.999 , -0.999 , &MyRSI))
0.5 * Log ((1 + &LimitRSI) / (1 - &LimitRSI))
Creating a function
To create this indicator manually, click on the edit dropdown menu
and open the trader’s toolbox (or use CTRL + T) and click on the functions
tab. Now click on the new button, and a new function dialog
window will open. Type the code for the indicator into the text box. Please
ensure there are no extra spaces at the end of each line. When completed, click
on the verify button. You may be presented with an add inputs popup
message if there are variables in the code. If so, click the yes button,
then enter the values in the default value column (close, 8, and 10
are the default values in this case). If all is well, when you click on the function tab,
the code you entered will convert to italic font. Now click on the save button,
and type a name for the indicator.
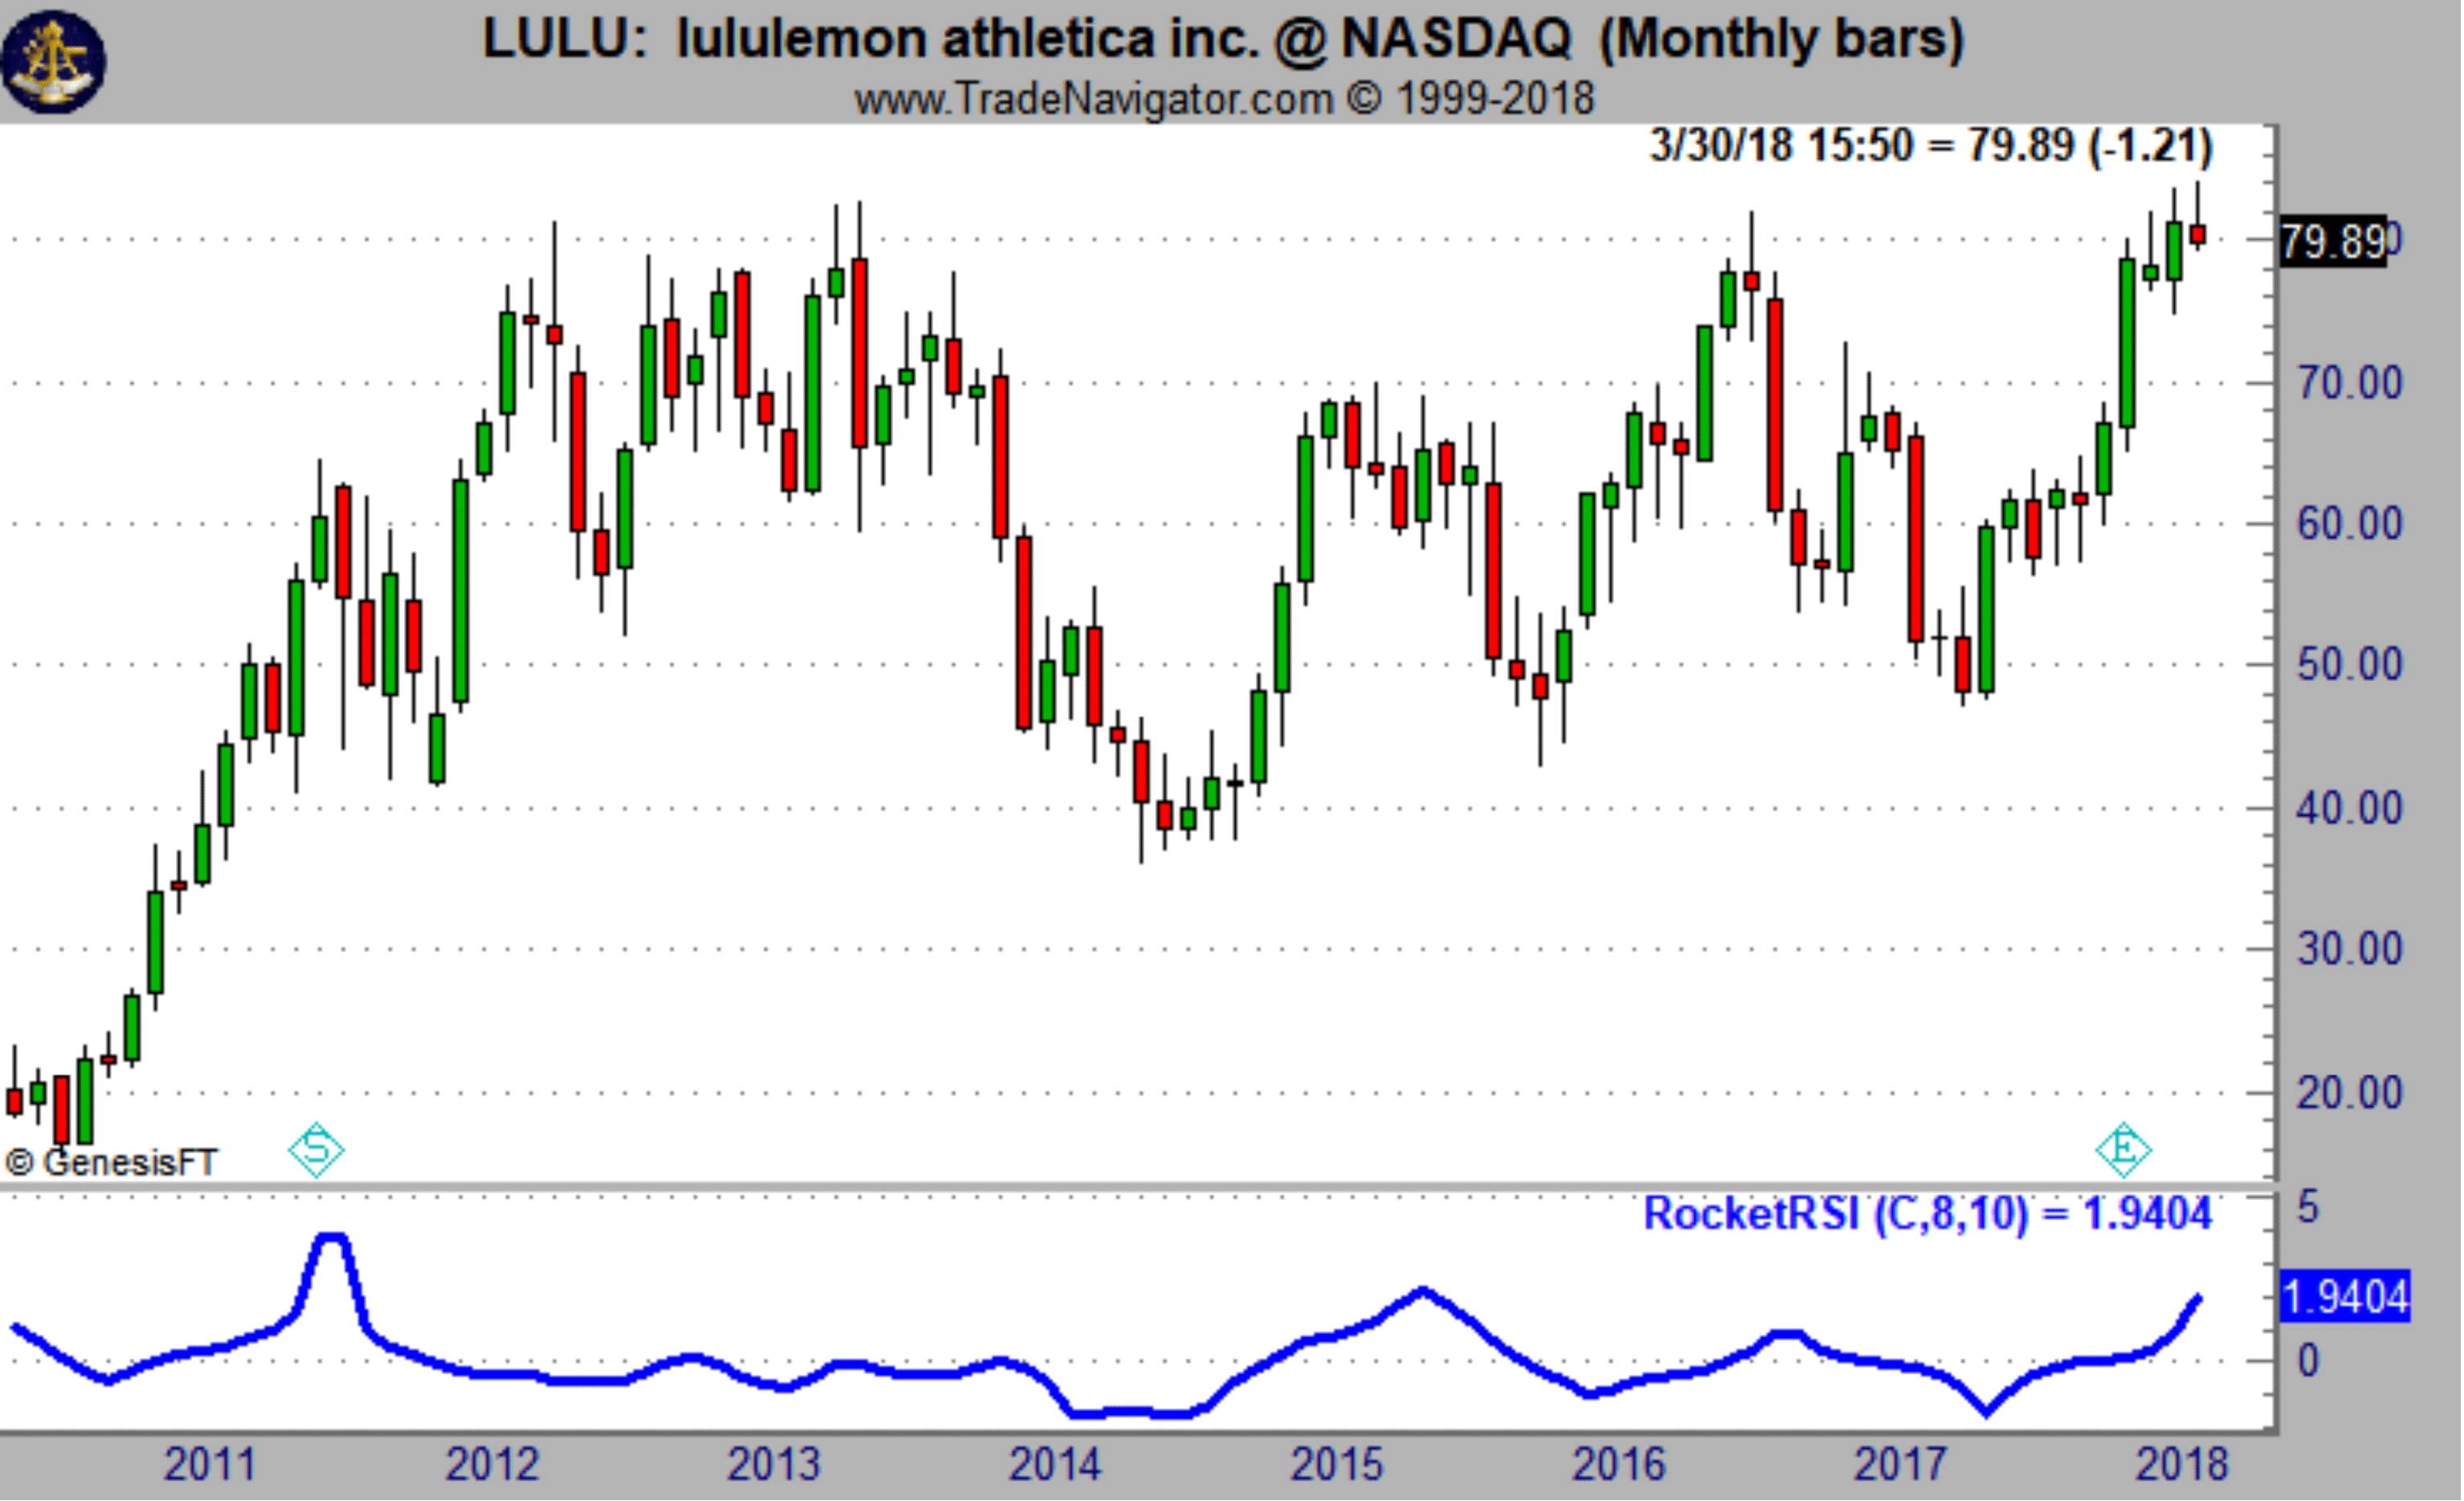
FIGURE 12: TRADE NAVIGATOR. This
shows the RocketRSI indicator on LULU.
If you have any difficulty creating the indicators or would like help recreating
the chart shown here, our technical support staff would be happy to help. Call
719 884-0245 or click on the live chat tool located under Trade Navigator’s
help menu or at the top of our homepage. Our support hours are M-F 6am–6pm
US Mountain Time. Happy trading!
—Genesis Financial Technologies
Tech support 719 884-0245
www.TradeNavigator.com
BACK TO LIST
MICROSOFT EXCEL: MAY 2018
In his article in this issue, “RocketRSI—A Solid Propellant For Your Rocket
Science Trading,” John Ehlers provides us with two variants on the RSI calculation.
For the first variation, MyRSI, Ehlers uses his SuperSmoother filter on bar-by-bar
closing price deltas and calculates MyRSI using these filtered values (Figure
13).

FIGURE 13: EXCEL, MYRSI
For the second variation, RocketRSI, Ehlers uses his SuperSmoother filter
on a momentum value that is the difference between the current close and the
close from RSI length bars previous. Then he computes an RSI using
the filtered momentum values and applies a Fisher transform to this RSI value
to arrive at the value of the RocketRSI (Figure 14).

FIGURE 14: EXCEL, ROCKET RSI
The spreadsheet file for this Traders’ Tip can be downloaded
here. To successfully download it, follow these steps:
- Right-click on the Excel
file link, then
- Select “save as” (or “save target as”) to place
a copy of the spreadsheet file on your hard drive.
A fix for previous Excel spreadsheets, required due to Yahoo modifications, can be found here: https://traders.com/files/Tips-ExcelFix.html
—Ron McAllister
Excel and VBA programmer
rpmac_xltt@sprynet.com
BACK TO LIST
Originally published in the May 2018 issue of
Technical Analysis of STOCKS & COMMODITIES magazine.
All rights reserved. © Copyright 2018, Technical Analysis, Inc.


