TRADERS’ TIPS
June 2018
For this month’s Traders’ Tips, the focus is Markos Katsanos’ article
in this issue, “A Technical Method For Rating Stocks.” Here,
we present the June 2018 Traders’ Tips code with possible implementations
in various software.
You can right-click on any chart to open it in a new tab or window
and view it at it’s originally supplied size, often much larger than
the version printed in the magazine.
AmiBroker AFL code is also provided by Katsanos in the article, which S&C
subscribers will find in the Article Code section of our website here.
The Traders’ Tips section is provided to help the reader implement
a selected technique from an article in this issue or another recent issue.
The entries here are contributed by software developers or programmers for
software that is capable of customization.

TRADESTATION: JUNE 2018
In “A Technical Method For Rating Stocks” in this issue, author Markos Katsanos
presents a stock rating system using five different technical measures, a rating
system that he states compares favorably to the better-known analyst ratings
that many investors follow.
Here, we are providing TradeStation EasyLanguage code for an indicator based
on the author’s work. In addition to using the indicator in TradeStation charts
and RadarScreen for real-time analysis, the indicator is also suitable for
use in TradeStation Scanner to assist you in searching the market for opportunities.
Indicator: Technical Rating
// TASC Jun 2018
// Markos Katsanos
// Technical Rating System

using elsystem ;
using tsdata.common ;
using tsdata.marketdata ;

inputs:
	Coef( .2 ),
	VCoef( 2.5 ),
 	VFIPeriod( 130 ),
	VFISmoothedPeriod( 3 ),
	MA100Length( 100 ),
	MarketTrendSymbol( "SPY" ) ;

variables:
	oCutOff( 0 ),
	oVC( 0 ),
	oMF( 0 ),
	oVFI( 0 ),
 	VFI( 0 ),
	MyVolume( 0 ),
	MA100Value( 0 ),
	Stiffness( 3 ),
	MktTrendAvgVal( 0 ),
	Cond1( 0 ),
	Cond2( 0 ),
	Cond3( 0 ),
	Cond4( 0 ),
	Cond5( 0 ),
	ConditionSum( 0 ),
	PriceSeriesProvider PSP1( NULL ) ;


constants:
	Cond1Weight( 1 ),
	Cond2Weight( 1 ),
	Cond3Weight( 1 ),
	Cond4Weight( 1 ),
	Cond5Weight( 2 ) ;

once
	begin
	PSP1 = new PriceSeriesProvider ;
	PSP1.Symbol = MarketTrendSymbol ;
	PSP1.Interval.ChartType = DataChartType.Bars ;
	PSP1.Interval.IntervalType = DataIntervalType.Daily ;
	PSP1.Interval.IntervalSpan = 1 ;
	PSP1.Range.FirstDate =
	DateTime.FromELDateAndTime( Date[MaxBarsBack],
		Time[MaxBarsBack] )
		- TimeSpan.Create( 100, 0, 0, 0 ) ;
	PSP1.Realtime = true;
	PSP1.Load = true ;
	Value99 = PSP1.Count ;
	end ;

// Calculate VFI
// For Condition 1
// See TASC JUN 2004 for this
// author's discussion of VFI
MyVolume = iff( BarType < 2, Ticks, Volume );
VFI = VFISmooth(Coef, VCoef, VFIPeriod, VFISmoothedPeriod,
	MyVolume, oCutOff, oVC, oMF, oVFI ) ;
if VFI > 0 then
	Cond1 = Cond1Weight
else
	Cond1 = 0 ;

// Calculate MA100
// For Conditions 2 and 3
MA100Value = Average( Close, MA100Length ) ;
if Close > MA100Value then
	Cond2 = Cond2Weight
else
	Cond2 = 0 ;

if MA100Value > MA100Value[4] then
	Cond3 = Cond3Weight
else
	Cond3 = 0 ;

// Calculate Stiffness for Cond4
Stiffness = Countif( Close < MA100Value, 63 ) ;
if Stiffness < 7 then
	Cond4 = Cond4Weight
else
	Cond4 = 0 ;

// Calculate Market Direction
if PSP1.Count > 100 then
	MktTrendAvgVal = Average( PSP1.Close, 100 ) ;
if MktTrendAvgVal > MktTrendAvgVal[2] then
	Cond5 = Cond5Weight
else
	Cond5 = 0 ;

ConditionSum = Cond1 + Cond2 + Cond3 + Cond4 + Cond5 ;

Plot1( ConditionSum, "Cond Sum" ) ;

Function: VFISmooth
// Markos Katsanos
// Originally presented in
// TASC JUN 2004

Inputs:
	Coef( NumericSimple ),
	VCoef( NumericSimple ),
 	Period( NumericSimple ),
	SmoothedPeriod( NumericSimple ),
	MyVolume( NumericRef ),
	CutOff( NumericRef ),
	VC( NumericRef ),
 	MF( NumericRef ),
    VFI( NumericRef ) ;
variables:
	MyTypicalPrice( 0 ),
 	Inter( 0 ),
    VInter( 0 ),
	Vave( 0 ),
	MyVolAvg( 0 ),
	VMax( 0 ),
	DirectionalVolume( 0 ) ;

MyTypicalPrice = TypicalPrice ;
MyVolAvg = Average( MyVolume, Period ) ;
MF = MyTypicalPrice - MyTypicalPrice[ 1 ] ;

if MyTypicalPrice > 0 and MyTypicalPrice[ 1 ] >0 then
	begin
	Inter = Log( MyTypicalPrice ) - Log( MyTypicalPrice[ 1 ] ) ;
	VInter = StdDev( Inter, 30 ) ;
	CutOff = Coef * VInter * Close;
	VAve = MyVolAvg[ 1 ] ;
	VMax = VAve * VCoef;
	VC = IFF( MyVolume < VMax , MyVolume, VMax ) ;
	DirectionalVolume = IFF( MF > CutOff, +VC, IFF( MF < -CutOff, -VC, 0 ) ) ;
	VFI = Summation( DirectionalVolume, Period ) / VAve ;
	VFISmooth = XAverage( VFI, SmoothedPeriod ) ;
	end
else
	VFISmooth = 0 ;
To download the EasyLanguage code for the indicator presented here, please
visit our TradeStation and EasyLanguage support forum. The code for this article
can be found here: https://community.tradestation.com/Discussions/Topic.aspx?Topic_ID=152631.
The ELD filename is “TASC_JUN2018.ELD.”
For more information about EasyLanguage in general, please see https://developer.tradestation.com/easylanguage.
A sample chart is shown in Figure 1.

FIGURE 1: TRADESTATION. Here is
the technical rating system indicator in a TradeStation Scanner and applied
to a daily chart of DIS.
This article is for informational purposes. No type of trading or investment
recommendation, advice, or strategy is being made, given, or in any manner
provided by TradeStation Securities or its affiliates.
—Doug McCrary
TradeStation Securities, Inc.
www.TradeStation.com
BACK TO LIST

METASTOCK: JUNE 2018
In “A Technical Method For Rating Stocks” in this issue, author Markos Katsanos
explains a system he created to rate stocks solely on technical indicators.
Here is the MetaStock formula for this rating system:
s1:= Security("ONLINE:SPY", C);
VFIPeriod := 130;
MADL:= 100;
{VFI formula}
Coef:= 0.2;
VCoef:= 2.5;
inter:= Log( Typical() ) - Log( Ref( Typical(), -1 ) );
Vinter:= Stdev(inter, 30 );
Cutoff:= Coef * Vinter * CLOSE;
Vave := Ref( Mov( V, VFIPeriod, S ), -1 );
Vmax := Vave * Vcoef;
Vc := Min( V, VMax );
MF := Typical() - Ref( Typical(), -1 );
VCP := If( MF > Cutoff, VC, If( MF < -Cutoff, -VC, 0 ) );
VFIa := Sum( VCP , VFIPeriod )/Vave;
VFI := If(BarsSince(Cum(1)>268)>=0, Mov( VFIa, 3, E),0);

MA:= Mov(C, MADL, S);
stiffness:= Sum(C < MA , 63);

rating:= (VFI>0) +
(C > MA) +
(MA > Ref( MA, -4)) +
(stiffness <= 7 ) +
((Mov(s1, MADL, E) > Ref(Mov(s1, MADL, E),-2))*2);
rating
—William Golson
MetaStock Technical Support
www.metastock.com
BACK TO LIST

eSIGNAL: JUNE 2018
For this month’s Traders’ Tip, we’ve provided the study Inverse_ETF_Breakouts.efs based
on the article by Ken Calhoun in this issue, “Inverse ETF Breakouts.” The study
is designed to be used when the market sells off.
The study contains formula parameters that may be configured through the edit
chart window (right-click on the chart and select “edit chart”). A sample
chart is shown in Figure 2.

FIGURE 2: eSIGNAL. Here is an example
of the Inverse_ETF_Breakouts.efs study plotted on a daily chart of SDS.
To discuss this study or download a complete copy of the formula code, please
visit the EFS Library Discussion Board forum under the forums link
from the support menu at www.esignal.com or
visit our EFS KnowledgeBase at https://www.esignal.com/support/kb/efs/.
The eSignal formula script (EFS) is also available for copying & pasting here:
/*********************************
Provided By:
eSignal (Copyright c eSignal), a division of Interactive Data
Corporation. 2016. All rights reserved. This sample eSignal
Formula Script (EFS) is for educational purposes only and may be
modified and saved under a new file name.  eSignal is not responsible
for the functionality once modified.  eSignal reserves the right
to modify and overwrite this EFS file with each new release.

Description:
    Inverse ETF Beakouts by Ken Calhoun

Version:            1.00  04/11/2018

Formula Parameters:                     Default:
SMA Length                              200
Range Period                            90
Trigger Level above MA                  2


Notes:
The related article is copyrighted material. If you are not a subscriber
of Stocks & Commodities, please visit www.traders.com.

**********************************/

var fpArray = new Array();

function preMain(){
    setPriceStudy(true);
    setCursorLabelName("SMA", 0);

    var x=0;
    fpArray[x] = new FunctionParameter("SMALength", FunctionParameter.NUMBER);
	with(fpArray[x++]){
        setLowerLimit(1);
        setDefault(200);
        setName("SMA Length");
    }

    fpArray[x] = new FunctionParameter("RangePeriod", FunctionParameter.NUMBER);
	with(fpArray[x++]){
        setLowerLimit(1);
        setDefault(90);
        setName("Range Period");
    }

    fpArray[x] = new FunctionParameter("PointVal", FunctionParameter.NUMBER);
	with(fpArray[x++]){
        setLowerLimit(0);
        setDefault(2);
        setName("Trigger Level above MA");
    }
}

var bInit = false;
var bVersion = null;
var bIsLong = false;
var bWaitNextBar = false;
var bIsBreakout = false;
var xSMA = null;
var xHigh = null;
var xLow = null;
var xUpperBoundary = null;
var xLowerBoundary = null;
var nExitTarget = 0;

function main(SMALength, RangePeriod, PointVal){

    if (bVersion == null) bVersion = verify();
    if (bVersion == false) return;


    if (getBarState() == BARSTATE_ALLBARS){
        bInit = false;
    }

    if (!bInit){
        bIsLong = false;
        bWaitNextBar = false;
        bIsBreakout = false;
        xSMA = sma(SMALength);
        xHigh = high();
        xLow = low();
        xUpperBoundary = upperDonchian(RangePeriod);
        xLowerBoundary = lowerDonchian(RangePeriod);
        nExitTarget = 0;
        bInit = true;
    }
    if (xSMA.getValue(-1) == null) return;

    if (getBarState() == BARSTATE_NEWBAR) bWaitNextBar = false;

    if (!bWaitNextBar){

        if (xLow.getValue(0) < xSMA.getValue(0)) bIsBreakout = false;

        if (bIsLong){
            if (xLow.getValue(0) <= xSMA.getValue(0) || xHigh.getValue(0) >= nExitTarget){
                drawTextRelative(0, AboveBar1, "\u00EA", Color.red, null, Text.PRESET|Text.CENTER, "Wingdings", 10, "Exit"+rawtime(0));
                drawText("Suggested Long Exit",BottomRow1,Color.red,Text.LEFT,"TextExit"+rawtime(0));
                bIsLong = false;
                bWaitNextBar = true;
            }
        }

        else {
            if (xHigh.getValue(0) >= (xSMA.getValue(0) + PointVal) && !bIsBreakout){
                drawTextRelative(0,BelowBar1, "\u00E9", Color.green, null, Text.PRESET|Text.CENTER, "Wingdings", 10, "Long"+rawtime(0));
                drawText("Suggested Long Entry",TopRow1,Color.green,Text.LEFT,"Text"+rawtime(0));
                bIsLong = true;
                bWaitNextBar = true;
                bIsBreakout = true;
                nExitTarget = (xUpperBoundary.getValue(0) - xLowerBoundary.getValue(0)) + xSMA.getValue(0);
            }

        }

    }

    return xSMA.getValue(0);
}


function verify(){
    var b = false;
    if (getBuildNumber() < 779){

        drawTextAbsolute(5, 35, "This study requires version 10.6 or later.",
            Color.white, Color.blue, Text.RELATIVETOBOTTOM|Text.RELATIVETOLEFT|Text.BOLD|Text.LEFT,
            null, 13, "error");
        drawTextAbsolute(5, 20, "Click HERE to upgrade.@URL=https://www.esignal.com/download/default.asp",
            Color.white, Color.blue, Text.RELATIVETOBOTTOM|Text.RELATIVETOLEFT|Text.BOLD|Text.LEFT,
            null, 13, "upgrade");
        return b;
    }
    else
        b = true;

    return b;
}
—Eric Lippert
eSignal, an Interactive Data company
800 779-6555, www.eSignal.com
BACK TO LIST

WEALTH-LAB.COM: JUNE 2018
The idea of building a customized rating itself is not new, but the good thing
is that the software of today makes this technology available to every trader.
Some WealthScript code for Wealth-Lab for Markos Katsanos’ rating technique,
described in his article in this issue, “A Technical Method For Rating Stocks,”
is presented here. In it, we’ve exposed the various parameters for optimization
as well as for fine-tuning manually by dragging parameter sliders at the bottom-left
of the screen.
A backtest we performed on out-of-sample markets such as German DAX30 concur
with the author’s conclusions. The rating system effectively limits the amount
of exposure to a bear market while still reaping a good profit with a better recovery
factor and less market exposure. See Figure 3.
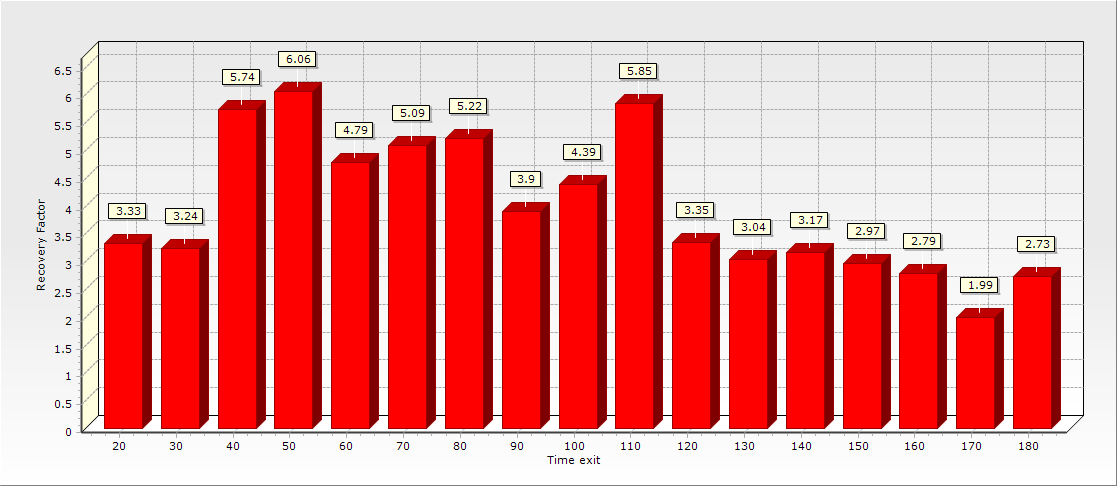
FIGURE 3: WEALTH-LAB. For DAX stocks,
the optimum trade duration was between roughly two to five months, as discovered
in optimization.
To execute the included trading system, Wealth-Lab users need to install (or
update) the latest version of two indicator libraries, TASCIndicators and Community
Indicators, from the extensions section of our website, and restart
Wealth-Lab.
After making sure the libraries are up to date, the volume flow (VFI) indicator
used in the article code will appear under the TASC Magazine Indicators group.
It can be plotted on a chart (Figure 4) and can be used as an entry or exit
condition in a rule-based strategy without having to program any code yourself.
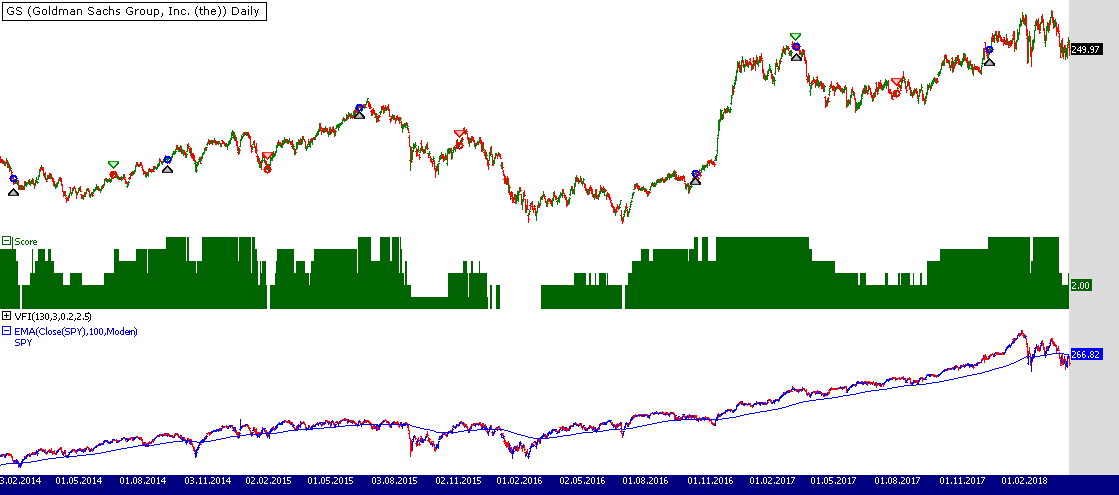
FIGURE 4: WEALTH-LAB. Here’s how
the rating technique avoids taking investing decisions in downtrends, as
can be seen on this chart of Goldman Sachs (GS).
C# Code

using System;
using System.Collections.Generic;
using System.Text;
using System.Drawing;
using WealthLab;
using WealthLab.Indicators;
using TASCIndicators;
using Community.Indicators;

namespace WealthLab.Strategies
{
	public class TASC201806 : WealthScript
	{
		private StrategyParameter _w1;
		private StrategyParameter _w2;
		private StrategyParameter _w3;
		private StrategyParameter _w4;
		private StrategyParameter _w5;
		private StrategyParameter _exit;

		public TASC201806()
		{
			_w1 = CreateParameter("VFI", 1, 1, 1, 1);
			_w2 = CreateParameter("MA", 1, 1, 1, 1);
			_w3 = CreateParameter("MA > MA-4", 1, 1, 1, 1);
			_w4 = CreateParameter("Stiffness", 1, 1, 1, 1);
			_w5 = CreateParameter("Market", 2, 2, 2, 1);
			_exit = CreateParameter("Time exit", 20, 20, 180, 10);
		}

		protected override void Execute()
		{
			//parameters
			int w1 = _w1.ValueInt, w2 = _w2.ValueInt, w3 = _w3.ValueInt, w4 = _w4.ValueInt, w5 = _w5.ValueInt, TimedExit = _exit.ValueInt;
			var vfi = VFI.Series(Bars, 130, 3, 0.2, 2.5);
			var spy = GetExternalSymbol("SPY",true);
			var emaSpy = EMAModern.Series( spy.Close, 100 );
			var maxStiffness = 7;
			var ScoreRating = 5;

			//STIFFNESS
			var MA100 = TASCIndicators.FastSMA.Series(Close, 100);
			var closeBelowMA100 = SeriesIsBelow.Series(Close, MA100, 1);
			var Stiffness = Sum.Series(closeBelowMA100, 63); // DIPS BELOW MA

			var Score = new DataSeries(Bars,"Score");
			for(int bar = 4; bar < Bars.Count; bar++)
			{
				var cond1 = (vfi[bar] > 0) ? 1 : 0; 						//MONEY FLOW
				var cond2 = (Close[bar] > MA100[bar]) ? 1 : 0; 				//MA
				var cond3 = (MA100[bar] > MA100[bar - 4]) ? 1 : 0; 			//MA DIRECTION
				var cond4 = (Stiffness[bar] <= maxStiffness) ? 1 : 0; 		//STIFFNESS
				var cond5 = (emaSpy[bar] >= emaSpy[bar - 2]) ? 1 : 0; 		//MARKET DIRECTION
				Score[bar] = w1*cond1 + w2*cond2 + w3*cond3 + w4*cond4 + w5*cond5;
			}

			for(int bar = GetTradingLoopStartBar(1); bar < Bars.Count; bar++)
			{
				if (IsLastPositionActive)
				{
					Position p = LastPosition;
					if ( bar+1 - p.EntryBar >= TimedExit )
						SellAtMarket( bar+1, p, "Timed" );
				}
				else
				{
					if( Score[bar] > ScoreRating )
						BuyAtMarket( bar+1);
				}
			}

			HideVolume();
			var sp = CreatePane(40,false,true);
			var vp = CreatePane(30,false,true);
			var ep = CreatePane(80,false,true);
			PlotSeries( sp, Score, Color.DarkGreen, LineStyle.Histogram, 3);
					PlotSeries( vp,vfi,Color.FromArgb(255,0,0,0),LineStyle.Solid,2);
			PlotSymbol( ep,spy,Color.Blue,Color.Red);
			PlotSeries( ep,emaSpy,Color.Blue,LineStyle.Solid,1);
		}
	}
}
—Gene Geren (Eugene), Wealth-Lab team
MS123, LLC
www.wealth-lab.com
BACK TO LIST

NEUROSHELL TRADER: JUNE 2018
The stock-rating method described by Markos Katsanos in his article in this
issue, “A Technical Method For Rating Stocks,” can be easily implemented in
NeuroShell Trader by combining a few of the NeuroShell Trader’s 800+ indicators.
To implement the technical indicators, select new indicator from the insert menu
and use the indicator wizard to set up the following indicators:
Volume flow indicator:
TYPICAL:	Avg3 ( High, Low, Close)
CUTOFF:	Multiply3 ( 0.2, StndDev ( Momentum (Ln (TYPICAL),1), 30 ), Close )
VAVE:	LagAvg ( Volume, 1, 130 )
VC:	Min2 ( Volume, Multiply2 ( 2.5, VAVE ) )
MF:	Momentum (TYPICAL, 1 )
VFI:	Divide ( Sum( IfThenIfThenElse ( A>B(MF,CUTOFF), VC, A<B(MF, Negative(CUTOFF)), Negative(VC), 0 ), 130 ), VAVE )
VFICond:	A>B(VFI,0)

Trading above 100-period moving average:
A>B( Close, Avg(Close,100))

Uptrend:
A>B( Momentum( Avg( Close,100),4),0)

Trend quality:
A<=B(Sum(A<B(Close,Avg(Close,100)),63),7)

Market direction:
A>B(Momentum(ExpAvg(SPDRS Close,100),2),0)
To set up the stock rating trading system, select new trading strategy from
the insert menu and enter the following in the appropriate locations
of the trading strategy wizard:
BUY LONG CONDITIONS: [All of which must be true]
A>=B(Add2(Add4(Mul2(1,VFI(High,Low,Close,Volume,0.2,30,2.5,130)),
Mul2(1,A>B(Close,Avg(Close,100))),
Mul2(1,A>B(Momentum(Avg(Close,100),4),0)),
Mul2(1,A>B(Momentum(ExpAvg(SPDRS Close,100),2),0))),
Mul2(2,A<=B(Sum(A<B(Close,Avg(Close,100)),63),7))),5)

SELL LONG CONDITIONS: [All of which must be true]
BarsSinceFill>=X(Trading Strategy,21)
After entering the system conditions, you can also choose whether the parameters
should be optimized. After backtesting the trading strategy, use the detailed
analysis button to view the backtest and trade-by-trade statistics for
the system.
Users of NeuroShell Trader can go to the Stocks & Commodities section
of the NeuroShell Trader free technical support website to download a copy
of this or any previous Traders’ Tips.
A sample chart is shown in Figure 5.

FIGURE 5: NEUROSHELL TRADER. This
NeuroShell Trader chart demonstrates the stock rating indicators and stock
rating system.
—Marge Sherald, Ward Systems Group, Inc.
301 662-7950, sales@wardsystems.com
www.neuroshell.com
BACK TO LIST

NINJATRADER: JUNE 2018
The stock rating system strategy discussed in Markos Katsanos’ article in
this issue, “A Technical Method For Rating Stocks,” is available for download
from the following links for NinjaTrader 8 and NinjaTrader 7:
Once the file is downloaded, you can import the strategy into NinjaTader 8
from within the Control Center by selecting Tools → Import → NinjaScript
add-on and then selecting the downloaded file for NinjaTrader 8. To import
into NinjaTrader 7, from within the Control Center window, select the menu
File → Utilities → Import NinjaScript and select the downloaded file.
You can review the strategy’s source code in NinjaTrader 8 by selecting the
menu New → NinjaScript editor → Strategies from within the Control
Center window and selecting the “StockRatingSystem” file. You can review the
strategy’s sourcecode in NinjaTrader 7 by selecting the menu Tools → Edit
NinjaScript → Strategy from within the Control Center window and selecting
the “StockRatingSystem” file.
NinjaScript uses compiled DLLs that run native, not interpreted, which provides
you with the highest performance possible.
A sample chart implementing the strategy is shown in Figure 6.
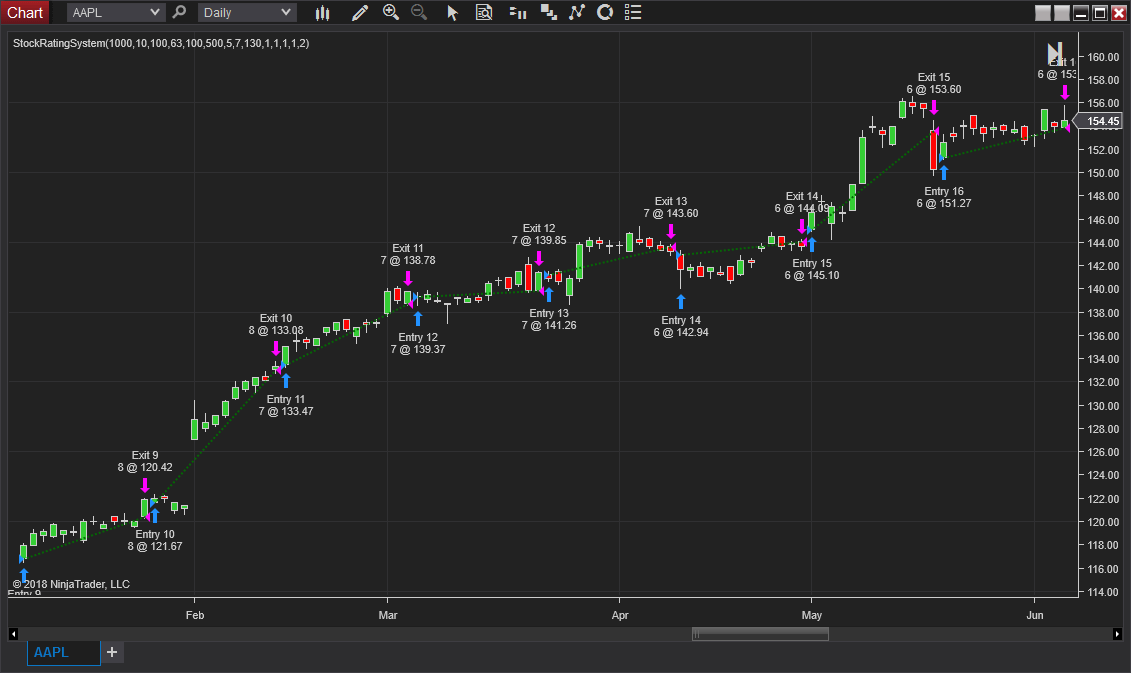
FIGURE 6: NINJATRADER. Here, the
StockRatingSystem strategy displays several profitable trades on AAPL from
January 2017 to June 2017.
—Raymond Deux & Jim Dooms
NinjaTrader, LLC
www.ninjatrader.com
BACK TO LIST

QUANTACULA STUDIO: JUNE 2018
In his article in this issue, Markos Katsanos describes a method of ranking
stocks based on a score computed from a number of technical indicators. The
process of adding up indicator values to obtain a score should be fairly simple
to implement in a technical analysis software package. Here, we instead focus
on one of the custom indicators that he introduces, the stiffness indicator.
“Stiffness” is calculated by counting the number of times the source data is
below a moving average within a certain range. We used the indicator builder tool
in Quantacula Studio to get a head start creating the indicator. Figure 7 shows
the layout of the indicator builder after entering the relevant data.
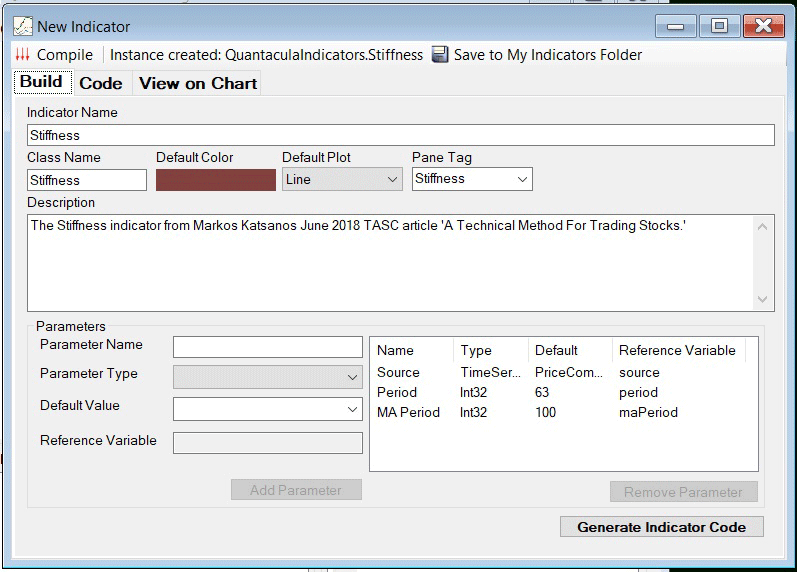
FIGURE 7: QUANTACULA STUDIO, INDICATOR
BUILDER. This shows the layout of the indicator builder after inputting the
relevant information for the stiffness indicator.
After we click the generate code button, the indicator builder provides
the boilerplate code to get the indicator up and running. We just need to code
the populate method, which populates the indicator data series with
values. Here’s the code for the stiffness indicator’s populate method.
public override void Populate()
{
   TimeSeries source = Parameters[0].AsTimeSeries;
   int period = Parameters[1].AsInt;
   int maPeriod = Parameters[2].AsInt;
   DateTimes = source.DateTimes;
   SMA sma = new SMA(source, maPeriod);
   for (int bar = period; bar < source.Count; bar++)
   {
      int sum = 0;
      for (int i = 0; i < period; i++)
      {
         int idx = bar - i;
         if (source[idx] < sma[idx])
            sum++;
      }
      Values[bar] = sum;
   }
}
The indicator will now appear in the list and we can use it in Quantacula
Studio just as we would any other indicator, in trading model building blocks,
or on a chart. Figure 8 shows a simple chart that colors the background when
the stiffness indicator is below 7, which is the threshold given in Katsanos’
article.
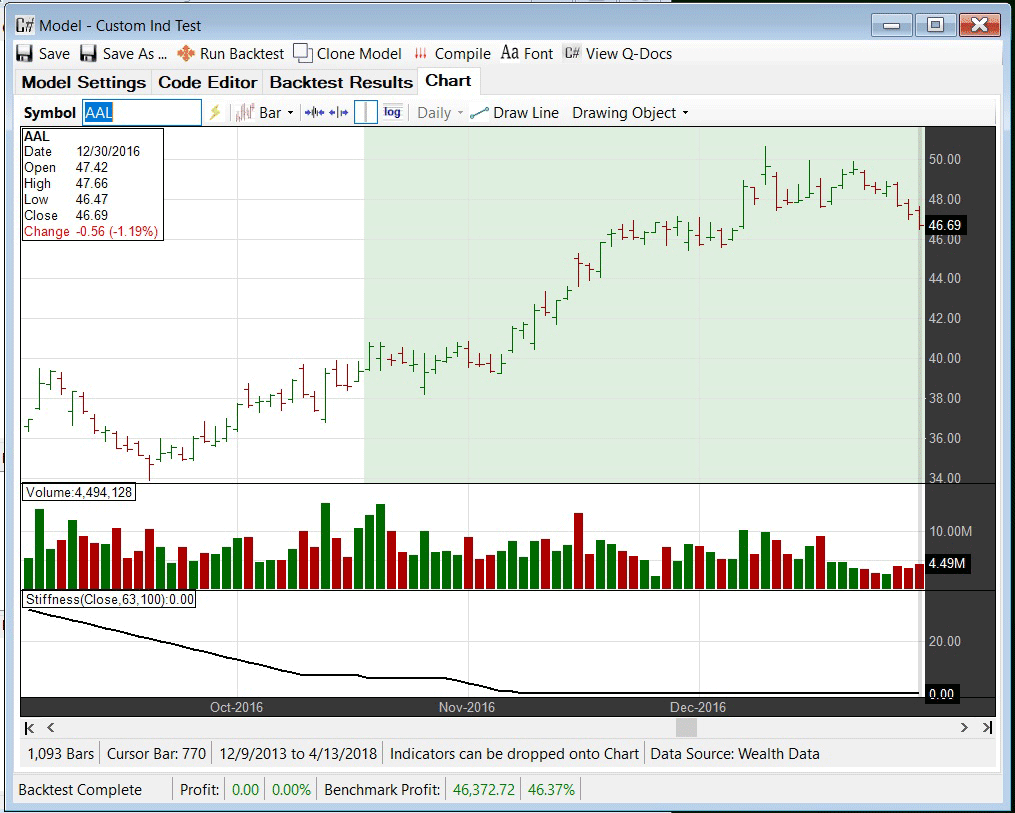
FIGURE 8: QUANTACULA STUDIO, CUSTOMIZED
CHART. The chart background is colored green whenever the stiffness indicator
is below 7.
—Dion Kurczek, Quantacula LLC
info@quantacula.com
www.quantacula.com
BACK TO LIST

UPDATA: JUNE 2018
This month’s Traders’ Tip is based on “A Technical Method For Rating Stocks”
in this issue by Markos Katsanos.
In it, Katsanos develops a five-component model to better filter stock picks.
The components essentially benchmark a stock’s volume and price action to historic
norms, as well as to an index average, and each is given a weighting that can
be optimized within the Updata optimizer. This aggregate score can be compared
to values supplied in the article to determine good buy and sell signals.
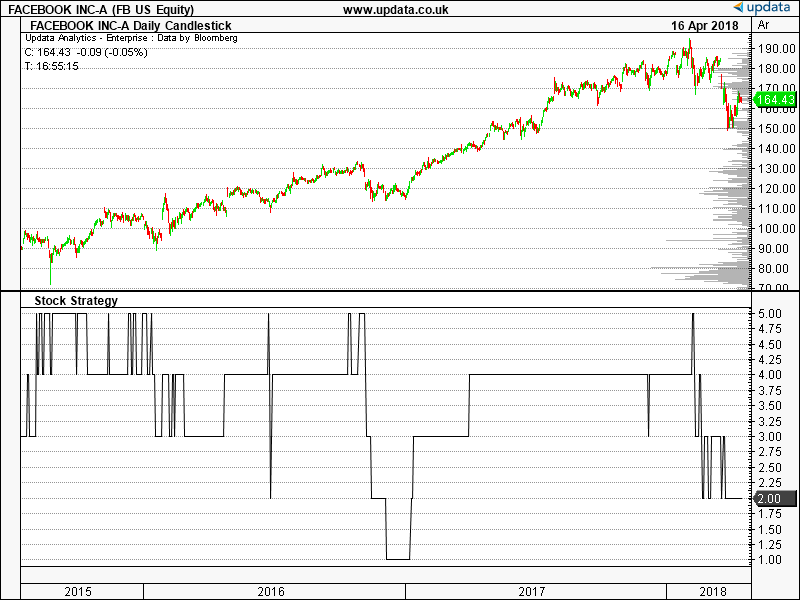
FIGURE 9: UPDATA. This chart shows
the stock-rating method as applied to Facebook stock and the SPY index benchmark.
The Updata code based on this article can be found in the Updata library and
may be downloaded by clicking the custom menu and indicator library.
Those who cannot access the library due to a firewall may paste the code shown
below into the Updata custom editor and save it.
PARAMETER "SPY" ~SPY=Select
PARAMETER "W1" @W1=1
PARAMETER "W2" @W2=1
PARAMETER "W3" @W3=1
PARAMETER "W4" @W4=1
PARAMETER "W5" @W5=1
@MAP =63
@STIFFMAX =7
@VFIPERIOD=130
@MASPY=100
@MADL=100
@MA100=0
@CLMA=0
@STIFFNESS=0
@Coef = 0
@Avg=0
@VCoef = 0
@inter = 0
@Vinter = 0
@Cutoff =0
@Vave = 0
@Vmax = 0
@Vc = 0
@MF = 0
@VCP = 0
@VFI = 0
@VFI = 0
@COND1=0
@COND2=0
@COND3=0
@COND4=0
@COND5=0
@SCORE=0

FOR #CURDATE=0 TO #LASTDATE
@Avg=MAVE(@MAP)
@Coef = 0.2
@VCoef = 2.5
@inter = LN( @Avg ) - LN( HIST( @Avg, 1 ) )
@Vinter = StDDev(@inter, 30 )
@Cutoff = @Coef * @Vinter * Close
@Vave = HIST( SGNL( VOL, @VFIPeriod,M ), -1 )
@Vmax = @Vave * @Vcoef
@Vc = Min( VOL, @VMax )
@MF = @Avg - HIST( @Avg, 1 )
IF @MF>@Cutoff
   @VCP=@VC
ELSEIF @MF<-1*@Cutoff
   @VCP=-1*@VC
ELSE
   @VCP=0
ENDIF
@VFI=SGNL(@VCP,@VFIPeriod,M)*@VFIPeriod/@Vave
'STIFFNESS
@MA100=SGNL(CLOSE,@MADL,M)
@CLMA=CLOSE<@MA100
@STIFFNESS=SGNL(@CLMA,@MAP,M)*@MAP
'CONDITIONS
@COND1= @VFI>0
@COND2=Close>SGNL(CLOSE,@MADL,M)
@COND3=SGNL(CLOSE,@MADL,M)>HIST(SGNL(CLOSE,@MADL,M),4)
@COND4=@STIFFNESS<=@STIFFMAX
@COND5=SGNL(~SPY,@MASPY,E)>=HIST(SGNL(~SPY,@MASPY,E),-2)
@SCORE=@W1*@COND1+@W2*@COND2+@W3*@COND3+@W4*@COND4+@W5*@COND5
NEXT
—Updata support team
support@updata.co.uk
www.updata.co.uk
BACK TO LIST

TRADE NAVIGATOR: JUNE 2018
We’re making available a file for download within the Trade Navigator library
to make it easy for users to implement the strategy discussed in “A Technical
Method For Rating Stocks” by Markos Katsanos in this issue.
The file name is “SC201806.” To download it, click on Trade Navigator’s blue
telephone button, select download special file, then erase the word
“upgrade” and type in “SC201806” (without the quotes). Then click the start button.
When prompted to upgrade, click the yes button. If prompted to close
all software, click on the continue button. Your library will now
download.
This library contains a strategy called “SC stock rating strategy.” It also
contains a highlight bar named “a scorecrit,” a criteria named “a score,” and
three indicators: “a score,” “SC stiffness,” and “SC VFI.”
The TradeSense code follows:
TradeSense language for VFI:
&coef := (.2)
&vcoef := (2.5)
&avg := (High + Low + Close) / 3
&inter := Log (&avg) - Log ((&avg).1)
&vinter := MovingStdDev (&inter , 30)
&cutoff := &coef * &vinter * Close
&vave := MovingAvg (Volume , 130).1
&vmax := &vave * &vcoef
&vc := Min (Volume , &vmax)
&mf := &avg - (&avg).1
&vcp := IFF (&mf > &cutoff , &vc , IFF (&mf < &cutoff * (-1) , &vc * (-1) , 0))
&vfi := MovingSum (&vcp , 130 , 0) / &vave
&vfi

TradeSense language for Stiffness
Stiffness
&ma100 := MovingAvg (Close , 100)
&clma := Close < &ma100
&stiff := MovingSum (&clma , 63 , 0)
&stiff
Manually creating indicators
If you would like to recreate these indicators manually, click on the edit dropdown
menu, open the trader’s toolbox (or use CTRL + T) and click on the functions tab.
Next, click on the new button, and a new function dialog
window will open. In its text box, input the code for the highlight bar. Ensure
that there are no extra spaces at the end of each line. When completed, click
on the verify button. You may be presented with an add inputs pop-up
message if there are variables in the code. If so, click the yes button,
then enter a value in the default value column. If all is well, when
you click on the function tab, the code you entered will convert to
italic font. Click on the save button and type in a name for the indicator.
Strategy
This library also contains a strategy called “SC stock rating strategy.” This
prebuilt strategy can be overlaid on a chart by opening the charting dropdown
menu, selecting the add to chart command, then selecting the strategies tab.
Running “a score” criteria scan (Figure 10)
Ensure that you have filters turned on (use the edit pulldown
menu → trader’s toolbox → filters tab → “enable filters” checkbox).
Also verify that the boxes are checked in the filters tab for the
filters that you would like to be active, as well as in the criteria tab.
Then click on the file menu and select “recalculate filter criteria.”
When prompted, select all. Open the symbol grid found under the view pulldown
menu. Near the top of the symbol grid, next to the settings button
there is a small down arrow button that will open a dropdown list of criteria.
Select “a score,” and its results will then be shown in the symbol grid.
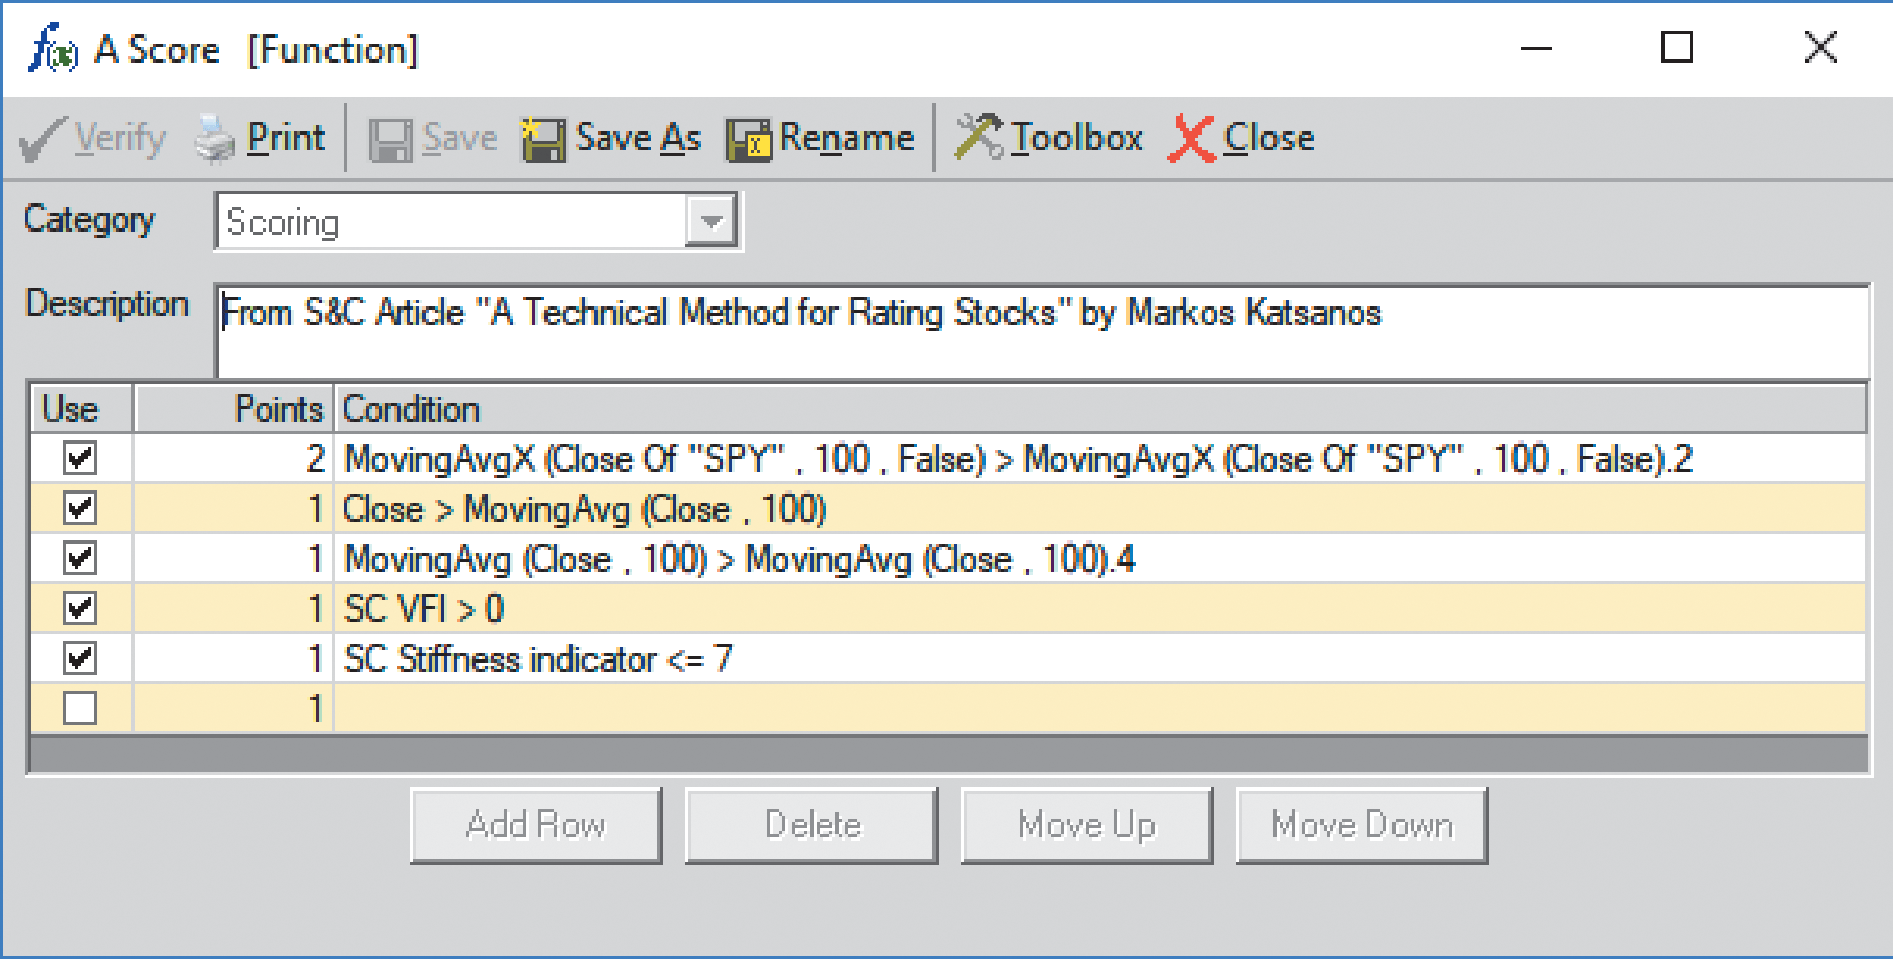
FIGURE 10: TRADE NAVIGATOR. This
shows the TradeSense code for creating a function to implement “a score”
criterion.
Adding “a scorecrit” to your chart
You can insert this highlight bar onto your chart by opening the charting dropdown
menu, selecting the add to chart command, then on the highlight
bars tab, find your named indicator, select it, then click on the add button.
Repeat this procedure for additional indicators as well if you wish.
For assistance with creating or using the indicator or strategy, Trade Navigator
users may contact our technical support by phone or by live chat.
—Genesis Financial Technologies
Tech support 719 884-0245
www.TradeNavigator.com
BACK TO LIST

AIQ: JUNE 2018
The AIQ code based on Markos Katsanos’ article in this issue, “A Technical
Method For Rating Stocks,” is provided at www.TradersEdgeSystems.com/traderstips.htm,
and is also shown below.
!A TECHNICAL METHOD FOR RATING STOCKS
!Author: Markos Katsanos, TASC June 2018
!Coded by: Richard Denning, 4/18/18
!www.TradersEdgeSystems.com

!INPUTS:
  MAP is 63.
  STIFFMAX is 7.
  VFIPeriod is 130.
  MASPY is 100.
  MADL is 100.
  SCORECRIT is 5.
  W1 is 1.
  W2 is 1.
  W3 is 1.
  W4 is 1.
  W5 is 2.

!VFI FORMULA:
  COEF is 0.2.
  VCOEF is 2.5.
  Avg is ([high]+[low]+[close])/3.
  inter is ln( Avg ) - ln( Valresult( Avg, 1 ) ).
  vinter is sqrt(variance(inter, 30 )).
  cutoff is Coef * Vinter * [Close].
  vave is Valresult(simpleavg([volume], VFIPeriod ), 1 ).
  vmax is Vave * Vcoef.
  vc is Min( [volume], VMax ).
  mf is Avg - Valresult( Avg, 1 ).
  vcp is iff(MF > Cutoff,VC,iff(MF < -Cutoff,-VC,0)).
  vfitemp is Sum(VCP , VFIPeriod ) / Vave.
  vfi is expavg(VFItemp, 3 ).

!STIFFNESS
  ma100 is Avg.
  CLMA if [close] < MA100.
  STIFFNESS is countof(CLMA,MAP).

!CONDITIONS:
 ! MONEY FLOW:
   COND1 is iff(VFI>0,1,0).
 !SIMPLEAVG:
    SMA is simpleavg([close],MADL).
    COND2 is iff([close]>SMA,1,0).
 !SIMPLEAVG DIRECTION:
    COND3 is iff(SMA>valresult(SMA,4),1,0).
!STIFFNESS:
    COND4 is iff(STIFFNESS<= STIFFMAX,1,0).
!MARKET DIRECTION:
    SPY is TickerUDF("SPY",[close]).
    COND5 is iff(EXPAVG(SPY,MASPY)>=
	valresult(EXPAVG(SPY,MASPY),2),1,0).

SCORE is  W1*COND1+W2*COND2+W3*COND3+
	  W4*COND4+W5*COND5.

 buy if Score>=SCORECRIT and hasdatafor(300)>=268.
Figure 11 shows the summary results of a backtest using NASDAQ 100 stocks
during a generally bullish period from April 2009 to April 2018. Figure 12
shows the backtest using the same list of NASDAQ 100 stocks during a period
that had two bear markets (April 1999 to April 2009). The average results are
similar except that there are fewer trades during the period that contained
the two bear markets. Both backtests use a fixed 21-bar exit.

FIGURE 11: AIQ, BULL MARKET. Here
are the summary results of a backtest using NASDAQ 100 stocks during a generally
bullish period from April 2009 to April 2018.

FIGURE 12: AIQ, BEAR MARKET. Here
are the summary results of a backtest using NASDAQ 100 stocks during a period
from April 1999 to April 2009 that contained two bear markets.
—Richard Denning
info@TradersEdgeSystems.com
for AIQ Systems
BACK TO LIST

TRADERSSTUDIO: JUNE 2018
The TradersStudio code based on Markos Katsanos’ article in this issue, “A
Technical Method For Rating Stocks,” is provided at www.TradersEdgeSystems.com/traderstips.htm
The following code files are provided in the download:
- Function: VFI2—Returns the author’s money flow indicator
values
- Function: CountOf—Returns the number of times a rule is
“true” in the lookback period
- System: TMRS2—A trading system as defined by the author.
The code is also shown here:
'Author: Markos Katsanos, TASC June 2018
'Coded by: Richard Denning, 4/20/18
'www.TradersEdgeSystems.com

Function VFI2(COEF,VCOEF,VFIlen)
  Dim typPrice As BarArray
  Dim logTypPrice As BarArray
  Dim logTypPrice1 As BarArray
  Dim inter As BarArray
  Dim vinter As BarArray
  Dim VFItemp As BarArray
  Dim vave As BarArray
  Dim vcp
  Dim vc
  Dim mf
  Dim cutoff
  Dim vmax

  typPrice = (H+L+C)/3
  logTypPrice = Log(typPrice)
  logTypPrice1 = Log(typPrice[1])
  inter = logTypPrice - logTypPrice1
  vinter = StdDev(inter, 30 )
  cutoff = COEF * vinter * C
  vave = Average(Vol, VFIlen )
  vmax = vave[1] * VCOEF
  vc = Min( Vol, vmax )
  mf = typPrice - typPrice[1]
  vcp = IIF(mf > cutoff,vc,IIF(mf < -cutoff,-vc,0))
  If vave[1] <> 0 Then
     VFItemp = Sum(vcp , VFIlen ) / vave[1]
  End If
  VFI2 = IIF(BarNumber>268,XAverage(VFItemp, 3 ),0)
End Function
'---------------------------------------------------
Function COUNTOF(rule As BarArray, countLen As Integer, offset As Integer)
Dim count As Integer
Dim counter As Integer
    For counter = 0 + offset To countLen + offset - 1
        If rule[counter] Then
            count = count + 1
        End If
    Next
COUNTOF = count
End Function
'---------------------------------------------------
Sub TMRS2(SCORECRIT,EXITBARS)
Dim MAP,STIFFMAX,VFIlen,MAlen,W1,W2,W3,W4,W5
'INPUTS:
  MAP = 63
  STIFFMAX = 7
  VFIlen = 130
  MAlen = 100
  'SCORECRIT = 5
  W1 = 1
  W2 = 1
  W3 = 1
  W4 = 1
  W5 = 2
  'EXITBARS = 21

'VFI (MONEYFLOW)
Dim theVFI As BarArray
theVFI = VFI2(0.2,2.5,VFIlen)

'STIFFNESS (DIPS BELOW MA)
Dim SMA As BarArray
Dim STIFFNESS As BarArray
Dim CLMA As BarArray
SMA = Average(C,MAlen)
CLMA = C<SMA
STIFFNESS=countof(CLMA,MAP,0)

'CONDITIONS:
Dim COND1,COND2,COND3,COND4,COND5
 ' MONEY FLOW:
    COND1 = IIF(theVFI>0,1,0)
 'SIMPLEAVG:
    COND2 = IIF(C>SMA,1,0)
 'SIMPLEAVG DIRECTION:
    COND3 = IIF(SMA>SMA[4],1,0)
'STIFFNESS:
    COND4 = IIF(STIFFNESS<=STIFFMAX,1,0)
'MARKET DIRECTION:
    Dim theMarket As BarArray
    Dim MKTxavg As BarArray
    theMarket = C Of Independent1
    MKTxavg = XAverage(theMarket,MAlen)
    COND5 = IIF(MKTxavg>=MKTxavg[2],1,0)
Dim SCORE As BarArray
SCORE=W1*COND1+W2*COND2+W3*COND3+W4*COND4+W5*COND5

If SCORE>=SCORECRIT Then Buy("LE",1,0,Market,Day)
If BarsSinceEntry>=EXITBARS Then ExitLong("LX","",1,0,Market,Day)

End Sub
—Richard Denning
info@TradersEdgeSystems.com
for TradersStudio
BACK TO LIST
MICROSOFT EXCEL: JUNE 2018
In his article in this issue, “A Technical Method For Rating Stocks,” Markos
Katsanos provides us with an interesting approach to rating stocks using a
weighted-voting combination of five technical indicators. He then applies a
threshold value to the voting summary value to determine possible entry points.
The relation of weighted indicator voting to the threshold value can be seen
in the subcharts labeled “Conditions scorecard” in Figures 13–18.
One of the technical indicators evaluates general market direction as determined
by a market index. Katsanos suggests three indexes: SPY, QQQ, and IWM. You
can certainly choose another index as you see fit.
Compare Figures 17 & 18 to see what simply changing the index may do to
the scorecard.
Note: The addition of an index to the computations means that two
separate data retrievals are necessary to keep the index values in sync with
the stock values. Behind the scenes, my VBA code will make sure these two data
retrievals happen automatically.
A visual review (or to use a popular phrase adopted from military parlance,
a “mark 1 eyeball”) of the charts in Figures 13–18 suggests that to bring this
concept into a viable trading system will require some additional entry criteria.
And while the article uses an exit strategy of holding for 30 days for backtesting,
a viable system built around this rating system will need an exit strategy
that is a bit more sophisticated.
In Figures 13–18, a buy flag is generated by the first bar of a set to have
a scorecard value to touch the ScoreCrit line. Logically, trade entry cannot
happen before the open of the next bar. And as we can see from the price action
following some of those touches, there is a fair chance of whipsaw situations.

FIGURE 13: EXCEL, HEARTLAND EXPRESS
INC. (HTLD). In this chart and in the following charts, a buy flag is generated
by the first bar of a set to have a scorecard value to touch the ScoreCrit
line.

FIGURE 14: EXCEL, McDonald’s Corp.
(MCD)

FIGURE 15: EXCEL, Caterpillar (CAT)
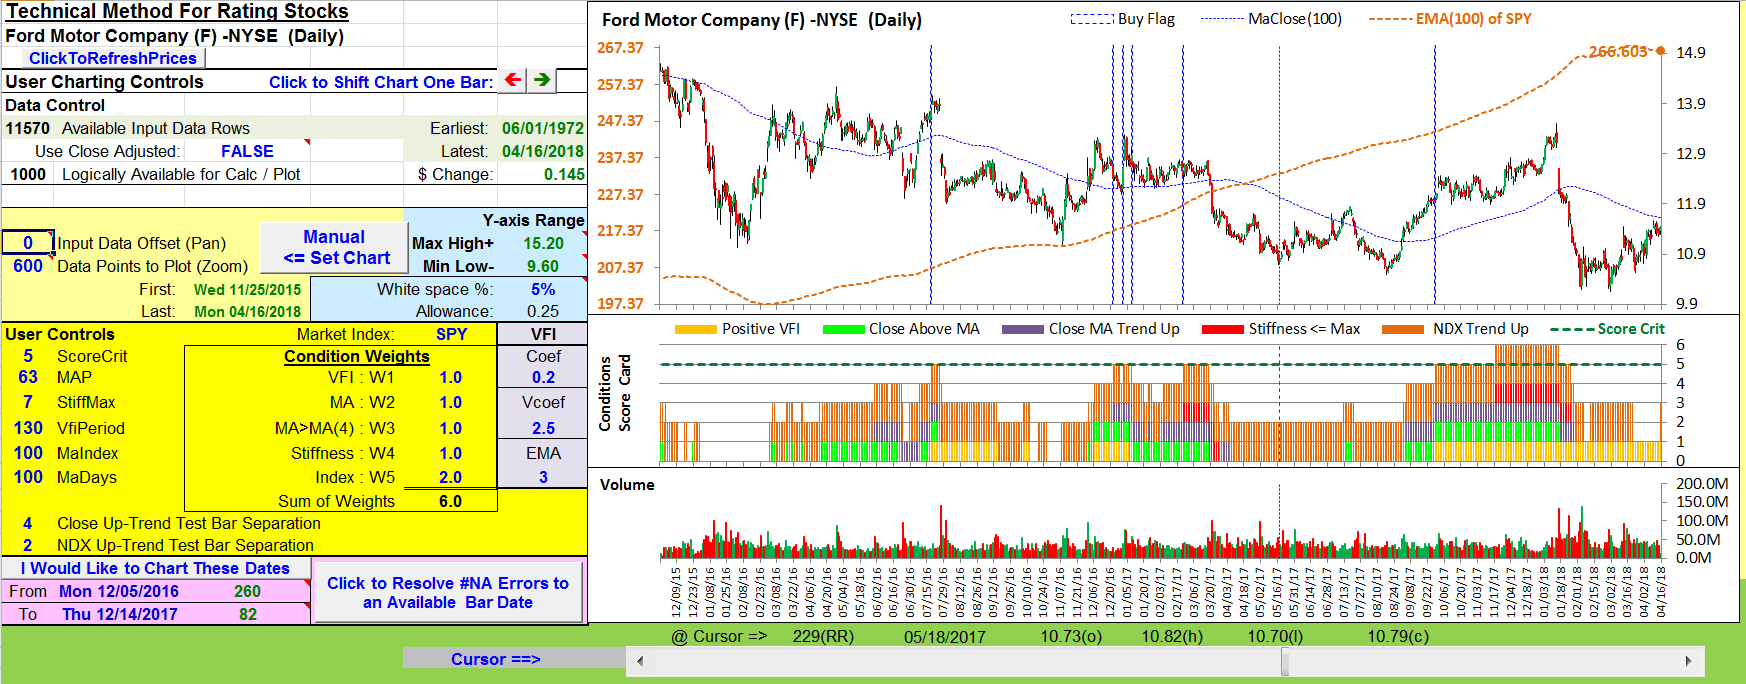
FIGURE 16: EXCEL, Ford Motor Company
(F)
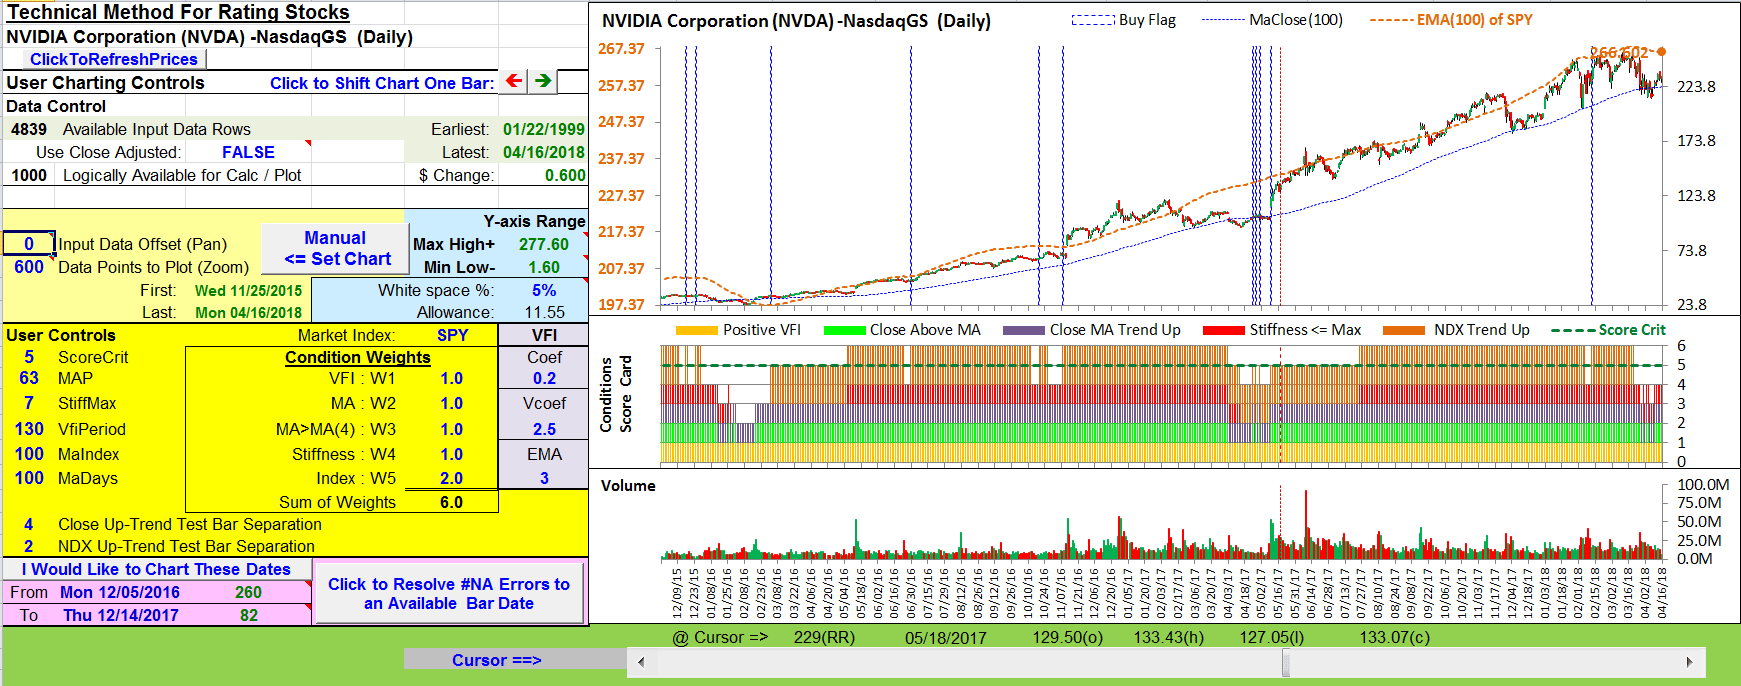
FIGURE 17: EXCEL, NVIDIA Corp.
(NVDA) using SPY as the index
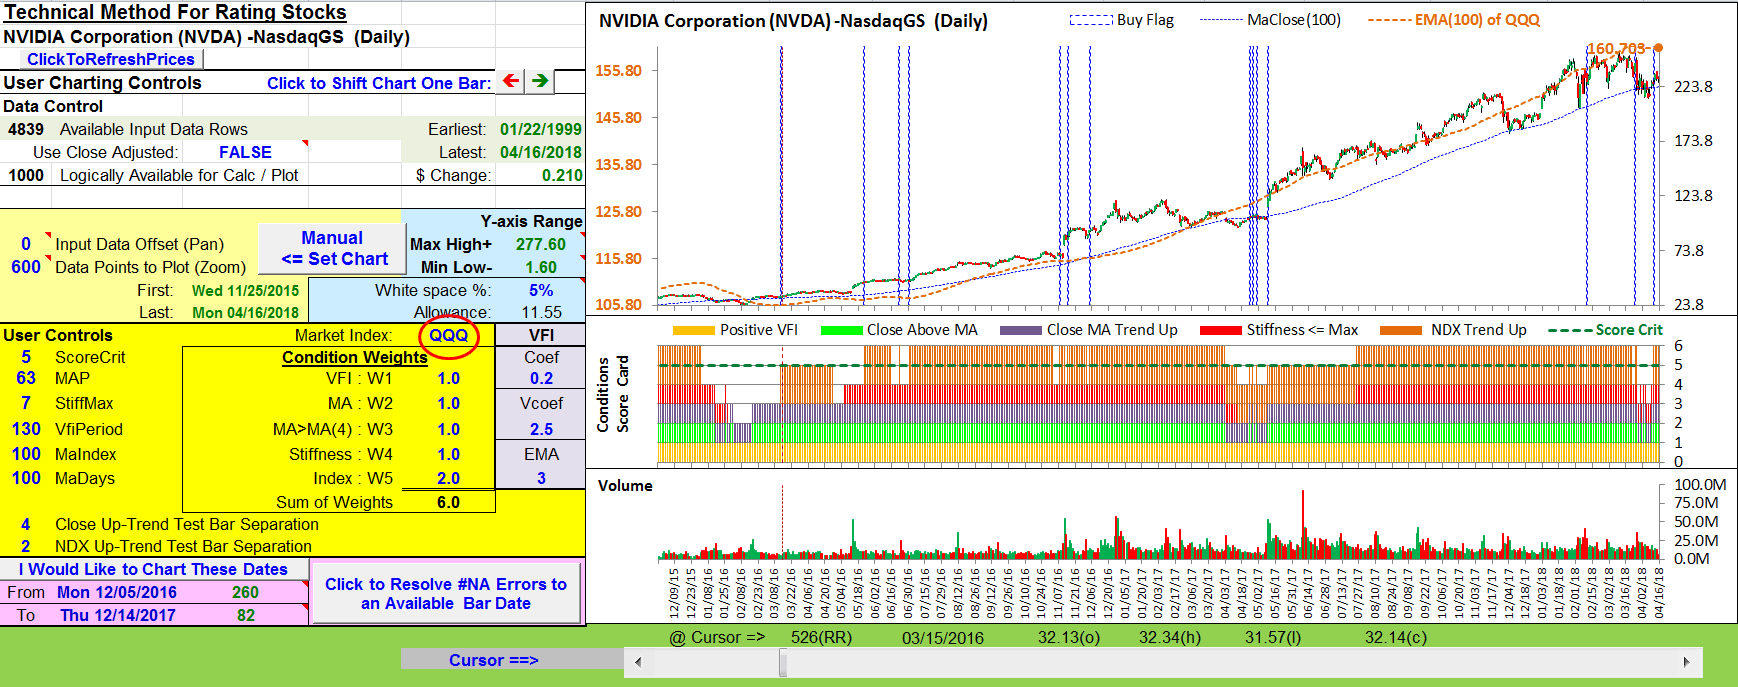
FIGURE 18: EXCEL, NVIDIA using
QQQ as the index
The spreadsheet file for this Traders’ Tip can be downloaded here.
To successfully download it, follow these steps:
- Right-click on the Excel
file link, then
- Select “save as” (or “save target as”) to place
a copy of the spreadsheet file on your hard drive.
A fix for previous Excel spreadsheets, required due to Yahoo modifications, can be found here: https://traders.com/files/Tips-ExcelFix.html
—Ron McAllister
Excel and VBA programmer
rpmac_xltt@sprynet.com
BACK TO LIST

THINKORSWIM: JUNE 2018
We have put together a study for thinkorswim based on the article “A Technical Method For Rating Stocks” by Markos Katsanos in this issue. We built the study and the strategy referenced using our proprietary scripting language, thinkscript. We have made the loading process extremely easy; simply click on https://tos.mx/LXnsvk then choose to view thinkScript study and name it “TechnicalStockRating”. You can also add the strategy by simply clicking on this https://tos.mx/CjiOli and then choose to view thinkScript strategy and name it “TechnicalStockRatingStrategy”.
Overlaid on the daily chart of symbol HP in Figure 19 is the TechnicalStockRating (Lower Study) and the TechnicalStockRatingStrategy (Strategy). See Katsanos’ article for more details on the interpretation of the two.

FIGURE 19: THINKORSWIM.
—thinkorswim
A division of TD Ameritrade, Inc.
www.thinkorswim.com
BACK TO LIST
Originally published in the June 2018 issue of
Technical Analysis of STOCKS & COMMODITIES magazine.
All rights reserved. © Copyright 2018, Technical Analysis, Inc.


