TRADERS’ TIPS
August 2018
For this month’s Traders’ Tips, the focus is Domenico D’Errico’s article in this issue, “Portfolio Strategy Based On Accumulation/Distribution.” Here, we present the August 2018 Traders’ Tips code with possible implementations in various software.
You can right-click on any chart to open it in a new tab or window and view it at it’s originally supplied size, often much larger than the version printed in the magazine.
EasyLanguage code is also provided by D’Errico in the article, which S&C subscribers will find in the Article Code section of our website here.
The Traders’ Tips section is provided to help the reader implement a selected technique from an article in this issue or another recent issue. The entries here are contributed by software developers or programmers for software that is capable of customization.

TRADESTATION: AUGUST 2018
In “Portfolio Strategy Based On Accumulation/Distribution” in this issue, author Domenico D’Errico presents a trading system based on the concepts known as Dow theory. He provides several indicators to help identify the various phases of the Dow theory cycle as well as a demonstration strategy. Here, we are providing the TradeStation EasyLanguage code based on the author’s work. The strategy can easily be tested on a portfolio of favorite symbols using TradeStation’s Portfolio Maestro application.
Indicator: AccumDistRange
// TASC Aug 2018
// Domenic D’Errico
inputs:
	Length( 4 ),
	ConsolidationFactor( 0.75 ),
	TrendLineColor( Yellow ) ;

variables:
	Consolidation( false ),
	Range_( 0 ),
	Top( 0 ),
	Bot( 0 ) ;

Consolidation = false ;

Range_ = Highest( High, Length )
	- Lowest( Low, Length ) ;

if Range_ < ConsolidationFactor
	* Range_[Length] then
begin
	Consolidation = true ;
	Top = Highest( High, Length ) ;
	Bot = Lowest( Low, Length ) ;
end ;

if Consolidation then
begin
	value1 = TL_New( Date, Time, Top, Date[Length],
		Time[Length], Top ) ;
	TL_SetColor( value1, TrendLineColor);

	value1 = TL_New( Date, Time, Bot, Date[Length],
		Time[Length], Bot ) ;
	TL_SetColor( value1, TrendLineColor ) ;

	value1 = TL_New( Date, Time, Bot, Date, Time, Top ) ;
	TL_SetColor( value1, TrendLineColor ) ;

	value1 = TL_New( Date[Length], Time[Length],
		Bot, Date[Length], Time[Length], Top ) ;
	tl_setcolor(value1,TrendLineColor);
end ;

if Range_[Length] > 0 then
begin
	Plot1( Range_ /Range_[Length],
		"RangeRatio", lightgray ) ;
	Plot2( ConsolidationFactor,
		"ConsolidationFactor", darkgray ) ;
	if Range_ / Range_[Length] < ConsolidationFactor then
		SetPlotColor( 1, TrendLineColor) ;
end ;


Indicator: AccumDistATR
// TASC Aug 2018
// Domenic D’Errico
inputs:
	ATRLength( 4 ),
	ATRFactor( 0.75 ),
	TrendLineColor( Yellow ) ; ;

var:
	Consolidation( false ),
	Range_( 0 ),
	Top( 0 ),
	Bot( 0 ),
	ATR( 0 ) ;

Consolidation = false ;
ATR = AvgTrueRange( ATRLength ) ;

if ATR < ATR[ATRLength] * ATRFactor then
begin
	Consolidation = true ;
	Top = highest( High, ATRLength ) ;
	Bot = Lowest( Low, ATRLength ) ;
end ;

If Consolidation then
begin
	value1=TL_New( Date, Time, Top,
		Date[ATRLength], Time[ATRLength], Top ) ;
	TL_SetColor( value1, TrendLineColor ) ;

	value1=TL_New( Date, Time, Bot,
		Date[ATRLength], Time[ATRLength], Bot ) ;
	TL_SetColor( value1, TrendLineColor ) ;

	value1=TL_New( Date, Time, Bot, Date, Time, Top ) ;
	TL_SetColor( value1, TrendLineColor ) ;

	value1=TL_New( Date[ATRLength], Time[ATRLength],
		Bot, Date[ATRLength], Time[ATRLength], Top ) ;
	TL_SetColor( value1, TrendLineColor ) ;
End;

if ATR[ATRLength] > 0 then
begin
	Plot1( ATR / ATR[ATRLength],
		"ATRRatio", LightGray ) ;
	Plot2( ATRFactor,
		"ATRFactor", DarkGray ) ;
	if ATR / ATR[ATRLength] < ATRFactor then
		SetPlotColor( 1, TrendLineColor) ;
end ;


Indicator: AccumDistADX
// TASC Aug 2018
// Domenic D’Errico
inputs:
	ADXLength( 4 ),
	ADXTrigger( 30 ),
	TrendLineColor( Yellow ) ;

variables:
	Consolidation( false ),
	Range_( 0 ),
	Top( 0 ),
	Bot( 0 ),
	ADXValue( 0 ) ;

Consolidation=false;
ADXValue = ADX( ADXLength ) ;


If ADXValue < ADXTrigger then
begin
	Consolidation = true ;
	Top = Highest( High, ADXLength ) ;
	Bot = Lowest( Low, ADXLength ) ;
end ;

If Consolidation then
begin
	value1 = TL_New( Date, Time, Top,
		Date[ADXLength], Time[ADXLength], Top ) ;
	TL_SetColor( value1, TrendLineColor ) ;

	value1 = TL_New( Date, Time, Bot,
		Date[ADXLength], Time[ADXLength], Bot ) ;
	TL_SetColor( value1, TrendLineColor ) ;

	value1 = TL_New( Date, Time, Bot, Date, Time, Top ) ;
	TL_SetColor( value1, TrendLineColor ) ;

	value1 = TL_New( Date[ADXLength], Time[ADXLength],
		Bot, Date[ADXLength], Time[ADXLength], Top ) ;
	TL_SetColor( value1, TrendLineColor ) ;
end ;

Plot1( ADXValue,
	"ADX", lightgray ) ;
Plot2( ADXTrigger,
	"ADXTrigger", darkgray ) ;
if ADXValue < ADXTrigger then
	SetPlotColor( 1, TrendLineColor ) ;


Strategy: AccumDistRange
// TASC Aug 2018
// Domenic D’Errico
input:
	Length( 4 ),
	ConsolidationFactor( 0.75 ),
	VolRatio( 1 ),
	VolAvg( 4 ),
	VolDelay( 4 ),
	InitialCapital( 100000 ),
	TradeStartDate( 1030101 ) ;

var:
	Consolidation( false ),
	Range_( 0 ),
	Top( 0 ),
	Bot( 0 );

Consolidation = false ;
Range_ = Highest( High, Length )
	- Lowest( Low, Length ) ;

If Range_ < ConsolidationFactor
	* Range_[Length] then
begin
	Consolidation = true;
	Top = Highest( High, Length ) ;
	Bot = Lowest( Low, Length ) ;
end ;

//Signals
if Date >= TradeStartDate
and Close > Top
and Bot > Bot[12]
and Average( volume, VolAvg )[VolDelay] > VolRatio
	* Average( volume, VolAvg )[VolAvg+VolDelay] then
	Buy ( InitialCapital + NetProfit ) /
		Close Shares this bar Close ;

if Close < Bot then
	Sell this bar on Close ;
To download the EasyLanguage code for the indicator presented in this article, please visit our TradeStation and EasyLanguage support forum. The code from this article can be found here: https://community.tradestation.com/Discussions/Topic.aspx?Topic_ID=152631. The ELD filename is “TASC_AUG2018.ELD.”
For more information about EasyLanguage in general, please see https://www.tradestation.com/EL-FAQ.
A sample chart is shown in Figure 1.

FIGURE 1: TRADESTATION. The accumulation/distribution strategy and indicator are shown on a weekly TradeStation chart of NFLX as well as in TradeStation Portfolio Maestro applied to the S&P 100 index stocks.
This article is for informational purposes. No type of trading or investment recommendation, advice, or strategy is being made, given, or in any manner provided by TradeStation Securities or its affiliates.
—Doug McCrary
TradeStation Securities, Inc.
www.TradeStation.com
BACK TO LIST

eSIGNAL: AUGUST 2018
For this month’s Traders’ Tip, we’ve provided the studies AccDist ADX.efs, AccDist Atr.efs, and AccDist Atrstudy.efs based on the article in this issue by Domenico D’Errico, “Portfolio Strategy Based On Accumulation/Distribution.” These studies will assist in determining whether “informed investors” are accumulating or distributing positions.
The studies contain formula parameters that may be configured through the edit chart window (right-click on the chart and select “edit chart”). A sample chart implementing the studies is shown in Figure 2.

FIGURE 2: eSIGNAL. Here is an example of the studies plotted on a daily chart of NFLX.
To discuss this study or download a complete copy of the formula code, please visit the EFS library discussion board forum under the forums link from the support menu at www.esignal.com or visit our EFS KnowledgeBase at https://www.esignal.com/support/kb/efs/. The eSignal formula scripts (EFS) are also available for copying & pasting here:
AccDist ADX.efs
/*********************************
Provided By:
eSignal (Copyright c eSignal), a division of Interactive Data
Corporation. 2016. All rights reserved. This sample eSignal
Formula Script (EFS) is for educational purposes only and may be
modified and saved under a new file name.  eSignal is not responsible
for the functionality once modified.  eSignal reserves the right
to modify and overwrite this EFS file with each new release.

Description:
    Portfolio Strategy Based On Accumulation/Distribution
    by Domenic D’Errico Figure

Version:            1.00  06/13/2018

Formula Parameters:                     Default:
ADXLength                                 4
ADXTrigger                                30


Notes:
The related article is copyrighted material. If you are not a subscriber
of Stocks & Commodities, please visit www.traders.com.

**********************************/


var fpArray = new Array();

function preMain(){
    setPriceStudy(false);
    setDefaultBarFgColor(Color.lightgrey);
    setPlotType(PLOTTYPE_HISTOGRAM);
    setDefaultBarThickness(10);
    setStudyTitle("AccDist ADX");
    setCursorLabelName("ADX");


    var x = 0;
    fpArray[x] = new FunctionParameter("ADXLength", FunctionParameter.NUMBER);
	with(fpArray[x++]){
        setLowerLimit(1);
        setDefault(4);
        setName("ADXLength");
    }
    fpArray[x] = new FunctionParameter("ADXTrigger", FunctionParameter.NUMBER);
	with(fpArray[x++]){
        setLowerLimit(1);
        setDefault(30);
        setName("ADXTrigger");
    }
}

var bInit = false;
var bVersion = null;
var xADX = null;

function main(ADXLength, ADXTrigger){
    if (bVersion == null) bVersion = verify();
    if (bVersion == false) return;

    if (getBarState() == BARSTATE_ALLBARS){

        bInit = false;
    }

    if (!bInit){

        xADX = adx(ADXLength, ADXLength);
        addBand(ADXTrigger, PS_SOLID, 1, Color.darkgrey, 0);
        bInit = true;
    }

    if (xADX.getValue(-ADXLength) < ADXTrigger){

        setBarFgColor(Color.green);
    }


    if (xADX.getValue(-ADXLength) != null) return ( xADX.getValue(-ADXLength));

}

function verify(){
    var b = false;
    if (getBuildNumber() < 779){

        drawTextAbsolute(5, 35, "This study requires version 10.6 or later.",
            Color.white, Color.blue, Text.RELATIVETOBOTTOM|Text.RELATIVETOLEFT|Text.BOLD|Text.LEFT,
            null, 13, "error");
        drawTextAbsolute(5, 20, "Click HERE to upgrade.@URL=https://www.esignal.com/download/default.asp",
            Color.white, Color.blue, Text.RELATIVETOBOTTOM|Text.RELATIVETOLEFT|Text.BOLD|Text.LEFT,
            null, 13, "upgrade");
        return b;
    }
    else
        b = true;

    return b;
}
AccDist Atr.efs
/*********************************
Provided By:
eSignal (Copyright c eSignal), a division of Interactive Data
Corporation. 2016. All rights reserved. This sample eSignal
Formula Script (EFS) is for educational purposes only and may be
modified and saved under a new file name.  eSignal is not responsible
for the functionality once modified.  eSignal reserves the right
to modify and overwrite this EFS file with each new release.

Description:
    Portfolio Strategy Based On Accumulation/Distribution
    by Domenic D’Errico Figure

Version:            1.00  06/13/2018

Formula Parameters:                     Default:
ATRLength                                 4
ATRFactor                                 0.75


Notes:
The related article is copyrighted material. If you are not a subscriber
of Stocks & Commodities, please visit www.traders.com.

**********************************/

var fpArray = new Array();

function preMain(){
    setPriceStudy(false);
    setDefaultBarFgColor(Color.lightgrey);
    setPlotType(PLOTTYPE_HISTOGRAM);
    setDefaultBarThickness(10);
    setStudyTitle("AccDist ATR");
    setCursorLabelName("AccDist ATR", 0);


    var x = 0;
    fpArray[x] = new FunctionParameter("ATRLength", FunctionParameter.NUMBER);
	with(fpArray[x++]){
        setLowerLimit(1);
        setDefault(4);
        setName("ATRLength");
    }
    fpArray[x] = new FunctionParameter("ATRFactor", FunctionParameter.NUMBER);
	with(fpArray[x++]){
        setLowerLimit(0.000001);
        setUpperLimit(1);
        setDefault(0.75);
        setName("ATRFactor");
    }
}

var bInit = false;
var bVersion = null;
var xATR = null;

function main(ATRLength, ATRFactor){
    if (bVersion == null) bVersion = verify();
    if (bVersion == false) return;

    if (getBarState() == BARSTATE_ALLBARS){

        bInit = false;
    }

    if (!bInit){

        xATR = atr(ATRLength);
        addBand(ATRFactor, PS_SOLID, 1, Color.darkgrey, 0);
        bInit = true;
    }

    if (xATR.getValue(-ATRLength) > 0){
        if ((xATR.getValue(0)/ xATR.getValue(-ATRLength)) < ATRFactor){

            setBarFgColor(Color.blue);
        }

    return ( xATR.getValue(0)/ xATR.getValue(-ATRLength));
    }
}
function verify(){
    var b = false;
    if (getBuildNumber() < 779){

        drawTextAbsolute(5, 35, "This study requires version 10.6 or later.",
            Color.white, Color.blue, Text.RELATIVETOBOTTOM|Text.RELATIVETOLEFT|Text.BOLD|Text.LEFT,
            null, 13, "error");
        drawTextAbsolute(5, 20, "Click HERE to upgrade.@URL=https://www.esignal.com/download/default.asp",
            Color.white, Color.blue, Text.RELATIVETOBOTTOM|Text.RELATIVETOLEFT|Text.BOLD|Text.LEFT,
            null, 13, "upgrade");
        return b;
    }
    else
        b = true;

    return b;
}
AccDist Atrstudy.efs
/*********************************
Provided By:
eSignal (Copyright c eSignal), a division of Interactive Data
Corporation. 2016. All rights reserved. This sample eSignal
Formula Script (EFS) is for educational purposes only and may be
modified and saved under a new file name.  eSignal is not responsible
for the functionality once modified.  eSignal reserves the right
to modify and overwrite this EFS file with each new release.

Description:
    Portfolio Strategy Based On Accumulation/Distribution
    by Domenic D’Errico Figure


Version:            1.00  06/13/2018

Formula Parameters:                     Default:
Length                                    4
ConsolidationFactor                       0.75


Notes:
The related article is copyrighted material. If you are not a subscriber
of Stocks & Commodities, please visit www.traders.com.

**********************************/

var fpArray = new Array();

function preMain(){
    setPriceStudy(false);
    setDefaultBarFgColor(Color.lightgrey);
    setPlotType(PLOTTYPE_HISTOGRAM);
    setDefaultBarThickness(10);
    setStudyTitle("AccDist Range");
    setCursorLabelName("AccDist Range", 0);


    var x = 0;
    fpArray[x] = new FunctionParameter("Length", FunctionParameter.NUMBER);
	with(fpArray[x++]){
        setLowerLimit(1);
        setDefault(4);
        setName("Length");
    }
    fpArray[x] = new FunctionParameter("ConsolidationFactor", FunctionParameter.NUMBER);
	with(fpArray[x++]){
        setLowerLimit(0.000001);
        setUpperLimit(1);
        setDefault(0.75);
        setName("ConsolidationFactor");
    }
}

var bInit = false;
var bVersion = null;
var xRange_ = null;
var xTop = null;
var xBot = null;
var xHighestHigh = null;
var xLowestLow = null;


function main(Length, ConsolidationFactor){
    if (bVersion == null) bVersion = verify();
    if (bVersion == false) return;

    if (getBarState() == BARSTATE_ALLBARS){

        bInit = false;
    }

    if (!bInit){

        xTop = upperDonchian(Length);
        xBot = lowerDonchian(Length);

        xRange_ = efsInternal("calc_xRange_", xTop, xBot);
        addBand(ConsolidationFactor, PS_SOLID, 1, Color.darkgrey, 0);
        bInit = true;
    }

    if (xRange_.getValue(-Length) > 0){

        if ((xRange_.getValue(0)/ xRange_.getValue(-Length)) < ConsolidationFactor){
            setBarFgColor(Color.black);
        }

        return ( xRange_.getValue(0)/ xRange_.getValue(-Length));
    }

}


function calc_xRange_(xHighestHigh, xLowestLow)
{
    return (xHighestHigh.getValue(0) - xLowestLow.getValue(0));

}

function verify(){
    var b = false;
    if (getBuildNumber() < 779){

        drawTextAbsolute(5, 35, "This study requires version 10.6 or later.",
            Color.white, Color.blue, Text.RELATIVETOBOTTOM|Text.RELATIVETOLEFT|Text.BOLD|Text.LEFT,
            null, 13, "error");
        drawTextAbsolute(5, 20, "Click HERE to upgrade.@URL=https://www.esignal.com/download/default.asp",
            Color.white, Color.blue, Text.RELATIVETOBOTTOM|Text.RELATIVETOLEFT|Text.BOLD|Text.LEFT,
            null, 13, "upgrade");
        return b;
    }
    else
        b = true;

    return b;
}
—Eric Lippert
eSignal, an Interactive Data company
800 779-6555, www.eSignal.com
BACK TO LIST

THINKORSWIM: AUGUST 2018
We have put together a study for thinkorswim based on the article “Portfolio Strategy Based On Accumulation/Distribution” in this issue by Domenico D’Errico. We built the study and strategy referenced by using our proprietary scripting language, thinkScript. To ease the loading process, simply go to https://tos.mx/5K7xQT and then choose view thinkScript study. Name the study “AccumulationDistributionStudy.” You can also add the strategy by going to https://tos.mx/R30R8U, choose to view thinkScript strategy, and name it “AccumulationDistributionStrat.” This study and strategy can then be added to your chart from the edit study and strategies menu within thinkorswim.
Figure 3 shows a weekly chart of NFLX overlaid with the AccumulationDistributionStudy (the lower study below the volume) and the AccumulationDistributionStrat (upper pane). See D’Errico’s article in this issue for more details on interpretation of the method.

FIGURE 3: THINKORSWIM. The AccumulationDistributionStudy is displayed on a weekly chart of NFLX below the volume pane. The AccumulationDistributionStrat is shown in the upper pane.
—thinkorswim
A division of TD Ameritrade, Inc.
www.thinkorswim.com
BACK TO LIST

WEALTH-LAB: AUGUST 2018
Using WealthScript, we’ve coded the multifaceted strategy discussed by Domenico D’Errico in his article in this issue, “Portfolio Strategy Based On Accumulation/Distribution,” for use in Wealth-Lab. Our formula for this strategy contains quite a number of variables to adjust its behavior. For example, you can switch between the three modes of detection of price compression: range, ATR, and ADX; you can configure its RSI and ADX thresholds; you can adjust the consolidation factor; you can choose your preferred type of entry (breakout or pullback); and so forth. You’ll find them exposed for optimization as well as for manual fine-tuning at the bottom-left of the screen. These “parameter sliders” can be dragged interactively, making the chart redraw instantly with the updated trades and performance. A sample chart displaying the strategy is shown in Figure 4.

FIGURE 4: WEALTH-LAB. This shows some example trades on a weekly chart of AAPL (Apple Inc.).
As the accumulation phase often takes place at the end of a downtrend, we believe that motivated traders would want to throw in some logic to limit the system’s exposure to other market conditions. As discussed by the author, it takes many trades during the other phases and thus might benefit from filtering.
If you want more of the same kind of trading technique in Wealth-Lab, we’ve got you covered. Hit Ctrl-O, choose download, and you should have the downloadable strategy named “rectangle trading system (Acme R)” under the chart patterns folder. Like the accumulation/distribution system, its idea is in identifying tradable rectangle patterns by comparing the size of consolidation to the size of the preceding trending range. An entry is signaled after a breakout if the consolidation range (measured in ATR units) is tight rather than volatile. It is also flexible in configuring its various parameters interactively through “sliders.”
Wealth-Lab Code (C#):

using System;
using System.Collections.Generic;
using System.Text;
using System.Drawing;
using WealthLab;
using WealthLab.Indicators;

namespace WealthLab.Strategies
{
	public class TASC_2018_08 : WealthScript
	{
		private StrategyParameter paramMode;
		private StrategyParameter paramLength;
		private StrategyParameter paramADX;
		private StrategyParameter paramConsTimeout;
		private StrategyParameter paramConsFactor;
		private StrategyParameter paramEntryBreakout ;

		public TASC_2018_08()
		{
			paramMode = CreateParameter("A/D/ ATR/ ADX", 0, 0, 2, 1);
			paramLength = CreateParameter("Length", 4, 4, 10, 2);
			paramADX = CreateParameter("ADX Trigger", 30, 5, 40, 5);
			paramConsTimeout = CreateParameter("Cons. timeout", 4, 2, 20, 2);
			paramConsFactor = CreateParameter("Cons. factor", 0.75, 0.25, 0.75, 0.25);
			paramEntryBreakout = CreateParameter("Brkout/Pullback", 0, 0, 1, 1);
		}

		protected override void Execute()
		{
			int mode = paramMode.ValueInt;
			int Length = paramLength.ValueInt, ADXTrigger = paramADX.ValueInt,
				TopBar = -1, BottomBar = -1, ConsolidationBar = -1,
				ConsolidationTimeout = paramConsTimeout.ValueInt;
			double ConsolidationFactor = paramConsFactor.Value, ATRFactor = paramConsFactor.Value,
				Top = 0.0, Bottom = 0.0;
			var Range_	= Highest.Series(High, Length)-Lowest.Series(Low, Length);
			var ATR_ 	= ATR.Series(Bars,Length);
			var ADX_ 	= ADX.Series(Bars,Length);
			int minPeriod = Math.Max(Length * 3, 20);
			bool Consolidation = false, breakout = paramEntryBreakout.ValueInt == 0 ? true : false;

			for(int bar = GetTradingLoopStartBar( minPeriod ); bar < Bars.Count; bar++)
			{
				if( !Consolidation )
				{
					bool conditionRange = (Range_[bar] < ConsolidationFactor * Range_[bar - Length]) && paramMode.ValueInt == 0;
					bool conditionATR = (ATR_[bar] < ATRFactor * ATR_[Length]) && paramMode.ValueInt == 1;
					bool conditionADX = (ADX_[bar] < ADXTrigger) && paramMode.ValueInt == 2;

					if( conditionRange || conditionATR || conditionADX )
					{
						Consolidation = true;
						Top = Highest.Series(High, Length)[bar];
						Bottom = Lowest.Series(Low, Length)[bar];
						TopBar = bar;
						BottomBar = bar - Length;
						ConsolidationBar = bar;
					}
				}

				if( Consolidation )
				{
					double[] rectangle = { TopBar, Top, TopBar, Bottom, BottomBar, Bottom, BottomBar, Top };
					DrawPolygon( PricePane, Color.Blue, Color.FromArgb(30,Color.LightSteelBlue), LineStyle.Solid, 1, true, rectangle );

					if( Range_[bar] > ConsolidationFactor * Range_[bar - Length] )
						Consolidation = false;

					if( bar > ConsolidationBar + ConsolidationTimeout )
						Consolidation = false;
				}

				if (IsLastPositionActive)
				{
					SellAtTrailingStop( bar+1, LastPosition, Bottom );
				}
				else
				{
					if( Consolidation )
					{
						if( breakout ) // Breakout entry
						{
							if( Bottom > Lowest.Series(Low, Length)[bar - 12] )
								if( BuyAtStop( bar+1, Top, "Breakout") != null )
									Consolidation = false;
								else
									Consolidation = bar + 1 - ConsolidationBar < ConsolidationTimeout;
						}
						else // Pullback entry
						{
							if(( Close[bar] > Bottom ) && CrossOver( bar, RSI.Series(Close, Length), 30 )
								&& Bottom > Lowest.Series( Low, Length)[bar - 12])
								if( BuyAtMarket( bar+1, "Pullback") != null )
									Consolidation = false;
								else
									Consolidation = bar + 1 - ConsolidationBar < ConsolidationTimeout;
						}
					}
				}
			}
		}
	}
}
—Gene Geren (Eugene), Wealth-Lab team
MS123, LLC
www.wealth-lab.com
BACK TO LIST

NEUROSHELL TRADER: AUGUST 2018
The accumulation/distribution range, ATR, and ADX indicators discussed by Domenico D’Errico in his article in this issue, “Portfolio Strategy Based On Accumulation/Distribution,” can be easily implemented with a few of NeuroShell Trader’s 800+ indicators. Simply select new indicator from the insert menu and use the indicator wizard to set up the following indicator:
A<B(Divide(PriceRange(High,Low,4),Lag(PriceRange(High,Low,4),4)),0.75)
A<B(Divide(ATR(High,Low,Close,4),Lag(ATR(High,Low,Close,4),4)),0.75)
A<B(ADX(High,Low,Close,4,4),30)
To implement the portfolio rule-based trading system, create a chart containing the S&P 100 stock symbols as chart pages, select new trading strategy from the insert menu, and enter the following in the appropriate locations of the trading strategy wizard:
BUY LONG CONDITIONS: [All of which must be true]
A>B(Close, SelectiveAvg(PriceHigh(High, 4), A<B(Divide(PriceRange(High, Low, 4), Lag(PriceRange(High, Low, 4), 4)), 0.75), 1))
A>B(Momentum(SelectiveAvg(PriceLow(Low,4), A<B(Divide(PriceRange(High,Low,4), Lag(PriceRange(High,Low, 4), 4)), 0.75), 1), 12), 0)
A>B(Lag(Avg(Volume, 4), 4), Mul2(1, Lag(Avg(Volume, 4), 8)))

SELL LONG CONDITIONS: [All of which must be true]
A<B(Close,SelectiveAvg(PriceLow(Low,4),A<B(Divide(PriceRange(High,Low,4),Lag(PriceRange(High,Low,4),4)),0.75),1))
Users of NeuroShell Trader can go to the Stocks & Commodities section of the NeuroShell Trader free technical support website to download a copy of this or any previous Traders’ Tips.
A sample chart applying the strategy is shown in Figure 5. Sample results are shown in Figure 6.
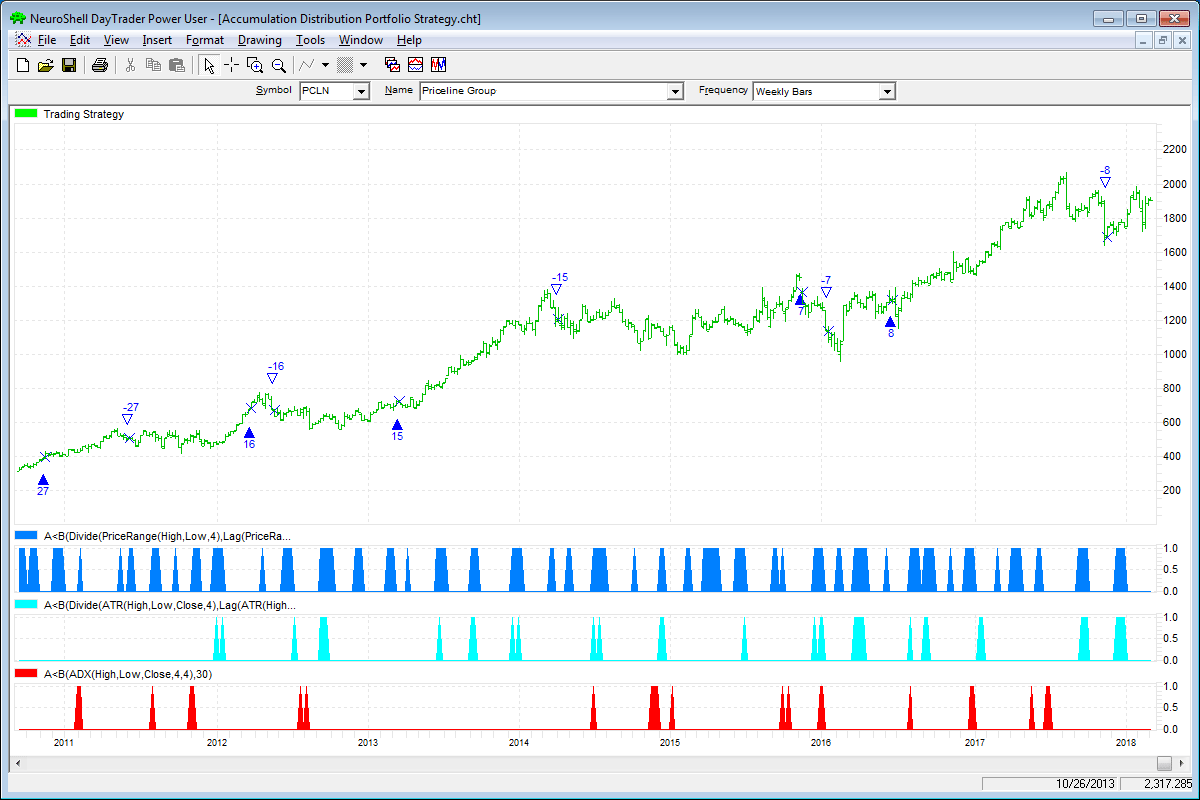
FIGURE 5: NEUROSHELL TRADER. This NeuroShell Trader chart displays the accumulation/distribution indicators and portfolio trading system.
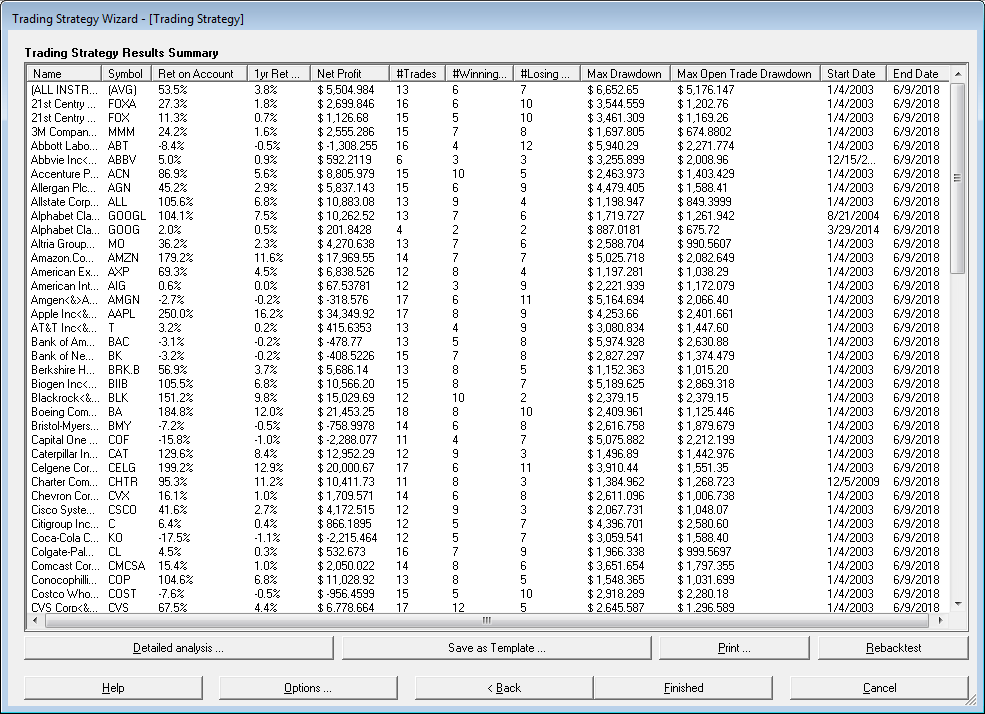
FIGURE 6: NEUROSHELL TRADER. Here are sample results from applying the accumulation/distribution portfolio trading strategy across the S&P 100 stocks.
—Marge Sherald, Ward Systems Group, Inc.
301 662-7950, sales@wardsystems.com
www.neuroshell.com
BACK TO LIST

NINJATRADER: AUGUST 2018
The accumulation/distribution range breakout strategy that is discussed in “Portfolio Strategy Based On Accumulation/Distribution” in this issue by Domenico D’Errico is available for download at the following links for NinjaTrader 8 and for NinjaTrader 7:
Once the file is downloaded, you can import the strategy into NinjaTrader 8 from within the control center by selecting Tools → Import → NinjaScript Add-On and then selecting the downloaded file for NinjaTrader 8. To import into NinjaTrader 7, from within the control center window, select the menu File → Utilities → Import NinjaScript and select the downloaded file.
You can review the strategy’s source code in NinjaTrader 8 by selecting the menu New → NinjaScript Editor → Strategies from within the control center window and selecting the AccDistRangeBreakout file. You can review the strategy’s source code in NinjaTrader 7 by selecting the menu Tools → Edit NinjaScript → Strategy from within the control center window and selecting the AccDistRangeBreakout file.
NinjaScript uses compiled DLLs that run native, not interpreted, which provides the highest performance possible.
A sample chart implementing the strategy is shown in Figure 7.
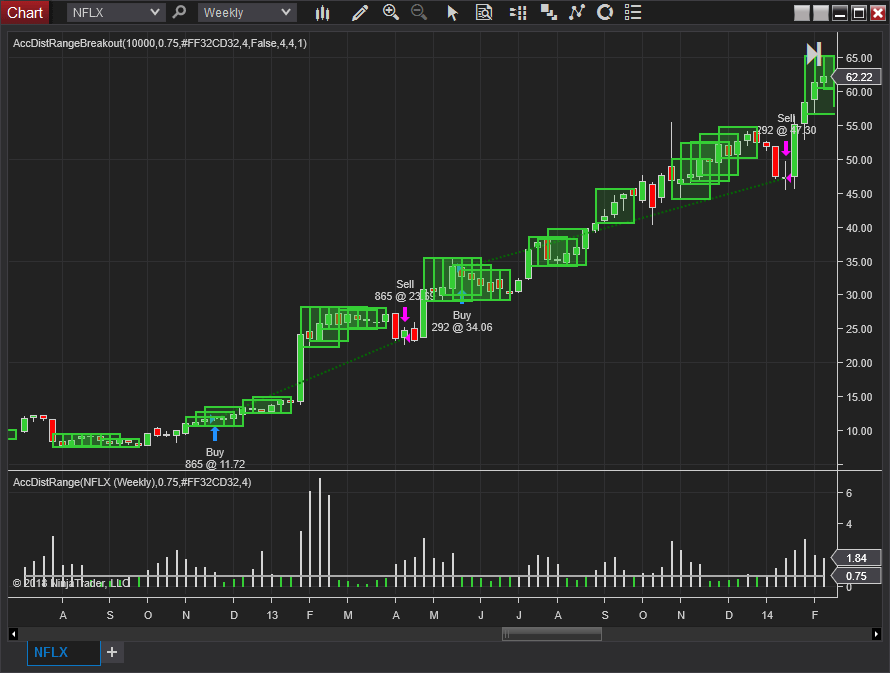
FIGURE 7: NINJATRADER. The AccDistRangeBreakout strategy on a NinjaTrader chart shows two profitable trades on NFLX from July 2012 to February 2014.
—Raymond Deux & Jim Dooms
NinjaTrader, LLC
www.ninjatrader.com
BACK TO LIST

QUANTACULA: AUGUST 2018
In “Portfolio Strategy Based On Accumulation/Distribution” in this issue, author Domenico D’Errico presents three methods of trading based on accumulation/distribution concepts. Quantacula Studio performs backtests at the dynamic portfolio level, rather than using the basket-backtesting method that D’Errico describes in the article. This allows you to interact with the portfolio backtest as it proceeds bar by bar against all of the symbols included in the test.
The Quantacula Studio C# code for the accumulation/distribution method based on range compression is shown here:
using QuantaculaBacktest;
using QuantaculaCore;
using QuantaculaIndicators;
using System.Drawing;

namespace Quantacula
{
    public class MyModel : UserModelBase
    {
        //create indicators and other objects here, this is executed prior to the main trading loop
        public override void Initialize(BarHistory bars)
        {
            top = new Highest(bars.High, length);
            bottom = new Lowest(bars.Low, length);
            range = top - bottom;
            TimeSeries rangeRatio = range / (range << length);
            Plot(rangeRatio, "RangeRatio", Color.Silver, PlotStyles.ThickHistogram, "RangeRatio");
            DrawHorzLine(consolidationFactor, Color.Gray, LineStyles.Solid, "RangeRatio");
        }

        //execute the strategy rules here, this is executed once for each bar in the backtest history
        public override void Execute(BarHistory bars, int idx)
        {
            if (idx < length)
                return;
            if (range[idx] < range[idx - length] * consolidationFactor)
                DrawRectangle(idx - length, top[idx], idx, bottom[idx], Color.Black, LineStyles.Solid);
        }

        //declare private variables below
        private int length = 4;
        private double consolidationFactor = 0.75;
        private TimeSeries top;
        private TimeSeries bottom;
        private TimeSeries range;
    }
}
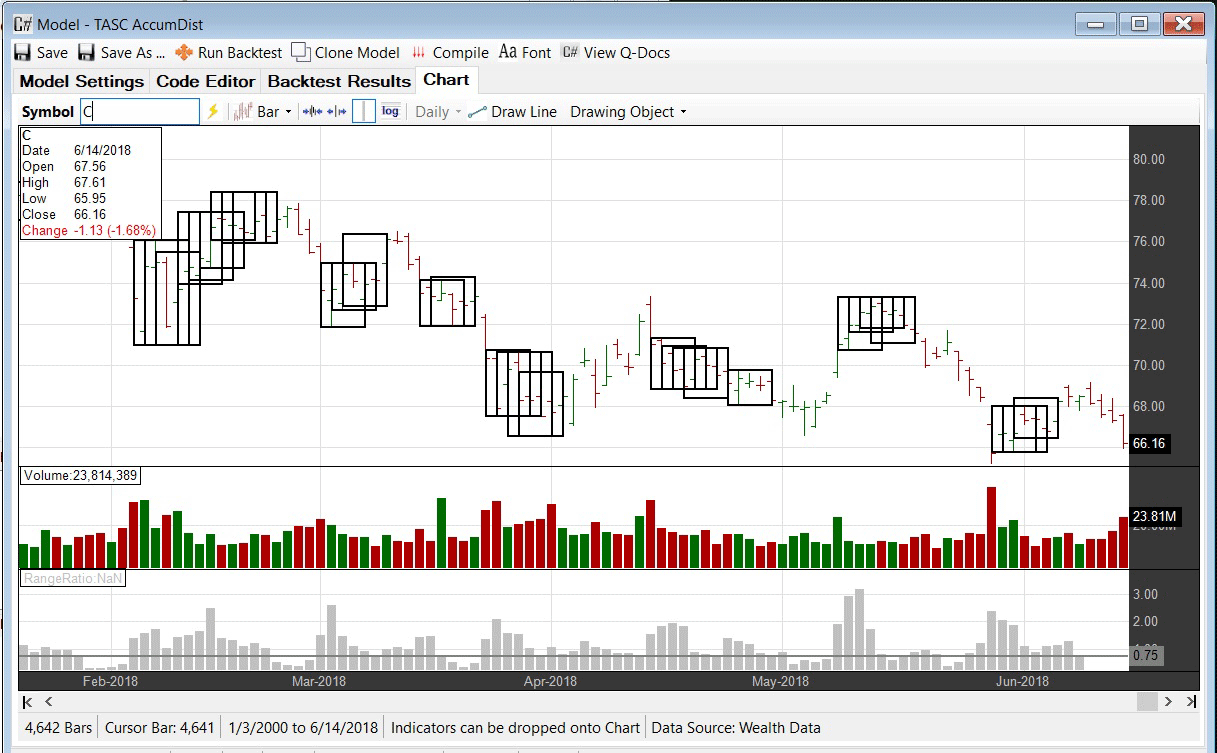
FIGURE 8: QUANTACULA. Here’s a sample chart in Quantacula Studio implementing the accumulation/distribution based on range compression.
—Dion Kurczek, Quantacula LLC
info@quantacula.com
www.quantacula.com
BACK TO LIST

AIQ: AUGUST 2018
The AIQ code based on Domenico D’Errico’s article in this issue, “Portfolio Strategy Based On Accumulation/Distribution,” is provided at my website, www.TradersEdgeSystems.com/traderstips.htm, and is also shown below.
!Portfolio Strategy Based on Accumulation/Distribution
!Author: Domenic D'Errico, TASC Aug 2018
!Coded by: Richard Denning 6/10/18
!www.TradersEdgeSystem.com

!SET TO WEEKLY MODE IN PROPERTIES
!ALSO VIEW CHARTS IN WEEKLY MODE

!INPUTS:
rLen is 4.
consolFac is 75. ! in percent
adxTrigger is 30.
volRatio is 1.
volAvgLen is 4.
volDelay is 4.

!CODING ABREVIATIONS:
H is [high].
L is [low].
C is [close].
C1 is valresult(C,1).
H1 is valresult(H,1).
L1 is valresult(L,1).

!RANGE ACCUMULATION/DISTRIBUTION:
theRange is hival([high],rLen) - loval([low],rLen).
Consol if theRange < consolFac/100 * valresult(theRange,rLen).
rRatio is theRange/valresult(theRange,4)*100.

!AVERAGE TRUE RANGE ACCUMULATION/DISTRIBUTION:
avgLen is rLen * 2 - 1.
TR  is Max(H-L,max(abs(C1-L),abs(C1-H))).
ATR  is expAvg(TR,avgLen).

ConsolATR if ATR < consolFac/100 * valresult(ATR,rLen).
atrRatio is ATR / valresult(ATR,4)*100.

!ADX ACCUMULATION/DISTRIBUTION:

!ADX INDICATOR as defined by Wells Wilder
rhigh is (H-H1).
rlow is (L1-L).
DMplus is iff(rhigh > 0 and rhigh > rlow, rhigh, 0).
DMminus is iff(rlow > 0 and rlow >= rhigh, rlow, 0).
AvgPlusDM is expAvg(DMplus,avgLen).
AvgMinusDM is expavg(DMminus,avgLen).
PlusDMI is (AvgPlusDM/ATR)*100.
MinusDMI is AvgMinusDM/ATR*100.
DIdiff is PlusDMI-MinusDMI.
Zero if PlusDMI = 0 and MinusDMI =0.
DIsum is PlusDMI+MinusDMI.
DX is iff(ZERO,100,abs(DIdiff)/DIsum*100).
ADX is ExpAvg(DX,avgLen).

ConsolADX if ADX < adxTrigger.

!CODE FOR ACCUMULATIOIN/DISTRIBUTION RANGE BREAKOUT:

consolOS is scanany(Consol,250) then offsettodate(month(),day(),year()).
Top is highresult([high],rLen,^consolOS).
Top0 is valresult(Top,^consolOS) then resetdate().
Bot is loval([low],rLen,^consolOS).
AvgVol is simpleavg([volume],volAvgLen).
Bot12 is valresult(Bot,12).

BuyRngBO if  [close] > Top
and ^consolOS <= 5 and ^consolOS >= 1
and Bot > Bot12
and valresult(AvgVol,volDelay)>volRatio*valresult(AvgVol,volAvgLen+volDelay).
EntryPrice is [close].

Sell if [close] < loval([low],rLen,1).
ExitPrice is [close].
Figure 9 shows the summary backtest results of the range accumulation breakout system using NASDAQ 100 stocks from December 2006 to June 2018. The exits differ from the author’s as follows: I used two of the built-in exits — a 20% stop-loss and a profit-protect of 40% of profits once profit reaches 10%.

FIGURE 9: AIQ. Here are the summary results of a backtest using NASDAQ 100 stocks.
Figure 10 shows a color study on REGN. The yellow bars show where the range accumulation/distribution shows a consolidation.

FIGURE 10: AIQ. This color study shows range consolidation (yellow bars).
—Richard Denning
info@TradersEdgeSystems.com
for AIQ Systems
BACK TO LIST

TRADERSSTUDIO: AUGUST 2018
The TradersStudio code based on “Portfolio Strategy Based On Accumulation/Distribution” by Domenico D’Errico in this issue is provided at my website, www.TradersEdgeSystems.com/traderstips.htm, and is also shown below.
Figure 11 shows the log equity curve trading the NASDAQ 100 using the author’s system given in the article. Figure 12 shows the underwater equity curve for the same system.
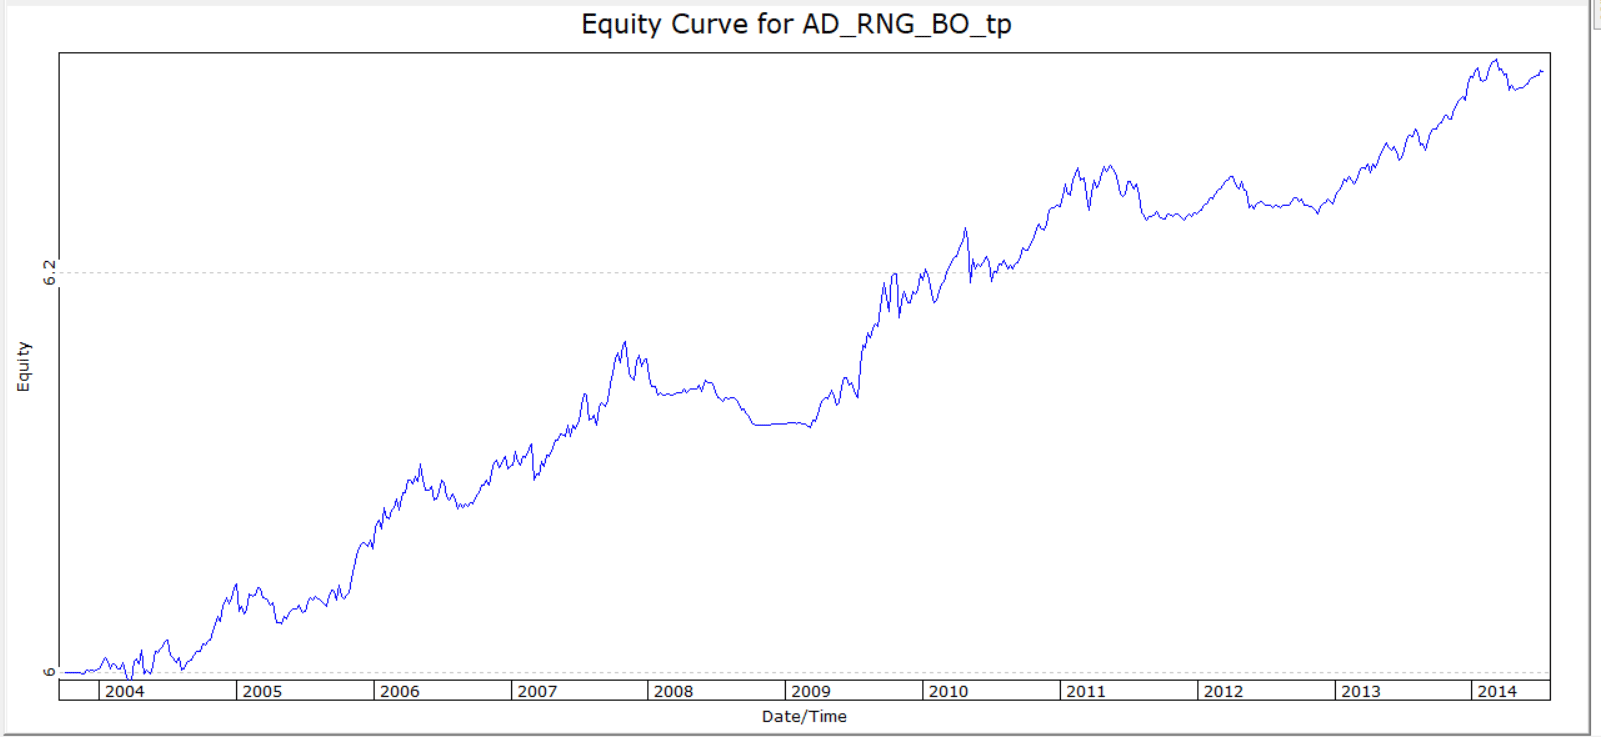
FIGURE 11: TRADERSSTUDIO. Here is a log equity curve trading the NASDAQ 100 using the system discussed in Domenico D’Errico’s article.
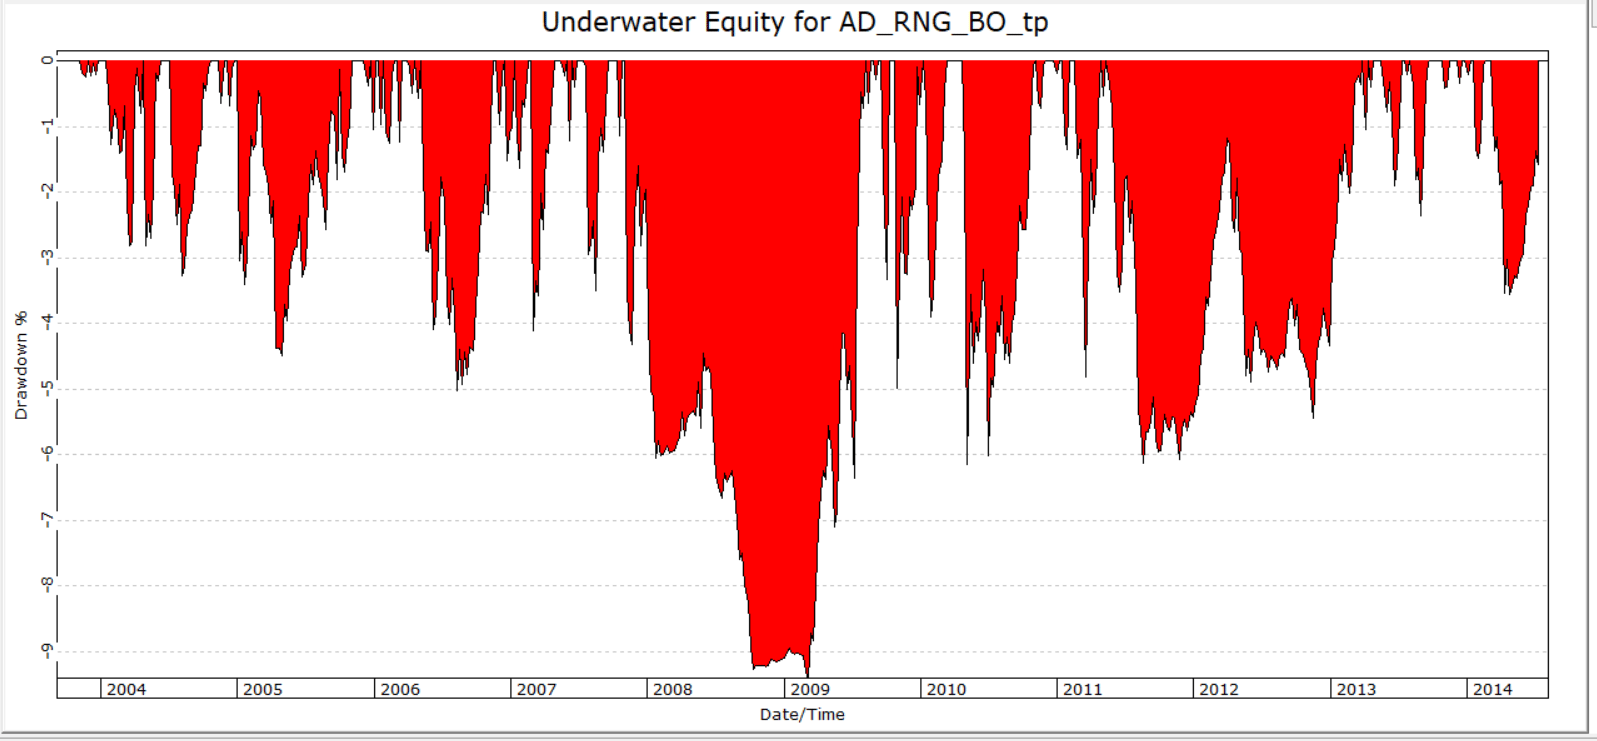
FIGURE 12: TRADERSSTUDIO. This shows the underwater equity curve based on my test of trading the NASDAQ 100 using the same system.
The TradersStudio code is shown here:
'Portfolio Strategy Based on Accumulation/Distribution
'Author: Domenic D'Errico, TASC Aug 2018
'Coded by: Richard Denning 6/10/18
'www.TradersEdgeSystem.com

Sub AD_RANGE_BO(Length, ConsolidationFactor, VolRatio, VolAvg, VolDelay)

    Dim Consolidation As BarArray
    Dim Range_ As BarArray
    Dim Top As BarArray
    Dim Bot As BarArray
    Dim avgVol As BarArray

    If BarNumber=FirstBar Then
        'Length = 4
        'ConsolidationFactor = 0.75
        'VolRatio = 1
        'VolAvg = 4
        'VolDelay = 4
        Consolidation = False
        Range_ = 0
        Top = 0
        Bot = 0
    End If

    Consolidation=False
    Range_=Highest(High,Length)-Lowest(Low,Length)
    avgVol = Average(V,VolAvg)
    If Range_<ConsolidationFactor*Range_[Length] Then
        Consolidation=True
        Top=Highest(High,Length)
        Bot=Lowest(Low,Length)
    End If
    If Close>Top And Bot>Bot[12] Then
        If avgVol[VolDelay]>VolRatio*avgVol[VolAvg+VolDelay] Then
            Buy("LE", 1, 0, Close, Day)
        End If
    End If
    If Close < Bot Then
        ExitLong("", "", 1, 0, Close, Day)
    End If
End Sub
—Richard Denning
info@TradersEdgeSystems.com
for TradersStudio
BACK TO LIST

AMIBROKER: AUGUST 2018
In “Portfolio Strategy Based On Accumulation/Distribution” in this issue, author Domenico D’Errico presents a number of techniques for detecting consolidation patterns. The AmiBroker code listing given here provides a ready-to-use formula for the accumulation/distribution range. Figure 13 shows a chart that was automatically generated by this formula. To adjust parameters, right-click on the chart and select parameters from the context menu.
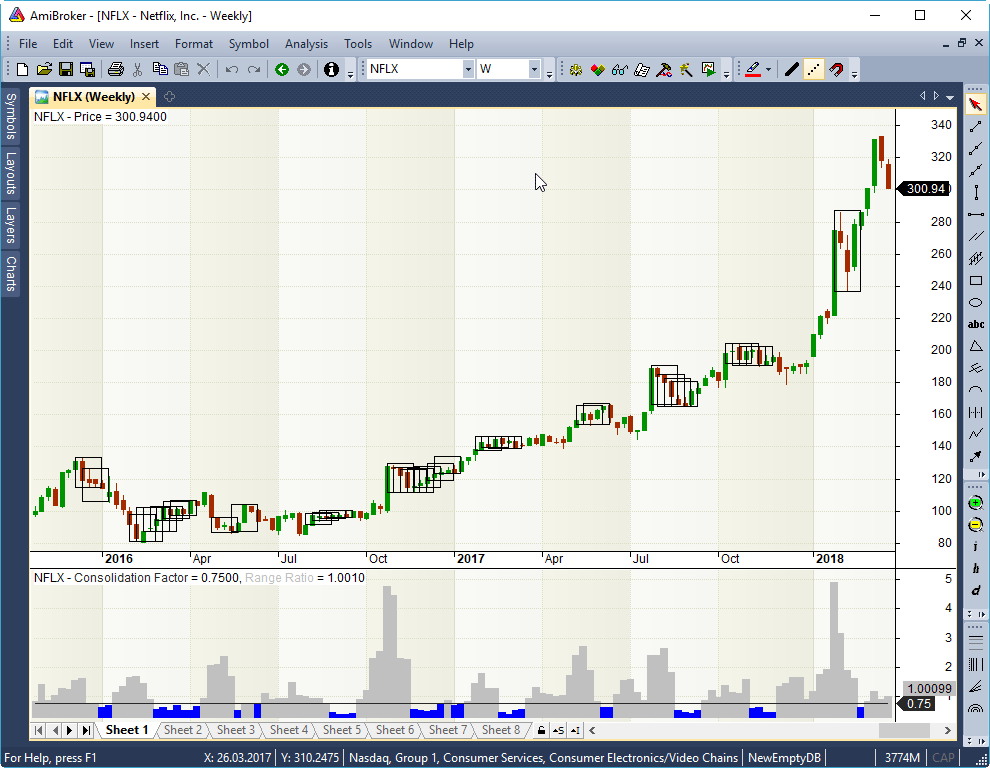
FIGURE 13: AMIBROKER. Here is a weekly chart of NFLX replicating a chart from Domenico D’Errico’s article in this issue. Price consolidations are highlighted with black rectangles when the range shows some compression.
LISTING 1.
cons_factor = Param( "ConsFactor", 0.75, 0.1, 1, 0.01 );
len = Param( "Length", 4, 1, 100 );

top = HHV( H, len );
bot = LLV( L, len );

range = top - bot;

consolidation = range < cons_factor * Ref( range, -len );

rr = range / Ref( range, -len );

rrcolor = IIf( rr < cons_factor, colorBlue, colorLightGrey );

mode = ParamToggle( "Mode", "Price|RangeRatio" );

if( mode )
{
   Plot( cons_factor, "Consolidation Factor", colorDarkGrey );
   Plot( rr, "Range Ratio", rrcolor, styleArea );
}
else
{
   Plot( C, "Price", colorDefault, styleCandle );

   GfxSetCoordsMode( 1 );
   GfxSelectStockObject( 5 ); // hollow brush

   bi = BarIndex();

   first = FirstVisibleValue( bi );
   last =  LastVisibleValue( bi );

   for( i = first; i <= last; i++ )
   {
     if( consolidation[ i ] )
         GfxRectangle( i - len, top[ i ], i, bot[ i ] );
   }
}
—Tomasz Janeczko, AmiBroker.com
www.amibroker.com
BACK TO LIST
MICROSOFT EXCEL: AUGUST 2018
Domenico D’Errico, in “Portfolio Strategy Based On Accumulation/Distribution” in this issue, has given us a lot to think about with this article. In it, he presents three strategies for detecting consolidations using three common and well-understood indicators. Each of the three strategies provides a slightly different view into the current phase of the market cycle for a given tradable.
Combining our view of the market trend to date with an identified consolidation area, we can make some educated guesses as to where the price action might proceed from there.
In his article, D’Errico provides an outline of the strategy he uses to automate backtesting for each of these consolidation detections.
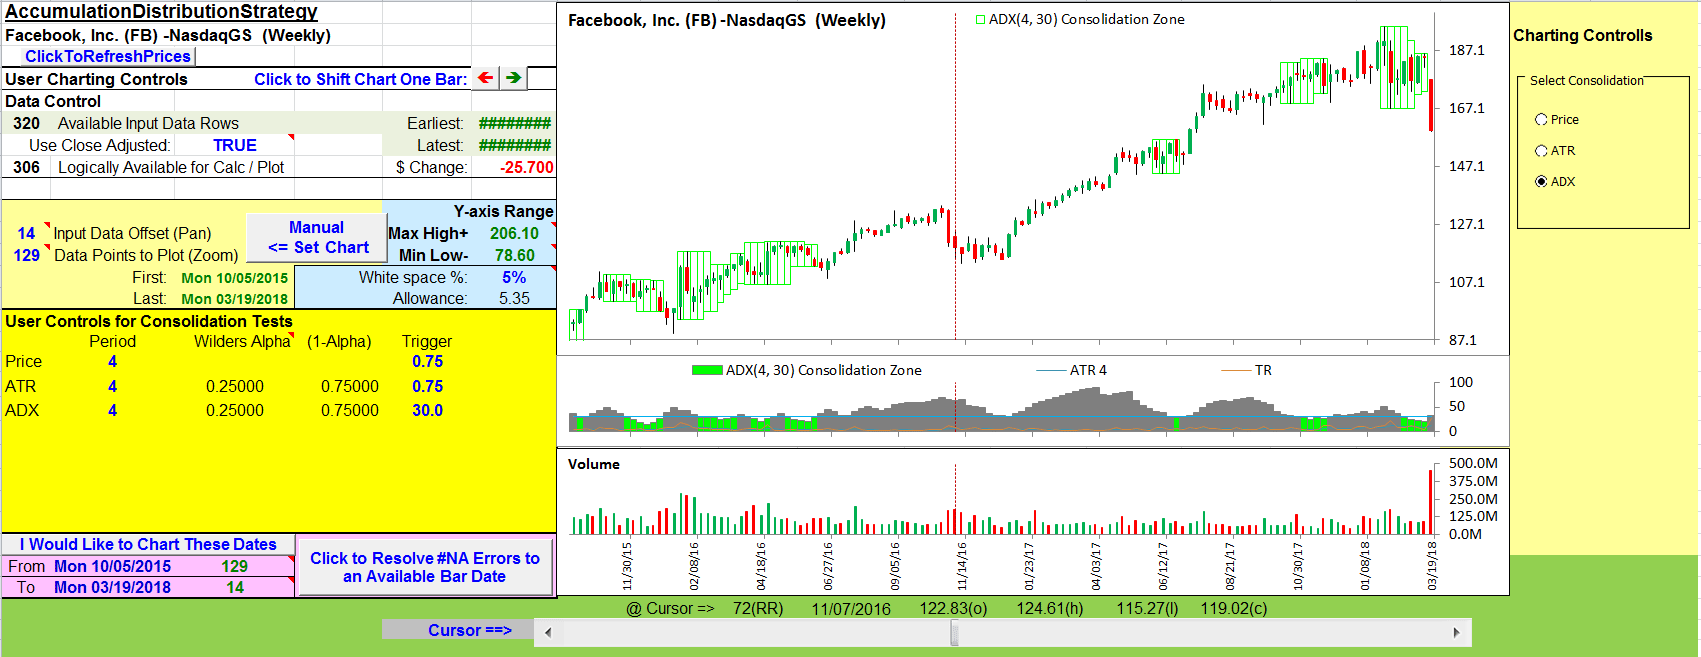
FIGURE 14: EXCEL. This sample chart of Facebook (FB) weekly bars demonstrates ADX consolidation zones.
The spreadsheet file for this Traders’ Tip can be downloaded here. To successfully download it, follow these steps:
- Right-click on the Excel file link, then
- Select “save as” (or “save target as”) to place a copy of the spreadsheet file on your hard drive.
—Ron McAllister
Excel and VBA programmer
rpmac_xltt@sprynet.com
BACK TO LIST
Originally published in the August 2018 issue of
Technical Analysis of STOCKS & COMMODITIES magazine.
All rights reserved. © Copyright 2018, Technical Analysis, Inc.


