TRADERS’ TIPS
September 2018
For this month’s Traders’ Tips, the focus is Vitali Apirine’s article in this issue, “Weekly & Daily Stochastics.” Here, we present the September 2018 Traders’ Tips code with possible implementations in various software.
You can right-click on any chart to open it in a new tab or window and view it at it’s originally supplied size, often much larger than the version printed in the magazine.
The Traders’ Tips section is provided to help the reader implement a selected technique from an article in this issue or another recent issue. The entries here are contributed by software developers or programmers for software that is capable of customization.

TRADESTATION: SEPTEMBER 2018
In “Weekly & Daily Stochastics” in this issue, author Vitali Apirine introduces a novel approach to using the classic stochastic indicator in a way that simulates calculations based on different timeframes while using just a daily interval chart. He describes a number of ways to use this new indicator that allows traders to detect the state of longer-term trends while looking for entry points and reversals. Here, we are providing the TradeStation EasyLanguage code for an indicator based on the author’s ideas.
Indicator: WeeklyAndDailyStochastic

// TASC Sep 2018
// Weekly And Daily Stochastics
// Vitali Apirine


inputs:
	DailyLength( 14 ),
	WeeklyLength( 70 ),
	DailySmoothingLength( 3 ),
	WeeklySmoothingLength( 3 ),
	OverBought( 80 ),
	OverSold( 20 ) ;

variables:
	StochD( 0 ),
	StochW( 0 ),
	SmoothD( 0 ),
	SmoothW( 0 ),
	MidLine( ( OverBought + OverSold ) * .5 ) ;

StochD = ( Close - Lowest( Low, DailyLength ) ) /
	( Highest( High, DailyLength )
	- Lowest( Low, DailyLength ) ) * 100 ;

StochW = ( Close - Lowest( Low, WeeklyLength ) ) /
	( Highest( High, WeeklyLength )
	- Lowest( Low, WeeklyLength ) ) * 100 ;

SmoothD = Average( StochD, DailySmoothingLength ) ;
SmoothW = Average( StochW, WeeklySmoothingLength ) ;

Plot1( SmoothD, "Daily" ) ;
Plot2( SmoothW, "Weekly" ) ;
Plot3( OverBought, "OverBought" ) ;
Plot4( OverSold, "OverSold" ) ;
Plot5( MidLine, "Mid" ) ;
To download the EasyLanguage code, please visit our TradeStation and EasyLanguage support forum. The files for this article can be found here: https://community.tradestation.com/Discussions/Topic.aspx?Topic_ID=152631. The filename is “TASC_SEP2018.ZIP.”
For more information about EasyLanguage in general, please see https://www.tradestation.com/EL-FAQ.
A sample chart is shown in Figure 1.

FIGURE 1: TRADESTATION. Here is a daily chart of Apple with the WeeklyAndDailyMACD indicator applied.
This article is for informational purposes. No type of trading or investment recommendation, advice, or strategy is being made, given, or in any manner provided by TradeStation Securities or its affiliates.
—Doug McCrary
TradeStation Securities, Inc.
www.TradeStation.com
BACK TO LIST

THINKORSWIM: SEPTEMBER 2018
We have put together a study for thinkorswim based on Vitali Apirine’s article in this issue, “Weekly & Daily Stochastics.” The study is built using our proprietary scripting language, thinkscript. To ease the loading process, simply click on https://tos.mx/I4qqIc or enter the address into an open shared item from within thinkorswim. Choose view thinkscript and name it “WeeklyAndDailyStochastics.” These can then be added to your chart from the edit study and strategies menu within thinkorswim.

FIGURE 2: THINKORSWIM. The WeeklyAndDailyStochastics study is added to the lower portion of a one-year daily chart of the Dow Jones Industrial Average.
The chart in Figure 2 shows the study added to the lower portion of a one-year daily chart of the Dow Jones Industrial Average. See Vitali Apirine’s article in this issue for more details on the interpretation of the study.
—thinkorswim
A division of TD Ameritrade, Inc.
www.thinkorswim.com
BACK TO LIST

eSIGNAL: SEPTEMBER 2018
For this month’s Traders’ Tip, we’ve provided the study W&D.efs based on the article by Vitali Apirine in this issue, “Weekly & Daily Stochastics.” This study combines two stochastic oscillators to determine corrections and trend reversals.
The study contains formula parameters that may be configured through the edit chart window (right-click on the chart and select “edit chart”). A sample chart is shown in Figure 3.

FIGURE 3: eSIGNAL. Here is an example of the study plotted on a daily chart of NFLX.
To discuss this study or download a complete copy of the formula code, please visit the EFS library discussion board forum under the forums link from the support menu at www.esignal.com or visit our EFS KnowledgeBase at https://www.esignal.com/support/kb/efs/. The eSignal formula script (EFS) is also available for copying & pasting here:
/*********************************
Provided By:
eSignal (Copyright c eSignal), a division of Interactive Data
Corporation. 2016. All rights reserved. This sample eSignal
Formula Script (EFS) is for educational purposes only and may be
modified and saved under a new file name.  eSignal is not responsible
for the functionality once modified.  eSignal reserves the right
to modify and overwrite this EFS file with each new release.

Description:
    Weekly & Daily Stochastics
    by Vitali Apirine

Version:            1.00  07/12/2018

Formula Parameters:                     Default:
Periods                                    14
Periods1                                    3
Pds                                        70
Pds1                                        3

Notes:
The related article is copyrighted material. If you are not a subscriber
of Stocks & Commodities, please visit www.traders.com.

**********************************/

var fpArray = new Array();

function preMain(){
    setPriceStudy(false);
    setStudyTitle("W&D stochastic");
    setCursorLabelName("Daily Stochastic", 0);
    setCursorLabelName("Weekly Stochastic", 1);
    setDefaultBarFgColor(Color.RGB(0x00,0x94,0xFF), 0);
    setDefaultBarFgColor(Color.RGB(0xFE,0x69,0x00), 1);

    var x = 0;
    fpArray[x] = new FunctionParameter("Periods", FunctionParameter.NUMBER);
	with(fpArray[x++]){
        setLowerLimit(1);
        setDefault(14);
    }
    fpArray[x] = new FunctionParameter("Periods1", FunctionParameter.NUMBER);
	with(fpArray[x++]){
        setLowerLimit(1);
        setDefault(3);
    }
    fpArray[x] = new FunctionParameter("Pds", FunctionParameter.NUMBER);
	with(fpArray[x++]){
        setLowerLimit(1);
        setDefault(70);
    }
    fpArray[x] = new FunctionParameter("Pds1", FunctionParameter.NUMBER);
	with(fpArray[x++]){
        setLowerLimit(1);
        setDefault(3);
    }
}

var bInit = false;
var bVersion = null;
var xSTOCD = null;
var xSTOCW = null;

function main(Periods, Periods1, Pds, Pds1){
    if (bVersion == null) bVersion = verify();
    if (bVersion == false) return;

    if (getBarState() == BARSTATE_ALLBARS){

        bInit = false;
    }

    if (!bInit){

        xSTOCD = stochK(Periods, Periods1, 1)
        xSTOCW = stochK(Pds, Pds1, 1)

        addBand(20, PS_SOLID, 1, Color.darkgrey, 0);
        addBand(50, PS_DASHDOT, 1, Color.darkgrey, 1);
        addBand(80, PS_SOLID, 1, Color.darkgrey, 2);

        bInit = true;
    }


    return new Array(xSTOCD.getValue(0), xSTOCW.getValue(0));
}

function verify(){
    var b = false;
    if (getBuildNumber() < 779){

        drawTextAbsolute(5, 35, "This study requires version 10.6 or later.",
            Color.white, Color.blue, Text.RELATIVETOBOTTOM|Text.RELATIVETOLEFT|Text.BOLD|Text.LEFT,
            null, 13, "error");
        drawTextAbsolute(5, 20, "Click HERE to upgrade.@URL=https://www.esignal.com/download/default.asp",
            Color.white, Color.blue, Text.RELATIVETOBOTTOM|Text.RELATIVETOLEFT|Text.BOLD|Text.LEFT,
            null, 13, "upgrade");
        return b;
    }
    else
        b = true;

    return b;
}
—Eric Lippert
eSignal, an Interactive Data company
800 779-6555, www.eSignal.com
BACK TO LIST

WEALTH-LAB: SEPTEMBER 2018
No coding is required to implement the weekly & daily stochastics described by Vitali Apirine in his article in this issue, as this indicator is built in. To match the author’s settings you should use the stochD indicator with the following parameters: period = 70, smooth = 3. It’s a pleasure to show our users how to make an idea like this work with very little learning curve.
Despite the fact that trading rules haven’t been provided in the article, it’s not really necessary since all best practices for the slow stochastic (stochK and stochD) apply here. Wealth-Lab’s “strategy from rules” feature allows you to create a trading strategy from flexible building blocks known as rules in a few easy steps:
- Step 1: To start, choose “new strategy from rules” or strike ctrl-shift-R.
- Step 2: Drag and drop an entry condition such as “buy at market.”
- Step 3: Then switch to the conditions tab, expand the “stochastics” group, and pick a condition. In the parameters box, set “stochD period” to 70 and “stochD smoothing” to 3.
By simply combining and reordering them, you can come up with fairly elaborate strategies.
A sample chart is shown in Figure 4.

FIGURE 4: WEALTH-LAB. This chart illustrates the ease of implementing the W&D stochastics indicator. The process can take less than a minute and frees you up from writing code.
—Gene Geren (Eugene), Wealth-Lab team
MS123, LLC
www.wealth-lab.com
BACK TO LIST

NEUROSHELL TRADER: SEPTEMBER 2018
The weekly & daily stochastic indicators described by Vitali Apirine in his article in this issue can be easily implemented with a few of NeuroShell Trader’s 800+ indicators. Simply select new indicator from the insert menu and use the indicator wizard to set up the following indicators:
- Stoch%D(High,Low,Close,70,3)
- Stoch%D(High,Low,Close,14,3)
Users of NeuroShell Trader can go to the Stocks & Commodities section of the NeuroShell Trader free technical support website to download a copy of this or any previous Traders’ Tips.
A sample chart is shown in Figure 5.

FIGURE 5: NEUROSHELL TRADER. This sample NeuroShell Trader chart shows the weekly & daily stochastics.
—Marge Sherald, Ward Systems Group, Inc.
301 662-7950, sales@wardsystems.com
www.neuroshell.com
BACK TO LIST

TRADERSSTUDIO: SEPTEMBER 2018
The TradersStudio code based on Vitali Apirine’s article in this issue, “Weekly & Daily Stochastics,” is provided at www.TradersEdgeSystems.com/traderstips.htm.
Using the author’s weekly & daily stochastic indicators and a moving average to determine trend direction, I created an example system (long only) with the following rules:
Enter long next bar at open when all of the following are true:
- The 200-day simple average of the NDX is greater than the day before
- The 200-day simple average of the stock is greater than the day before
- Both the weekly and daily stochastic indicators have been below 20 in the last five days
- Both the weekly and daily stochastic indicators are greater than the day before.
The system as coded has two exits: 1) an indicator exit using the weekly and daily indicators (exitType=1), and 2) a three-moving-average trend-following exit (exitType=2). All the tests used the same entry rule and were run on an old 2014 list of the NASDAQ 100 stocks that included all the stocks no longer trading. The test divided total capital by the 100 stocks traded. In this way, all the signals are traded, but leverage was only 40% to 50%. Figure 6 shows the long equity curve using the trend-following exit. Figure 7 shows the related underwater equity curve.
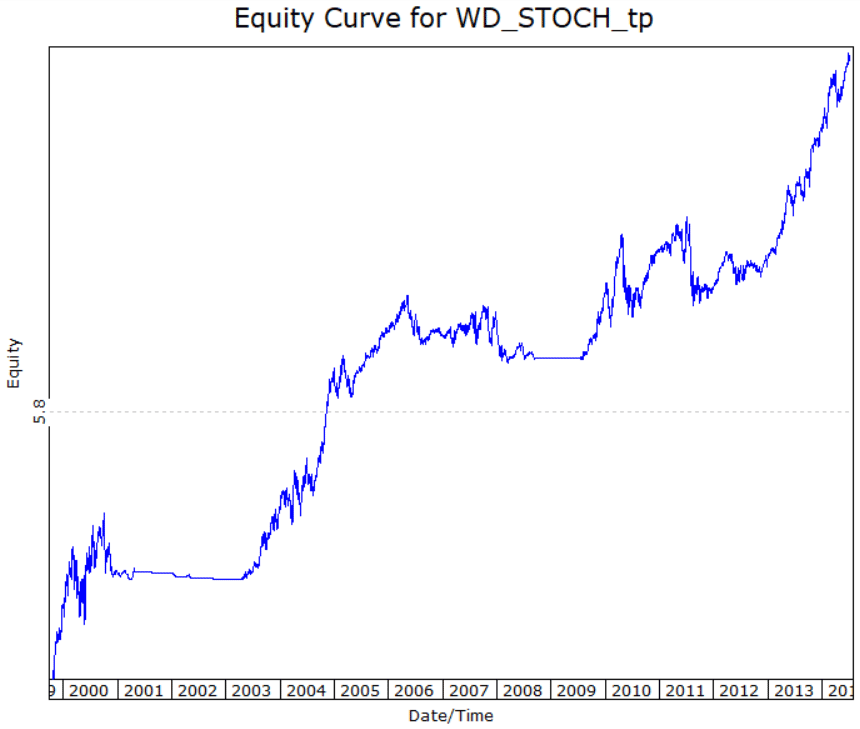
FIGURE 6: TRADERSSTUDIO. Here is a sample equity curve for the test using a trend-following exit.
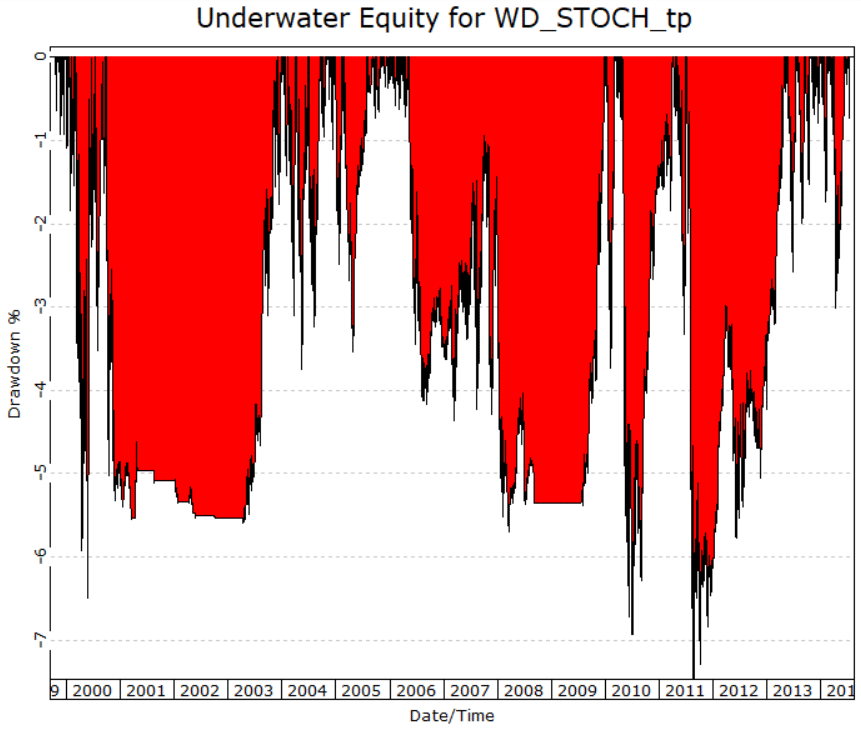
FIGURE 7: TRADERSSTUDIO. Here is a sample underwater equity curve for the test using a trend-following exit.
The TradersStudio code is shown here:
'WEEKLY AND DAILY STOCHASTIC
'Author: Vitali Apirine, TASC Sept 2018
'Coded by: Richard Denning 7/14/2018
'www.TradersEdgeSystems.com

Sub WD_STOCH(stochLenD,stochAvgD,stochLenW,stochAvgW,SMAlen1,exitType)
'INPUTS:
'Periods = 14 (stochLenD)
'Periods1 = 3 (stochAvgD)
'Pds = 70 (stochLenW)
'Pds1 = 3 (stochAvgW)
'exitType = 2 (exitType 1 uses only WD_Stoch indicator
              'exitType 2 is trend following)

Dim StocD As BarArray
Dim SD As BarArray
Dim StocW As BarArray
Dim SW As BarArray
Dim SMA200 As BarArray
Dim NDXc As BarArray
Dim SMA200ndx As BarArray
Dim SMAlen2,SMAlen3
Dim SMA1 As BarArray
Dim SMA2 As BarArray
Dim SMA3 As BarArray

'INDICATOR CODE:
StocD = (C-Lowest(L,stochLenD))/(Highest(H,stochLenD)-Lowest(L,stochLenD))*100
SD = Average(StocD,stochAvgD)
StocW = (C-Lowest(L,stochLenW))/(Highest(H,stochLenW)-Lowest(L,stochLenW))*100
SW = Average(StocW,stochAvgW)
SMA200 = Average(C,200)
NDXc = C Of independent1
SMA200ndx = Average(NDXc,200)
SMAlen2 = SMAlen1*2
SMAlen3 = SMAlen1*4
SMA1 = Average(C,SMAlen1)
SMA2 = Average(C,SMAlen2)
SMA3 = Average(C,SMAlen3)

'SYSTEM CODE:
If SMA200 > SMA200[1] Then
    If SW > SW[1] And SD > SD[1] And countof(SW < 20,5,0)>=1 And countof(SD < 20,5,0)>=1 Then
        If SMA200ndx > SMA200ndx[1] Then Buy("LE",1,0,Market,Day)
    End If
End If

'EXIT TYPE 1:
If exitType=1 And SD < SD[1] And SW < SW[1] Then ExitLong("LX","",1,0,Market,Day)

'EXIT TYPE 2:
If exitType=2 Then
If C[BarsSinceEntry]<SMA1[BarsSinceEntry] And C[BarsSinceEntry]<SMA2[BarsSinceEntry] And C[BarsSinceEntry]<SMA3[BarsSinceEntry] Then
    If SD < SD[1] And SW < SW[1] Then ExitLong("LX","",1,0,Market,Day)
End If
If C[BarsSinceEntry]>SMA1[BarsSinceEntry] And C<SMA1 Then ExitLong("LXsma1","",1,0,Market,Day)
If C[BarsSinceEntry]>SMA2[BarsSinceEntry] And C<SMA2 Then ExitLong("LXsma2","",1,0,Market,Day)
If C[BarsSinceEntry]>SMA3[BarsSinceEntry] And C<SMA3 Then ExitLong("LXsma3","",1,0,Market,Day)
If BarsSinceEntry > 250 Then ExitLong("LXtime","",1,0,Market,Day)
End If

End Sub
—Richard Denning
info@TradersEdgeSystems.com
for TradersStudio
BACK TO LIST

AIQ: SEPTEMBER 2018
The AIQ code based on Vitali Apirine’s article in this issue, “Weekly & Daily Stochastics,” is provided at www.TradersEdgeSystems.com/traderstips.htm, as well as below.
Using Apirine’s weekly and daily stochastic indicators and a moving average to determine trend direction, I created an example system (long only) with the following rules:
Enter long next bar at open when all of the following are true:
- The 200-day simple average of the NDX is greater than the day before
- The 200-day simple average of the stock is greater than the day before
- Both the weekly and daily stochastic indicators have been below 20 in the last five days
- Both the weekly and daily stochastic indicators are greater than the day before.
I tested three exits. Figure 8 shows a 21-day hold then exit. Figure 9 shows a three-moving-average trend-following exit. Figure 10 shows an exit using only the weekly & daily stochastic, once both are lower than the day before.

FIGURE 8: AIQ, BUY & HOLD. Here is the sample equity curve (blue) compared to the NDX (red) for the test using a 21-day hold exit.

FIGURE 9: AIQ, TREND-FOLLOWING EXIT. Here is the sample equity curve (blue) compared to the NDX index (red) for the test using a trend-following exit.
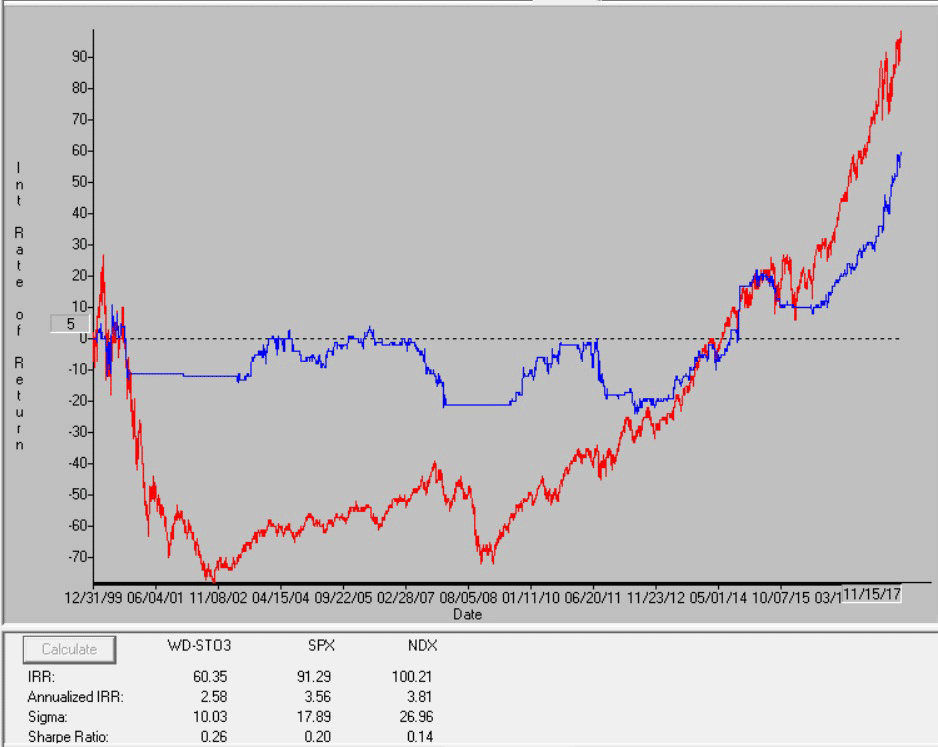
FIGURE 10: AIQ, W&D STOCHASTIC EXIT. Here is the sample equity curve (blue) compared to the NDX index (red) for the test using the weekly & daily stochastic indicators.
The 21-day hold test showed a 11.2% return with a maximum drawdown of 29.3%. The trend-following exit test showed a 17.6% return with a maximum drawdown of 28.8%. The test using an exit based on only the weekly & daily stochastic indicators showed a return of 2.9% with a maximum drawdown of 32.5%. All the tests used the same entry rule and were run on an old 2016 list of the NASDAQ 100 stocks with the stocks that are no longer trading deleted.
!WEEKLY AND DAILY STOCHASTIC
!Author: Vitali Apirine, TASC Sept 2018
!Coded by: Richard Denning 7/7/2018
!www.TradersEdgeSystems.com

!INPUTS:
Periods is 14.
Periods1 is 3.
Pds is 70.
Pds1 is 3.
smaLen1 is 70.
exitType is 1.

!ABBREVIATIONS:
C is [close].
H is [high].
L is [low].

!INDICATOR CODE:
STOCD is (C-LOWRESULT(L,Periods))/(HIGHRESULT(H,Periods)-LOWRESULT(L,Periods))*100.
SD is Simpleavg(Stocd,Periods1).
StocW is (C-LOWRESULT(L,Pds))/(HIGHRESULT(H,Pds)-LOWRESULT(L,Pds))*100.
SW is Simpleavg(Stocw,Pds1).
HD if hasdatafor(1000) >= 500.
SMA200 is simpleavg(C,200).
SMA200ndx is tickerUDF("NDX",SMA200).

!SYSTEM CODE:
Buy if SMA200ndx > valresult(SMA200ndx,1)
          and SMA200 > valresult(SMA200,1)
          and SW > valresult(SW,1)
          and SD > valresult(SD,1)
          and countof(SW < 20,5)>=1
          and countof(SD < 20,5)>=1
          and HD.
smaLen2 is smaLen1*2.
smaLen3 is smaLen1*4.
SMA1 is simpleavg(C,smaLen1).
SMA2 is simpleavg(C,smaLen2).
SMA3 is simpleavg(C,smaLen3).
PD is {position days}.

!EXIT TYPE 1 USES THE INDICATOR ONLY
!EXIT TYPE 2 IS TREND FOLLOWING
Sell if (SD < valresult(SD,1) and SW < valresult(SW,1) and exitType=1)
       or (exitType = 2
           and ((Valresult(C,PD)<Valresult(SMA1,PD)
           And Valresult(C,PD)<Valresult(SMA2,PD)
           And Valresult(C,PD)<Valresult(SMA3,PD)
           And SD < Valresult(SD,1) And SW < valresult(SW,1))
       or (Valresult(C,PD)>valresult(SMA1,PD) And C<SMA1)
       or (Valresult(C,PD)>valresult(SMA2,PD) And C<SMA2)
       or (Valresult(C,PD)>valresult(SMA3,PD) And C<SMA3)
       or PD > 250)).

RSS is C/valresult(C,120).
RSL is C/valresult(C,240).
—Richard Denning
info@TradersEdgeSystems.com
for AIQ Systems
BACK TO LIST

NINJATRADER: SEPTEMBER 2018
The weekly & daily stochastic indicator, as discussed in Vitali Apirine’s article in this issue, is available for download at the following links for NinjaTrader 8 and for NinjaTrader 7:
Once the file has been downloaded, you can import the indicator into NinjaTader 8 from within the control center by selecting Tools → Import → NinjaScript Add-On and then selecting the downloaded file for NinjaTrader 8. To import into NinjaTrader 7, from within the control center window, select the menu File → Utilities → Import NinjaScript and select the downloaded file.
You can review the indicator’s source code in NinjaTrader 8 by selecting the menu New → NinjaScript Editor → Indicators from within the control center window and selecting the WnDStochastic file. You can review the indicator’s source code in NinjaTrader 7 by selecting the menu Tools → Edit NinjaScript → Indicator from within the control center window and selecting the WnDStochastic file.
NinjaScript uses compiled DLLs that run native, not interpreted, which provides you with the highest performance possible.
A sample chart implementing the strategy is shown in Figure 11.

FIGURE 11: NINJATRADER. In this sample chart, the WnDStochastic indicator shows momentum for the Dow Jones Industrial Average during early 2009.
—Raymond Deux & Jim Dooms
NinjaTrader, LLC
www.ninjatrader.com
BACK TO LIST

QUANTACULA: SEPTEMBER 2018
The daily & weekly stochastic as discussed in Vitali Apirine’s article in this issue can be easily composed in Quantacula Studio by using the stochK (stochastic %K) and SMA (simple moving average) indicators.
Here, we first dragged the stochK indicators onto the chart, providing them periods of 14 and 70, as described in Apirine’s article. We assigned them light colors so they would be visible in the chart in the background. Next, we dropped the SMA indicator atop each of the stochKs, giving the two SMA indicators a period of 3.
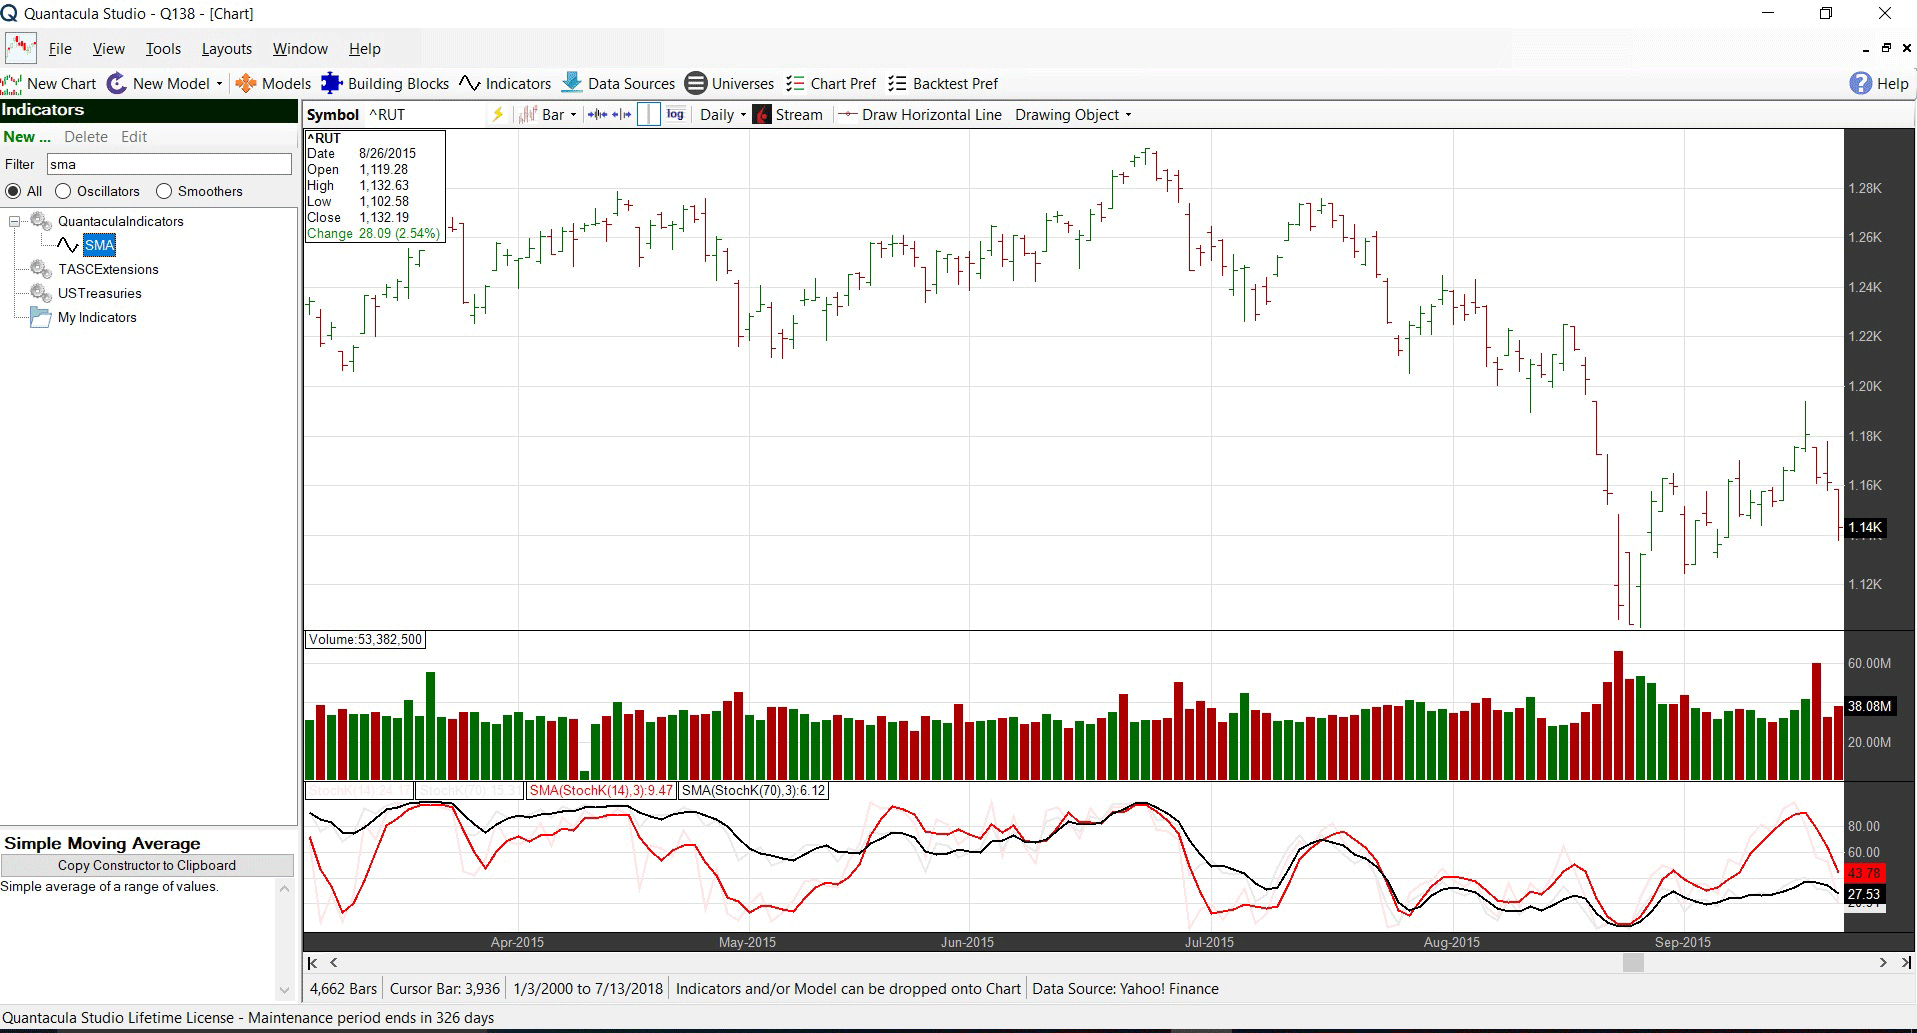
FIGURE 12: QUANTACULA. The stochK indicators are shown on the chart along with three-period SMAs.
—Dion Kurczek, Quantacula LLC
info@quantacula.com
www.quantacula.com
BACK TO LIST

TRADE NAVIGATOR: SEPTEMBER 2018
We’re making available a file for download within the Trade Navigator library to make it easy for users to implement the indicator discussed in “Weekly & Daily Stochastics” by Vitali Apirine in this issue.
The filename is “SC201809.” To download it, click on Trade Navigator’s blue telephone button, select download special file, and replace the word “upgrade” with “SC201809” (without the quotes). Then click the start button. When prompted to upgrade, click the yes button. If prompted to close all software, click on the continue button. Your library will now download.
This library contains two indicators named “StocD” and “StocW,” plus a template and a study named “W&D Stochastics.”
Template
For your convenience, we have added a template to the library that allows you to modify your chart with a prebuilt indicator package and settings. To access it, open the charting pulldown menu, select the templates command, then from the submenu that opens, select the “W&D stochastics” template. If you receive the prompt “save the current chart settings as template?”, your answer will depend on whether you have made any changes to your current chart template that you would like to keep. If you choose “no,” these changes will be discarded, and a “yes” choice will save changes into the prior template on your chart before switching the template to the “W&D stochastics” template. A sample chart of the W&D stochastics is shown in Figure 13.
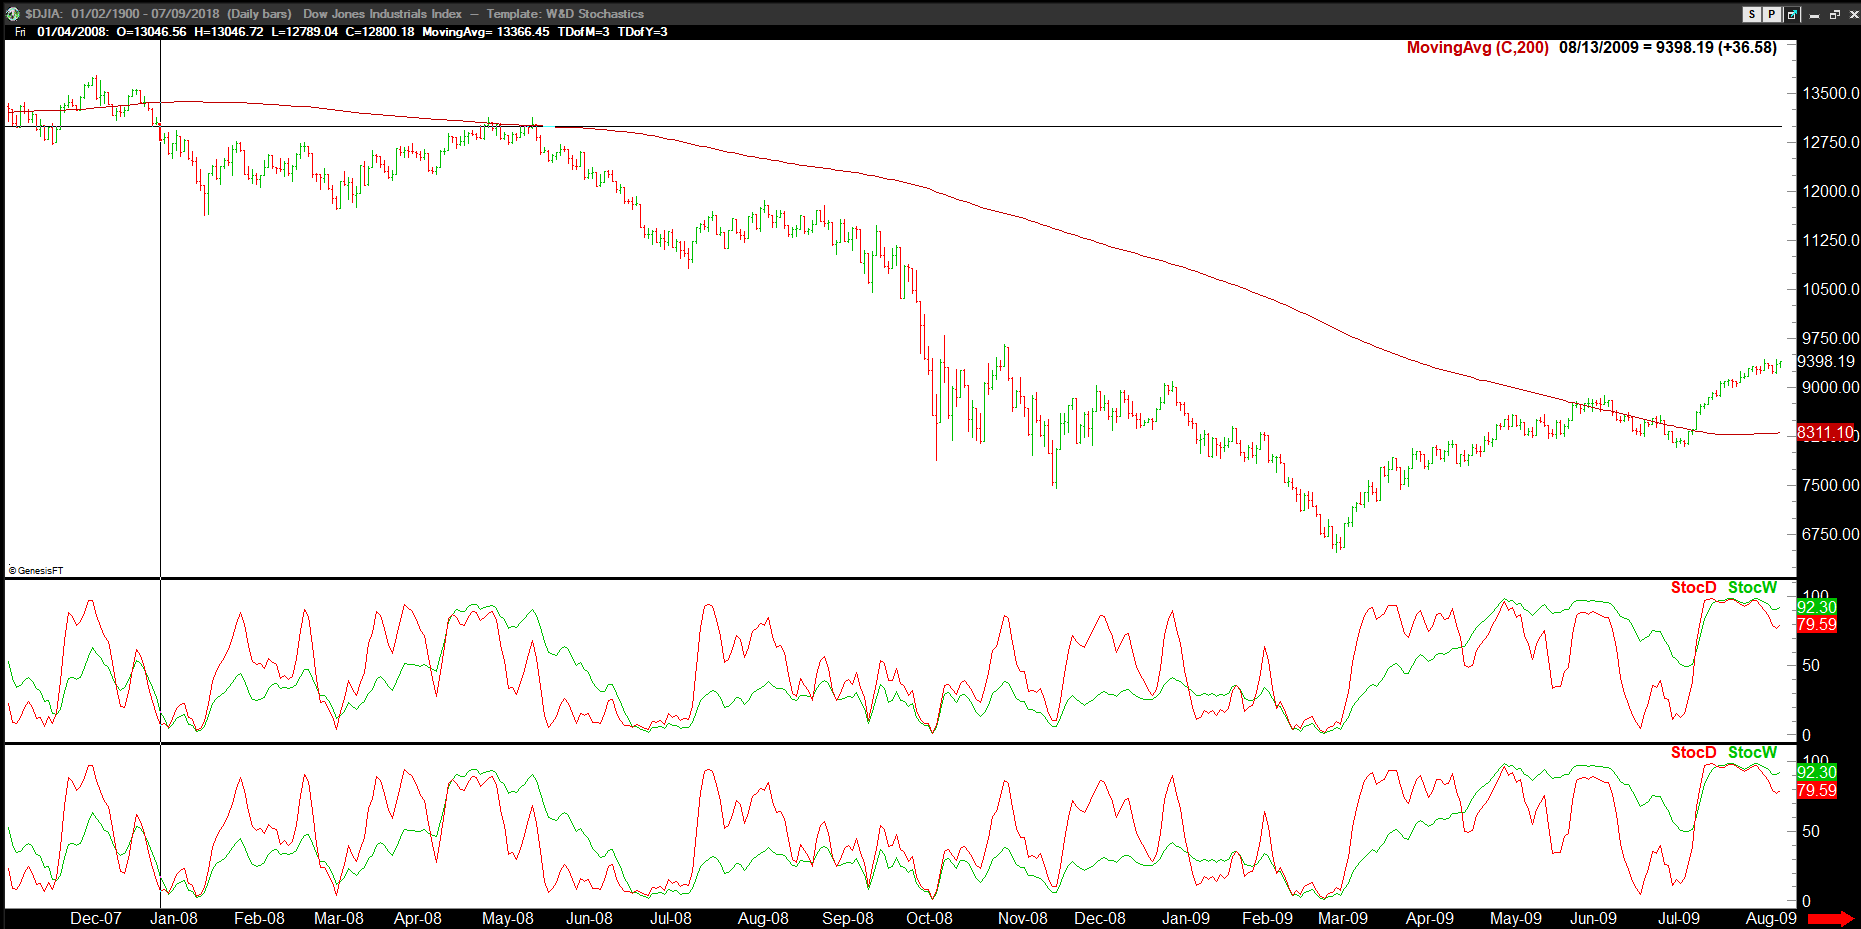
FIGURE 13: TRADE NAVIGATOR, W&D STOCHASTICS. This sample chart shows the W&D stochastics.
To recreate these indicators manually, click on the edit dropdown menu, open the trader’s toolbox (or use CTRL+T), and click on the functions tab. Next, click on the new button, and a new function dialog window will open. In its text box, input the code for the highlight bar. Ensure that there are no extra spaces at the end of each line. When completed, click on the verify button. You may be presented with an add inputs pop-up message if there are variables in the code. If so, click the yes button, then enter a value in the default value column. If all is well, when you click on the function tab, the code you entered will convert to italic font. Click on the save button and type a name for the indicator.
TradeSense Code

StocD:
&periods := 14
&periods1 := 3
&StocD := (Close - Lowest (Low , &periods)) / (Highest (High , &periods) - Lowest (Low , &periods)) * 100
&SD := MovingAvg (&StocD , &periods1)
&SD
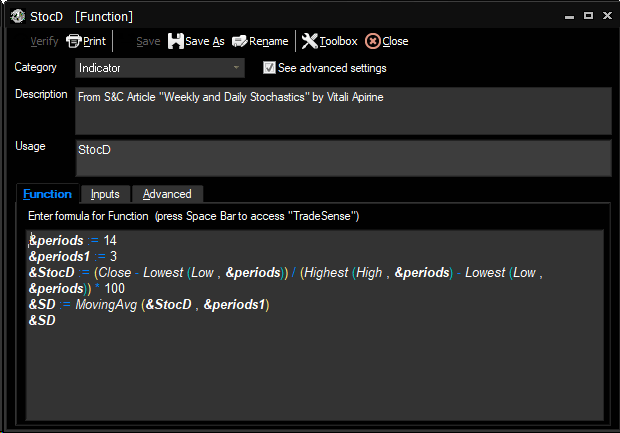
FIGURE 14: TRADE NAVIGATOR, DAILY STOCHASTIC. Shown here is the TradeSense code for creating the StocD indicator.
StocW:
&pds := 70
&pds1 := 3
&StocW := (Close - Lowest (Low , &pds)) / (Highest (High , &pds) - Lowest (Low , &pds)) * 100
&SW := MovingAvg (&StocW , &pds1)
&SW
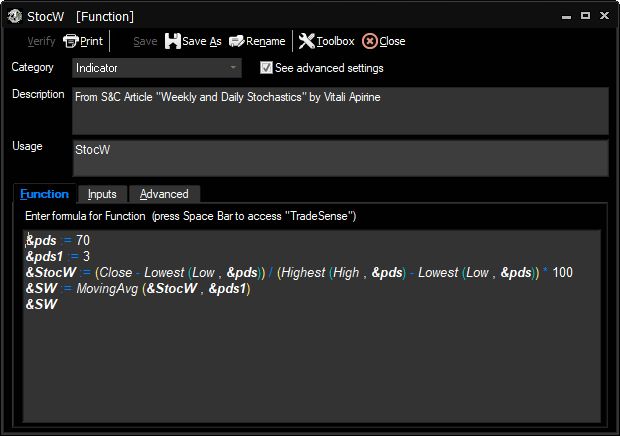
FIGURE 15: TRADE NAVIGATOR, WEEKLY STOCHASTIC. Shown here is the TradeSense code for creating the StocW indicator.
Adding to your chart
You can insert these indicators onto your chart by opening the charting dropdown menu, select the add to chart command, then on the indicators tab, find your named indicator and select it, then click on the add button. Repeat this procedure for additional indicators if you wish. You may also consider selecting the studies tab and add the study to your chart, which is a prebuilt pane containing the indicators in preformatted form.
Users may contact our technical support staff by phone or by live chat if any assistance is needed in using the indicators, study, or template.
—Genesis Financial Technologies
Tech support 719 884-0245
www.TradeNavigator.com
BACK TO LIST
MICROSOFT EXCEL: SEPTEMBER 2018
In “Weekly & Daily Stochastics” in this issue, author Vitali Apirine continues his exploration of some common indicators evaluated at different computation intervals (see the past articles of his, “Weekly & Daily MACD” from the December 2017 issue, and “Weekly & Daily Percentage Price Oscillator” from the February 2018 issue of S&C).
Quite a bit of information is available on the chart when we watch the action of the stochastics computed at the weekly and daily intervals and contrast that with the price action. We can see a bit of telegraphing of breakdowns and breakouts in the stochastics.
With this month’s spreadsheet that I am providing, you can also change the intervals to play what-if.
See Figure 16 for an approximation of Figure 2 from Apirine’s article.

FIGURE 16: EXCEL. Here is my approximation of Figure 2 from Vitali Apirine’s article in this issue.
Drawing trendlines
I have not found a reliable way to use my code to dynamically draw trendlines on a chart. So I cannot dynamically replicate the trendlines and support lines you see in Apirine’s Figures 3, 4, & 5 from his article.
However, you, as the spreadsheet user, can draw your own lines by way of the straight line tool found in the shapes dropdown under the insert tab of the Excel ribbon (Figure 17). Here’s how: Click the straight line tool. Next, hover the cursor over the point on the chart where you want the line to begin. Then left-click and hold while you drag from that point to the point where you want the line to stop.
Note this will produce a static line. It will not be dynamically tied to the chart in any way. So it will stay in that exact spot over the chart no matter what happens to the data and the chart underneath. However, you can move the line as you see fit. Left-click and hold on an endpoint of the line and drag to new locations. Do the same for the other endpoint of the line.

FIGURE 17: EXCEL. You can draw trendlines and other lines on the chart by using the line tool from the shapes dropdown menu.
To open a dialog where you can pick colors and line styles or change the shapes at the line endpoints, right-click on a line and select the format shape entry from the dropdown. Finally, you can delete a line by right-clicking on the line and selecting cut from the dropdown.
To draw circles on your chart, the circle tool is also available from the shapes dropdown and can be drawn and manipulated in the same fashion as lines.
More fixes for Yahoo issues
Several readers have written to say that the recent spreadsheets have worked well for a time and suddenly they all fail at the same time with the same error on a “.refresh” statement. Over time there have been a couple of different failures at this statement.
If you have already applied all of the previously published fixes to your spreadsheets and still have a failure, read on.
The current Yahoo Finance history access protocol requires that each request be accompanied by a valid cookie and the crumb value that matches the cookie.
I believe that this most recent all-or-nothing failure for some readers is a function of the Yahoo Finance cookie held in their cookie cache reaching its annual expiration. Behind the scenes, a new cookie is sent to their computer and a new corresponding crumb value is generated.
For those with the failure, that newly generated crumb contains a problem I did not anticipate when I built the code to extract the crumb from HTML text. And not everyone will experience the crumb problem, as each Yahoo cookie is unique and will generate a unique crumb. The problem crumbs contain an escape sequence for an HTML context-sensitive character. That escape sequence needs to be translated back to the real character before the crumb is used.
For further details and a way to fix this escape sequence problem in each of the recent spreadsheets, please read the “general construction notes” section on the notes tab of this month’s spreadsheet.
This month’s spreadsheet for this September 2018 issue already incorporates the necessary fix.
Downloading the spreadsheet file
The “WeeklyDailyStochastics.xlsm” spreadsheet file for this Traders’ Tip can be downloaded here. To successfully download it, follow these steps:
- Right-click on the Excel file link, then
- Select “save as” (or “save target as”) to place a copy of the spreadsheet file on your hard drive.
—Ron McAllister
Excel and VBA programmer
rpmac_xltt@sprynet.com
BACK TO LIST
Originally published in the September 2018 issue of
Technical Analysis of STOCKS & COMMODITIES magazine.
All rights reserved. © Copyright 2018, Technical Analysis, Inc.


