TRADERS’ TIPS
December 2018

For this month’s Traders’ Tips, the focus is Sylvain Vervoort’s
article in the May 2018 issue, “The
V-Trade, Part 3: Technical Analysis—Fibonacci Projections And Daily
Pivots.” Here, we present the December 2018 Traders’ Tips
code with possible implementations in various software.
You can right-click on any chart to open it in a new tab or window
and view it at it’s originally supplied size, often much larger than
the version printed in the magazine.
The Traders’ Tips section is provided to help the reader implement
a selected technique from an article in this issue or another recent issue.
The entries here are contributed by software developers or programmers for
software that is capable of customization.

TRADESTATION: DECEMBER 2018
Sylvain Vervoort, in his May 2018 STOCKS & COMMODITIES article, “The
V-Trade, Part 3: Technical Analysis—Fibonacci Projections And Daily Pivots,” introduces
a modified version of the venerable floor trader pivots that he calls SvePivots.
With his new SvePivots, he identifies additional support & resistance levels
beyond the standard calculations. These include mid-levels between the between
normal support & resistance as well as prior day highs and lows.
The TradeStation EasyLanguage code for the SvePivots indicator based on the
author’s work is presented here.
Indicator: SvePivots
// SvePivots
// Sylvain Vervoort
// TASC Dec 2018

inputs:
	int R3Color( RGB(250,48,8) ),
	int R2Color( RGB(250,100,103) ),
	int R1Color( RGB(252,180,148) ),
	int PivotColor( RGB(240,209,50) ),
	int S1Color( RGB(192,221,250) ),
	int S2Color( RGB(113,181,250) ),
	int S3Color( RGB(35,141,247) ),
	int YestHighColor( RGB(18,252,65) ),
	int YestLowColor( RGB(252,18,61) ) ;


variables:
	intrabarpersist int BT( 0 ),
	int CurrSess( 0 ),
	bool CalcTrigger( false ),
    double S1( 0 ),
	double S2( 0 ),
	double S3( 0 ),
	double R1( 0 ),
	double R2( 0 ),
	double R3( 0 ),
	double SM1( 0 ),
	double SM2( 0 ),
	double SM3( 0 ),
	double RM1( 0 ),
	double RM2( 0 ),
	double RM3( 0 ),
	double PP( 0 ),
	double TodaysHigh( 0 ),
	double YestHigh( 0 ),
	double TodaysLow( 0 ),
	double YestLow( 0 ),
	double TodaysClose( 0 ),
	double YestClose( 0 ),
	int Counter( 0 );


CurrSess = CurrentSession( 0 );
CalcTrigger = CurrSess <> CurrSess[1];

if CalcTrigger then
begin
	if CurrentBar > 1 then
		Counter = Counter + 1;

	YestHigh = TodaysHigh;
	YestLow = TodaysLow;
	YestClose = Close[1];
	TodaysHigh = High;
   	TodaysLow = Low;

	PP = ( YestHigh + YestLow + YestClose ) / 3;
	R1 = PP * 2 - YestLow;
	R2 = PP + YestHigh - YestLow;
	R3 = PP * 2 + ( YestHigh - YestLow * 2 ) ;
	S1 = PP * 2 - YestHigh;
	S2 = PP - YestHigh + YestLow;
	S3 = PP * 2 - ( YestHigh * 2 - YestLow ) ;

	RM1 = ( R1 - PP ) / 2 + PP ;
	SM1 = ( PP - S1 ) / 2 + S1 ;
	RM2 = ( R2 - R1 ) / 2 + R1 ;
	SM2 = ( S1 - S2 ) / 2 + S2 ;
	RM3 = ( R3 - R2 ) / 2 + R2 ;
	SM3 = ( S2 - S3 ) / 2 + S3 ;

   	if BT <> 2 then
   	begin
   		SetPlotColor[1]( 1, Transparent );
   		SetPlotColor[1]( 2, Transparent );
   		SetPlotColor[1]( 3, Transparent );
   		SetPlotColor[1]( 4, Transparent );
   		SetPlotColor[1]( 5, Transparent );
   		SetPlotColor[1]( 6, Transparent );
   		SetPlotColor[1]( 7, Transparent );
   		SetPlotColor[1]( 8, Transparent );
   		SetPlotColor[1]( 9, Transparent );
   		SetPlotColor[1]( 10, Transparent );
   		SetPlotColor[1]( 11, Transparent );
   		SetPlotColor[1]( 12, Transparent );
   		SetPlotColor[1]( 13, Transparent );
   		SetPlotColor[1]( 14, Transparent );
   		SetPlotColor[1]( 15, Transparent );
 	end;
end
else
begin
	if High > TodaysHigh then
		TodaysHigh = High;
	if Low < TodaysLow then
		TodaysLow = Low;
end;

if Counter >= 2 then
begin
	Plot1( R3, "R3", R3Color  );
	Plot2( R2, "R2", R2Color );
	Plot3( R1, "R1", R1Color );
	Plot4( PP, "PP", PivotColor );
	Plot5( S1, "S1", S1Color );
	Plot6( S2, "S2", S2Color );
	Plot7( S3, "S3", S3Color );
	Plot8( RM3, "RM3", R3Color );
	Plot9( RM2, "RM2", R2Color );
	Plot10( RM1, "RM1", R1Color );
	Plot11( SM1, "SM1", S1Color );
	Plot12( SM2, "SM2", S2Color );
	Plot13( SM3, "SM3", S3Color );
	Plot14( YestHigh, "YestHigh",
		YestHighColor ) ;
	Plot15( YestLow, "YestLow",
		YestLowColor) ;
end;
To download the EasyLanguage code, please visit our TradeStation and EasyLanguage
support forum. The files for this article can be found here: https://community.tradestation.com/Discussions/Topic.aspx?Topic_ID=152631.
The filename is “TASC_DEC2018.ZIP.”
For more information about EasyLanguage in general, please see https://www.tradestation.com/EL-FAQ.
A sample chart is shown in Figure 1.

FIGURE 1: TRADESTATION. This intraday
TradeStation chart of the euro FX futures shows the SvePivot levels.
This article is for informational purposes. No type of trading or investment
recommendation, advice, or strategy is being made, given, or in any manner
provided by TradeStation Securities or its affiliates.
—Doug McCrary
TradeStation Securities, Inc.
www.TradeStation.com
BACK TO LIST

METASTOCK: DECEMBER 2018
Sylvain Vervoort’s May 2018 article in STOCKS & COMMODITIES, “The
V-Trade, Part 3: Technical Analysis—Fibonacci Projections And Daily Pivots,” introduced
a modified pivot point indicator called “SvePivots.” The MetaStock
formula for that indicator is shown here:
SvePivots
new:=ROC(DayOfWeek(),1,$)<>0;
YH:=ValueWhen(1,new, Ref(HighestSince(1,new,H),-1));
YL:=ValueWhen(1,new, Ref(LowestSince(1,new,L),-1));
YC:=ValueWhen(1,new, Ref(C,-1));
pp:=(YC+YH+YL)/3;
r1:=(pp*2)-YL;
s1:=(pp*2)-YH;
r2:= pp+(YH-YL);
s2:= pp-(YH-YL);
r3:= (pp*2)+(YH-(YL*2));
s3:= (pp*2)-((YH*2)-YL);
rm1:= ((r1-pp)/2)+pp;
sm1:= ((pp-s1)/2)+s1;
rm2:= ((r2-r1)/2)+r1;
sm2:= ((s1-s2)/2)+s2;
rm3:= ((r3-r2)/2)+r2;
sm3:= ((s2-s3)/2)+s3;
YH; {previous day's high}
YL; {previous day's low}
r3;
rm3;
r2;
rm2;
r1;
rm1;
pp;
sm1;
s1;
sm2;
s2;
sm3;
s3;
This indicator plots 15 lines (Figure 2). Thirteen of those are in numerical
order from highest to lowest. The R3 line is always the top and the S3 line
is always the bottom of these 13 lines. However, the lines for the previous
day’s high and low will shift where they are among the other lines. This
behavior is normal but causes difficulty in coloring the lines.
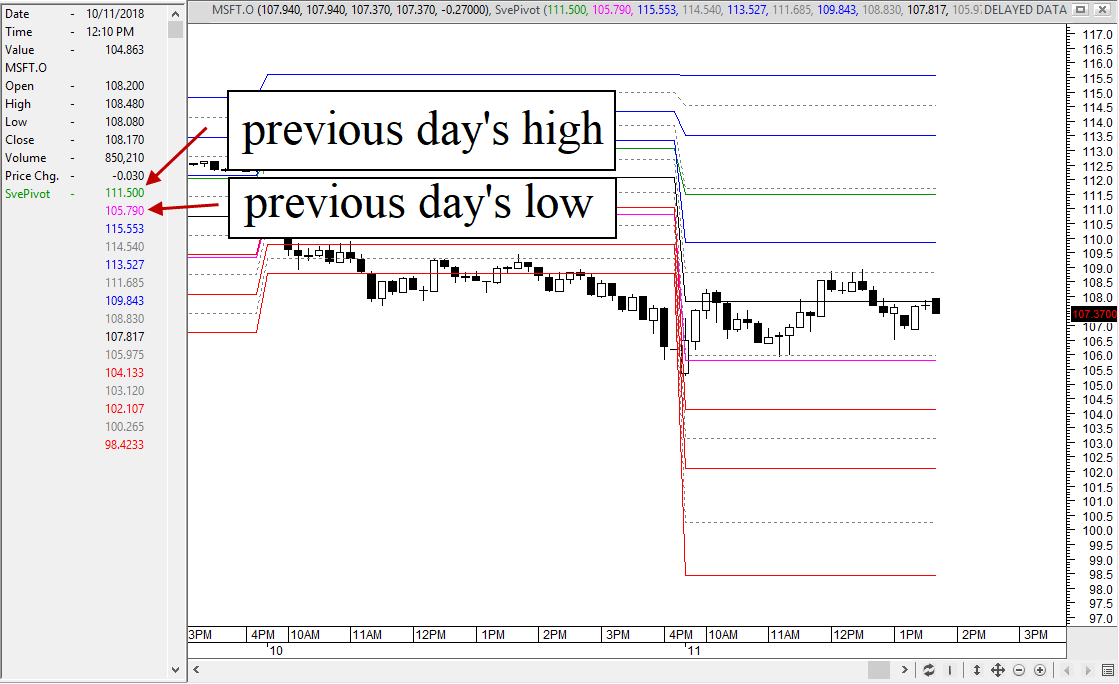
FIGURE 2: METASTOCK. This indicator
plots 15 lines. Thirteen of those are in numerical order from highest to
lowest. The R3 line is always the top and the S3 line is always the bottom
of these 13 lines. However, the lines for the previous day’s high and
low will shift where they are among the other lines.
MetaStock’s formula language does not allow colors to be assigned as
part of the formula. Instead, the colors and line styles are set after the
indicator is plotted in the chart. To facilitate coloring the previous day’s
high and low prices, these two lines are the first ones plotted. That means
if you look at the data window or the tool tip for this indicator, those values
will be listed first. That allows you to find them more easily in the list
of the lines and then assign the desired colors. The remaining lines can then
be colored by counting from either the top or bottom of the list.
—William Golson
MetaStock Technical Support
www.metastock.com
BACK TO LIST

eSIGNAL: DECEMBER 2018
For this month’s Traders’ Tip, we’ve provided the study SvePivots.efs,
based on the May 2018 in S&C by Sylvain Vervoort, “The V-Trade, Part
3: Technical Analysis—Fibonacci Projections And Daily Pivots,” This
study displays daily pivots.
The studies contain formula parameters which may be configured through the
Edit Chart window (right-click on the chart and select “Edit Chart”).
A sample chart is shown in Figure 3.

FIGURE 3: eSIGNAL. Here is an example
of the study plotted on a 60-minute chart of CAD A0-FX.
To discuss this study or download a complete copy of the formula code, please
visit the EFS Library Discussion Board forum under the forums link from the
support menu at www.esignal.com or
visit our EFS KnowledgeBase at https://www.esignal.com/support/kb/efs/.
The eSignal formula script (EFS) is also available for copying & pasting
below.
/*********************************
Provided By:
eSignal (Copyright c eSignal), a division of Interactive Data
Corporation. 2016. All rights reserved. This sample eSignal
Formula Script (EFS) is for educational purposes only and may be
modified and saved under a new file name.  eSignal is not responsible
for the functionality once modified.  eSignal reserves the right
to modify and overwrite this EFS file with each new release.

Description:
    Pivotal Concerns. The V-Trade. Part 3: Technical Analysis—Fibonacci Projections And Daily Pivots by Sylvain Vervoort


Version:            1.00  10/19/2018

Notes:
The related article is copyrighted material. If you are not a subscriber
of Stocks & Commodities, please visit www.traders.com.

**********************************/
var fpArray = new Array();
function preMain()
{
    setPriceStudy(true);
    setStudyTitle("SvePivots");
    setCursorLabelName("Pivot", 0);
    setCursorLabelName("Resistance 1", 1);
    setCursorLabelName("Support 1", 2);
    setCursorLabelName("Resistance 2", 3);
    setCursorLabelName("Support 2", 4);
    setCursorLabelName("Resistance 3", 5);
    setCursorLabelName("Support 3", 6);
    setCursorLabelName("Previous day low", 7);
    setCursorLabelName("Resistance 1 mean value", 8);
    setCursorLabelName("Support 1 mean value", 9);
    setCursorLabelName("Resistance 2 mean value", 10);
    setCursorLabelName("Support 2 mean value", 11);
    setCursorLabelName("Resistance 3 mean value", 12);
    setCursorLabelName("Support 3 mean value", 13);
    setCursorLabelName("Previous day High", 14);


    setDefaultBarFgColor(Color.blue,0);
    setDefaultBarFgColor(Color.yellow,1);
    setDefaultBarFgColor(Color.yellow,2);
    setDefaultBarFgColor(Color.RGB(250, 100, 0),3);
    setDefaultBarFgColor(Color.RGB(250, 100, 0),4);
    setDefaultBarFgColor(Color.red,5);
    setDefaultBarFgColor(Color.red,6);
    setDefaultBarFgColor(Color.RGB(255,0,255),7);
    setDefaultBarFgColor(Color.lightgrey,8);
    setDefaultBarFgColor(Color.lightgrey,9);
    setDefaultBarFgColor(Color.lightgrey,10);
    setDefaultBarFgColor(Color.lightgrey,11);
    setDefaultBarFgColor(Color.lightgrey,12);
    setDefaultBarFgColor(Color.lightgrey,13);
    setDefaultBarFgColor(Color.RGB(0,255,0),14);

    setDefaultBarStyle(PS_SOLID,0);
    setDefaultBarStyle(PS_SOLID,7);
    setDefaultBarStyle(PS_SOLID,14);
    setDefaultBarStyle(PS_DOT,1);
    setDefaultBarStyle(PS_DOT,3);
    setDefaultBarStyle(PS_DOT,5);
    setDefaultBarStyle(PS_DOT,8);
    setDefaultBarStyle(PS_DOT,10);
    setDefaultBarStyle(PS_DOT,12);
    setDefaultBarStyle(PS_DASHDOT,2);
    setDefaultBarStyle(PS_DASHDOT,4);
    setDefaultBarStyle(PS_DASHDOT,6);
    setDefaultBarStyle(PS_DASHDOT,9);
    setDefaultBarStyle(PS_DASHDOT,11);
    setDefaultBarStyle(PS_DASHDOT,13);

    setDefaultBarThickness(2,0);
    setDefaultBarThickness(2,1);
    setDefaultBarThickness(2,2);
    setDefaultBarThickness(2,3);
    setDefaultBarThickness(2,4);
    setDefaultBarThickness(2,5);
    setDefaultBarThickness(2,6);
    setDefaultBarThickness(2,7);
    setDefaultBarThickness(2,8);
    setDefaultBarThickness(2,9);
    setDefaultBarThickness(2,10);
    setDefaultBarThickness(2,11);
    setDefaultBarThickness(2,12);
    setDefaultBarThickness(2,13);
    setDefaultBarThickness(2,14);

}


var dClose = null;
var dOpen = null;
var dHigh = null;
var dLow = null;
var bInit = false;
var bVersion = null;

//
var ThisDay = null;
var bForex = false;
var vHHV_1 = 0;
var vHHV = 0;
var vLLV_1 = 0;
var vLLV = 0;
var vClose_1 = null;
var vClose = null;
var vClosed = null;
var vLow;
var vHigh;
var vPivot = null;
var R1 = null;
var S1 = null;
var R2 = null;
var S2 = null;
var R3 = null;
var S3 = null;
var PL = null;
var PH = null;
var R1M = null;
var S1M = null;
var R2M = null;
var S2M = null;
var R3M = null;
var S3M = null;
var retArr;

function main()
{
    if (bVersion == null) bVersion = verify();
    if (bVersion == false) return;

    if (getBarState() == BARSTATE_ALLBARS){
        bInit = false;
    }

    if (!bInit){
        bForex = Is_Forex();
        if (bForex == false){
            dHigh  = high(inv('D'));
            dLow   = low(inv('D'));
            dClose = close(inv('D'));
        }
        bInit = true;
    }

    if (bForex == true){
        var dDay = getValue("rawtime");
        vFirstIndex = getFirstBarIndexOfDay(dDay);
        if (vFirstIndex == null) return;
        var Date = getValue("Time", 0);
        ThisDay = Date.getDay();

        var diff = getCurrentBarIndex() - vFirstIndex;
        if (diff == 0 && ThisDay != 0) {
            vHHV_1 = vHHV;
            vHHV = high(0);
            vLLV_1 = vLLV;
            vLLV = low(0);
            vClose_1 = vClose;
        }
        vClose = close(0);
        if ( vClose_1 == null ) return;

        if (ThisDay == 0) {
            if (hour(0) <19) {
                return;
            }
            else {
                if (high(0) > vHHV) vHHV = high(0);
                if (low(0) < vLLV) vLLV = low(0);
                vClose = close(0);
                return retArr;
            }
        }
        else {

            if (high(0) > vHHV) vHHV = high(0);
            if (low(0) < vLLV) vLLV = low(0);
        }

        vClosed = vClose_1;
        vLow = vLLV_1;
        vHigh = vHHV_1;
        vPivot = null;
    }
    else {
        vClosed = dClose.getValue(-1);
        vLow = dLow.getValue(-1);
        vHigh = dHigh.getValue(-1);
    }

    vPivot = ( vHigh + vLow + vClosed ) / 3;
    if (vPivot == 0) return;


     R1 = 2 * vPivot - vLow;
     S1 = 2 * vPivot - vHigh;

     R2 = vPivot + (R1 - S1);
     S2 = vPivot - (R1 - S1);

     R3 = vHigh + 2 * (vPivot - vLow);
     S3 = vLow - 2 * (vHigh - vPivot);

     PL = vLow;
     PH = vHigh;

     R1M = (R1 - vPivot) / 2 + vPivot;
     S1M = (vPivot - S1) / 2 + S1;

     R2M = (R2 - R1) / 2 + R1;
     S2M = (S1 - S2) / 2 + S2;

     R3M = (R3 - R2) / 2 + R2;
     S3M = (S2 - S3) / 2 + S3;

     retArr = new Array(vPivot, R1, S1, R2, S2, R3, S3, PL,  R1M, S1M, R2M, S2M, R3M, S3M, PH);

    return retArr;
}

function Is_Forex(){
    var sSymbol = getSymbol();
    var vLen = sSymbol.length;
    if (sSymbol.substr(vLen-3, 3) == '-FX'){
        bForex = true;
    }
    return bForex;
}

function verify(){
    var b = false;
    if (getBuildNumber() < 779){

        drawTextAbsolute(5, 35, "This study requires version 10.6 or later.",
            Color.white, Color.blue, Text.RELATIVETOBOTTOM|Text.RELATIVETOLEFT|Text.BOLD|Text.LEFT,
            null, 13, "error");
        drawTextAbsolute(5, 20, "Click HERE to upgrade.@URL=https://www.esignal.com/download/default.asp",
            Color.white, Color.blue, Text.RELATIVETOBOTTOM|Text.RELATIVETOLEFT|Text.BOLD|Text.LEFT,
            null, 13, "upgrade");
        return b;
    }
    else
        b = true;

    return b;
}
—Eric Lippert
eSignal, an Interactive Data company
800 779-6555, www.eSignal.com
BACK TO LIST

WEALTH-LAB: DECEMBER 2018
The code for Wealth-Lab for the SvePivots technique described by author Sylvain
Vervoort in his May 2018 article in S&C, “The V-Trade, Part 3: Technical
Analysis—Fibonacci Projections And Daily Pivots,” is presented
here. The included strategy demonstrates how to calculate the traditional as
well as the new pivot series. It uses data compressed in the daily scale and
then saves the information in the intraday scale so that it can be charted.
Figure 4 illustrates the usual “floor trader” pivots as well as
the new “SvePivots.”

FIGURE 4: WEALTH-LAB. This illustrates
the usual “floor trader” pivots as well as the new “SvePivots.”
Wealth-Lab strategy code (C#):

using System;
using System.Collections.Generic;
using System.Text;
using System.Drawing;
using WealthLab;
using WealthLab.Indicators;

namespace WealthLab.Strategies
{
	public class SvePivots : WealthScript
	{
		private StrategyParameter paramSwitch;

		public SvePivots()
		{
			paramSwitch = CreateParameter("Show SvePivots?", 1, 0, 1, 1 );
		}

		protected override void Execute()
		{
			if(!Bars.IsIntraday)
			{
				DrawLabel( PricePane, "Requires intraday data");
				Abort();
			}

			SetScaleDaily();
			DataSeries hPivot = AveragePriceC.Series(Bars);
			DataSeries hDayHigh = High;
			DataSeries hDayClose = Close;
			DataSeries hDayLow = Low;
			RestoreScale();
			hPivot = Synchronize( hPivot ) >> 1;
			hDayHigh = Synchronize( hDayHigh ) >> 1;
			hDayClose = Synchronize( hDayClose ) >> 1;
			hDayLow = Synchronize( hDayLow ) >> 1;

			var hR1 = ( 2 * hPivot - hDayLow );
			var hS1 = ( 2 * hPivot - hDayHigh );
			var hR2 = ( hPivot - ( hS1 - hR1 ) );
			var hS2 = ( hPivot - ( hR1 - hS1 ) );
			var hR3 = 2 * hPivot + (hDayHigh - (hDayLow * 2));
			var hS3 = 2 * hPivot - ((hDayHigh * 2) - hDayLow);

			var hRM1 = (hR1 - hPivot)/2 + hPivot;
			var hSM1 = (hPivot - hS1)/2 + hS1;
			var hRM2 = (hR2 - hR1)/2 + hR1;
			var hSM2 = (hS1 - hS2)/2 + hS2;
			var hRM3 = (hR3 - hR2)/2 + hR2;
			var hSM3 = (hS2 - hS3)/2 + hS3;

			hPivot.Description = "Pivot";
			hR1.Description = "R1"; hRM1.Description = "Resistance Mean value 1";
			hS1.Description = "S1"; hSM1.Description = "Support Mean value 1";
			hR2.Description = "R2"; hRM2.Description = "Resistance Mean value 2";
			hS2.Description = "S2"; hSM2.Description = "Support Mean value 2";
			hR3.Description = "R3"; hRM3.Description = "Resistance Mean value 3";
			hS3.Description = "S3"; hSM3.Description = "Support Mean value 3";

			HideVolume();
			PlotSeries( PricePane, hR2, Color.Maroon, LineStyle.Dotted, 1);
			PlotSeries( PricePane, hR1, Color.Olive, LineStyle.Solid, 1 );
			PlotSeries( PricePane, hPivot, Color.Blue, LineStyle.Solid, 1 );
			PlotSeries( PricePane, hS1, Color.Fuchsia, LineStyle.Dotted, 1 );
			PlotSeries( PricePane, hS2, Color.Red, LineStyle.Solid, 1 );

			bool showSvePivots = paramSwitch.Value == 1;
			if(showSvePivots)
			{
				PlotSeries( PricePane, hR3, Color.Maroon, LineStyle.Dotted, 1);
				PlotSeries( PricePane, hS3, Color.Red, LineStyle.Dotted, 1 );

				PlotSeries( PricePane, hRM1, Color.Maroon, LineStyle.Dashed, 1);
				PlotSeries( PricePane, hSM1, Color.Olive, LineStyle.Dashed, 1 );
				PlotSeries( PricePane, hRM2, Color.Blue, LineStyle.Dashed, 1 );
				PlotSeries( PricePane, hSM2, Color.Fuchsia, LineStyle.Dashed, 1 );
				PlotSeries( PricePane, hRM3, Color.Red, LineStyle.Dashed, 1 );
				PlotSeries( PricePane, hSM3, Color.Red, LineStyle.Dashed, 1 );
			}
		}
	}
}
—Eugene (Gene Geren), Wealth-Lab team
MS123, LLC
www.wealth-lab.com
BACK TO LIST

AMIBROKER: DECEMBER 2018
In Sylvain Vervoort’s May 2018 article in S&C, “The V-Trade,
Part 3: Technical Analysis—Fibonacci Projections And Daily Pivots,” the
author presents a way to automatically draw support & resistance levels
based on daily pivot points. The code listing presented here contains a ready-to-use
formula, and Figure 5 shows a sample chart automatically generated by the formula.
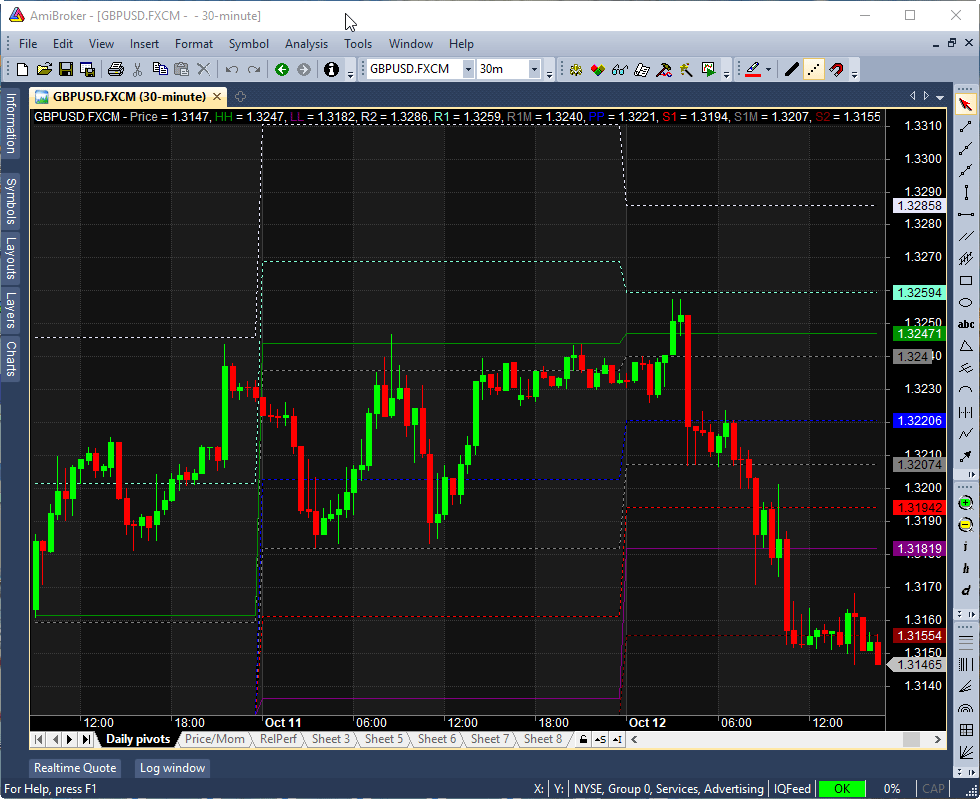
FIGURE 5: AMIBROKER. This sample
30-minute GBPUSD chart shows the daily SVE pivots in action.
Plot( C, "Price", colorDefault, styleCandle );

// get previous day price (from daily interval)
pc = TimeFrameGetPrice( "C", inDaily, -1 );
ph = TimeFrameGetPrice( "H", inDaily, -1 );
pl = TimeFrameGetPrice( "L", inDaily, -1 );

// pivot point
pp = (ph + pl + pc )/3;

// SVE pivot levels
r1 = pp * 2 - pl;
s1 = pp * 2 - ph;
r2 = pp + ( ph - pl );
s2 = pp - ( ph - pl );
r3 = pp * 2 + ( ph - pl );
s3 = pp * 2 - ( ph - pl );

rm1 = ( r1 - pp )/2 + pp;
sm1 = ( pp - s1 )/2 + s1;
rm2 = ( r2 - r1 )/2 + r1;
sm2 = ( s1 - s2 )/2 + s2;
rm3 = ( r3 - r2 )/2 + r2;
sm3 = ( s2 - s3 )/2 + s3;

Plot( ph, "HH", colorGreen );
Plot( pl, "LL", colorViolet );
Plot( r2, "R2", colorLavender, styleDashed );
Plot( r1, "R1", colorAqua, styleDashed );
Plot( rm1, "R1M", colorGrey50, styleDashed );
Plot( pp, "PP", colorBlue, styleDashed );
Plot( s1, "S1", colorRed, styleDashed );
Plot( sm1, "S1M", colorGrey50, styleDashed );
Plot( s2, "S2", colorDarkRed, styleDashed );
—Tomasz Janeczko, AmiBroker.com
www.amibroker.com
BACK TO LIST

NEUROSHELL TRADER: DECEMBER 2018
Fibonacci projections and daily pivot points, which were topics in Sylvain
Vervoort’s May 2018 article in S&C, “The V-Trade, Part 3: Technical
Analysis—Fibonacci Projections And Daily Pivots,” can be easily
determined in NeuroShell Trader using the following methods:
- The Turning Points add-on for NeuroShell Trader, which
finds local peaks and valleys in a price series and allows implementation
of price swings and Fibonacci projections into automated trading systems.
Among other things, the turning points indicator computes support & resistance
lines from prior price swings, Fibonacci retracement lines from each price
swing, and the probability that the current price level is at a new turning
point based on statistical measures.
- Draw Fibonacci retracement, Fibonacci projection, and even Fibonacci time
lines on the chart using NeuroShell Trader’s built-in drawing tools.
- Create daily pivot and in-between indicators using a few of NeuroShell
Trader’s 800+ indicators. Simply select new indicator from
the insert menu and use the indicator wizard to create the following
indicators:
Pivot Point PP:	Avg3(DayHigh(High,1), DayLow(Low,1), DayClose(Close,1))
Resistance R1: 	Subtract(Add2(PP, PP), DayLow(Low,1))
Resistance R2: 	Add2(PP, DayRange(High,Low1))
Resistance R3: 	Add2(R1, DayRange(High,Low1))
Support S1: 	Subtract(Add2(PP, PP), DayHigh(High,1))
Support S2: 	Subtract(PP, DayRange(High,Low1))
Support S3: 	Subtract(S1, DayRange(High,Low1))

Resistance Mean value 1:	Avg2( R1, PP )
Support Mean value 1:		Avg2( PP, S1 )
Resistance Mean value 2:	Avg2( R2, R1 )
Support Mean value 2:		Avg2( S1, S2 )
Resistance Mean value 3:	Avg2( R3, R2 )
Support Mean value 3:		Avg2( S2, S3 )

Previous day's low:		DayLow(Low,1)
Previous day's high:		DayHigh(High,1)
Users of NeuroShell Trader can go to the Stocks & Commodities section
of the NeuroShell Trader free technical support website to download a copy
of this or any previous Traders’ Tips.
A sample chart is shown in Figure 6.

FIGURE 6: NEUROSHELL TRADER. This
NeuroShell Trader chart displays a few of the Turning Point Add-on indicators,
including automated Fibonnaci retracements and peak/valley probability indicators,
both of which can be incorporated into automated trading systems and trading
rules.
—Marge Sherald, Ward Systems Group, Inc.
301 662-7950, sales@wardsystems.com
www.neuroshell.com
BACK TO LIST

AIQ: DECEMBER 2018
The AIQ code based on Sylvain Vervoort’s article in the May 2018 issue, “The
V-Trade, Part 3: Technical Analysis—Fibonacci Projections And Daily Pivots,” can
be obtained on request via email to info@TradersEdgeSystems.com.
The code is also shown here:
! THE V-TRADE
! Author: Sylvain Vervoort, TASC May 2018
! Note: for Traders Tips in Dec 2018
! Coded by: Richard Denning, 10/17/2018
! www.TradersEdgeSystem.com

!ABBREVIATIONS:
  O	is [open].
  O1	is valresult(O,1).
  L 	is [low].
  L1 	is valresult(L,1).
  H 	is [high].
  H1 	is valresult(H,1).
  C 	is [close].
  C1 	is valresult(C,1).

!USE THE FOLLOWING TO GET THE SUPPORT &
! RESISTENCE LEVELS FOR NEXT DAY'S DAY TRADING:
  PP 	is (H1+L1+C1)/3.
  R1 	is PP*2 - L1.
  S1 	is PP*2 - H1.
  R2 	is PP + (H1-L1).
  S2 	is PP - (H1-L1).
  R3 	is PP*2 + (H1-L1*2).
  S3 	is PP*2 - (H1*2 - L1).

!HERE ARE THE INBETWEEN LEVELS PER THE AUTHOR:
  RM1 	is (R1-PP)/2 + PP.
  SM1 	is (PP-S1)/2 + S1.
  RM2 	is (R2-R1)/2 + R1.
  SM2 	is (S1-S2)/2 + S2.
  RM3 	is (R3-R2)/2 + R2.
  SM3 	is (S2-S3)/2 + S3.
  PDL 	is L1.
  PDH 	is H1.

Show_S_R 	if 1.
ShowInBetween 	if 1.
The AIQ EDS file containing the code generates two reports. One shows the
various support & resistance (S&R) levels, while the other report shows
the in-between levels. The main S&R levels for the next day’s daytrading
are shown in Figure 7 and the in-between level report is shown in Figure 8.

FIGURE 7: AIQ. This report shows
the main support & resistance (S&R) levels for the next day’s
daytrading.

FIGURE 8: AIQ. This report shows
the in-between levels for the next day’s daytrading.
—Richard Denning
info@TradersEdgeSystems.com
for AIQ Systems
BACK TO LIST

TRADERSSTUDIO: DECEMBER 2018
The TradersStudio code file for Sylvain Vervoort’s May 2018 STOCKS & COMMODITIES
article, “The V-Trade, Part 3: Technical Analysis—Fibonacci Projections
And Daily Pivots,” can be obtained on request via email to info@TradersEdgeSystems.com.
The code is also shown here:
' THE V-TRADE
' Author: Sylvain Vervoort, TASC May 2018
' Note: for Traders Tips in Dec 2018
' Coded by: Richard Denning, 10/17/2018
' www.TradersEdgeSystem.com

Sub PIVOTS()
Dim PriceH As BarArray
Dim PriceL As BarArray
Dim PriceC As BarArray

Dim PP,R1,S1,R2,S2,R3,S3

PriceH = H Of independent1
PriceL = L Of independent1
PriceC = C Of independent1

'USE THE FOLLOWING To GET THE SUPPORT &
' RESISTENCE LEVELS For Next Day'S Day TRADING:

  PP    = (PriceH[1]+PriceL[1]+PriceC[1])/3
  R1    = PP*2 - PriceL[1]
  S1    = PP*2 - PriceH[1]
  R2    = PP + (PriceH[1]-PriceL[1])
  S2    = PP - (PriceH[1]-PriceL[1])
  R3    = PP*2 + (PriceH[1]-PriceL[1]*2)
  S3    = PP*2 - (PriceH[1]*2 - PriceL[1])
  If Date <> Date[1] Then
  Print FormatDateTime(Date)," PP ",round(PP,2)," R1 ",round(R1,2)," S1 ",round(S1,2)," R2 ",round(R2,2)," S2 ",round(S2,2)," R3 ",round(R3,2)," S3 ",round(S3,2)
  end if
End Sub
The code file generates a terminal report that shows the various main support & resistance
(S&R) levels. The main S&R levels for same day’s daytrading are
shown in Figure 9.

FIGURE 9: TRADERSSTUDIO. This report
shows the main support & resistance (S&R) levels for the same day’s
daytrading.
—Richard Denning
info@TradersEdgeSystems.com
for TradersStudio
BACK TO LIST

NINJATRADER: DECEMBER 2018
The NTSvePivots indicator, as discussed in the May 2018 article by Sylvain
Vervoort titled “The V-Trade, Part 3: Technical Analysis—Fibonacci
Projections And Daily Pivots,” is available for download at the following
links for NinjaTrader 8 and for NinjaTrader 7:
Once you have downloaded the file, you can import the indicator into NinjaTader
8 from within the control center by selecting Tools → Import → NinjaScript
Add-On and then selecting the downloaded file for NinjaTrader 8. To import
into NinjaTrader 7, from within the control center window, select the menu
File → Utilities → Import NinjaScript and select the downloaded file.
You can review the indicator’s source code in NinjaTrader 8 by selecting
the menu New → NinjaScript Editor → Indicators from within the control
center window and selecting the NTSvePivots file. You can review the indicator’s
source code in NinjaTrader 7 by selecting the menu Tools → Edit NinjaScript → Indicator
from within the control center window and selecting the NTSvePivots file.
NinjaScript uses compiled DLLs that run native, not interpreted, which provides
you with the highest performance possible.
A sample chart implementing the indicator is shown in Figure 10.

FIGURE 10: NINJATRADER. In this
sample NinjaTrader chart, the NTSvePivots indicator is showing usable pivots
for October 19, 2016 and for October 20, 2016 on GBPUSD.
—Raymond Deux & Jim Dooms
NinjaTrader, LLC
www.ninjatrader.com
BACK TO LIST

QUANTACULA: DECEMBER 2018
In his May 2018 article in STOCKS & COMMODITIES, “The V-Trade, Part
3: Technical Analysis—Fibonacci Projections And Daily Pivots,” author
Sylvain Vervoort calculates a plethora of pivot point levels for intraday charts.
In Quantacula Studio, you can calculate and plot levels like this all in the Initialize method.
Quantacula’s framework contains two helpers that make working with multiple
timeframes easier. These two objects do the “heavy lifting” and
are summarized below:
- The BarHistoryCompressor compresses the incoming intraday history into
a daily history. Once the daily history is obtained, we calculate all the
pivot points based on the daily data.
- The TimeSeriesSynchronizer then takes these daily time series data and
synchronizes them back up with the intraday chart so that we can plot them.
By using the helper classes, we can avoid much of the code and focus on calculating
the pivot levels. We used the free AlphaVantage extension
for Quantacula Studio to get the intraday data for this test. You can download
this extension from the www.quantacula.com website under the purchase/extensions menu
item.
public override void Initialize(BarHistory bars)
{
    //convert time series data to daily
    BarHistory daily = BarHistoryCompressor.ToDaily(bars);

    //calculate pivots
    TimeSeries pp = (daily.High + daily.Low + daily.Close) / 3;
    TimeSeries r1 = pp * 2 - daily.Low;
    TimeSeries s1 = pp * 2 - daily.High;
    TimeSeries r2 = pp + (daily.High - daily.Low);
    TimeSeries s2 = pp - (daily.High - daily.Low);
    TimeSeries r3 = pp * 2 + (daily.High - daily.Low * 2);
    TimeSeries s3 = pp * 2 - (daily.High * 2 - daily.Low);

    //calculate in-between levels
    TimeSeries rmv1 = (r1 - pp) / 2 + pp;
    TimeSeries smv1 = (pp - s1) / 2 + s1;
    TimeSeries rmv2 = (r2 - r1) / 2 + r1;
    TimeSeries smv2 = (s1 - s2) / 2 + s2;
    TimeSeries rmv3 = (r3 - r2) / 2 + r2;
    TimeSeries smv3 = (s2 - s3) / 2 + s3;
    TimeSeries pl = daily.Low;
    TimeSeries ph = daily.High;

    //synchronize the daily TimeSeries with the intraday chart
    pp = TimeSeriesSynhronizer.Synchronize(pp, bars);
    r1 = TimeSeriesSynhronizer.Synchronize(r1, bars);
    s1 = TimeSeriesSynhronizer.Synchronize(s1, bars);
    r2 = TimeSeriesSynhronizer.Synchronize(r2, bars);
    s2 = TimeSeriesSynhronizer.Synchronize(s2, bars);
    r3 = TimeSeriesSynhronizer.Synchronize(r3, bars);
    s3 = TimeSeriesSynhronizer.Synchronize(s3, bars);
    rmv1 = TimeSeriesSynhronizer.Synchronize(rmv1, bars);
    smv1 = TimeSeriesSynhronizer.Synchronize(smv1, bars);
    rmv2 = TimeSeriesSynhronizer.Synchronize(rmv2, bars);
    smv2 = TimeSeriesSynhronizer.Synchronize(smv2, bars);
    rmv3 = TimeSeriesSynhronizer.Synchronize(rmv3, bars);
    smv3 = TimeSeriesSynhronizer.Synchronize(smv3, bars);
    pl = TimeSeriesSynhronizer.Synchronize(pl, bars);
    ph = TimeSeriesSynhronizer.Synchronize(ph, bars);

    //plot them all
    Plot(pp, "PP", Color.Blue, PlotStyles.Line, "Price");
    Plot(r1, "R1", Color.Red, PlotStyles.Line, "Price");
    Plot(s1, "S1", Color.SkyBlue, PlotStyles.Line, "Price");
    Plot(r2, "R2", Color.Coral, PlotStyles.Line, "Price");
    Plot(s2, "S2", Color.Aqua, PlotStyles.Line, "Price");
    Plot(r3, "R3", Color.Pink, PlotStyles.Line, "Price");
    Plot(rmv1, "RMV1", Color.Blue, PlotStyles.DottedLine, "Price");
    Plot(smv1, "SMV1", Color.Red, PlotStyles.DottedLine, "Price");
    Plot(rmv2, "RMV2", Color.SkyBlue, PlotStyles.DottedLine, "Price");
    Plot(smv2, "SMV2", Color.Coral, PlotStyles.DottedLine, "Price");
    Plot(rmv3, "RMV3", Color.Aqua, PlotStyles.DottedLine, "Price");
    Plot(smv3, "SMV3", Color.Pink, PlotStyles.DottedLine, "Price");
    Plot(pl, "PL", Color.Silver, PlotStyles.ThickLine, "Price");
    Plot(ph, "PH", Color.Silver, PlotStyles.ThickLine, "Price");
}
Figure 11 is a Quantacula Studio chart that plots the pivot levels on a five-minute
chart of Microsoft.
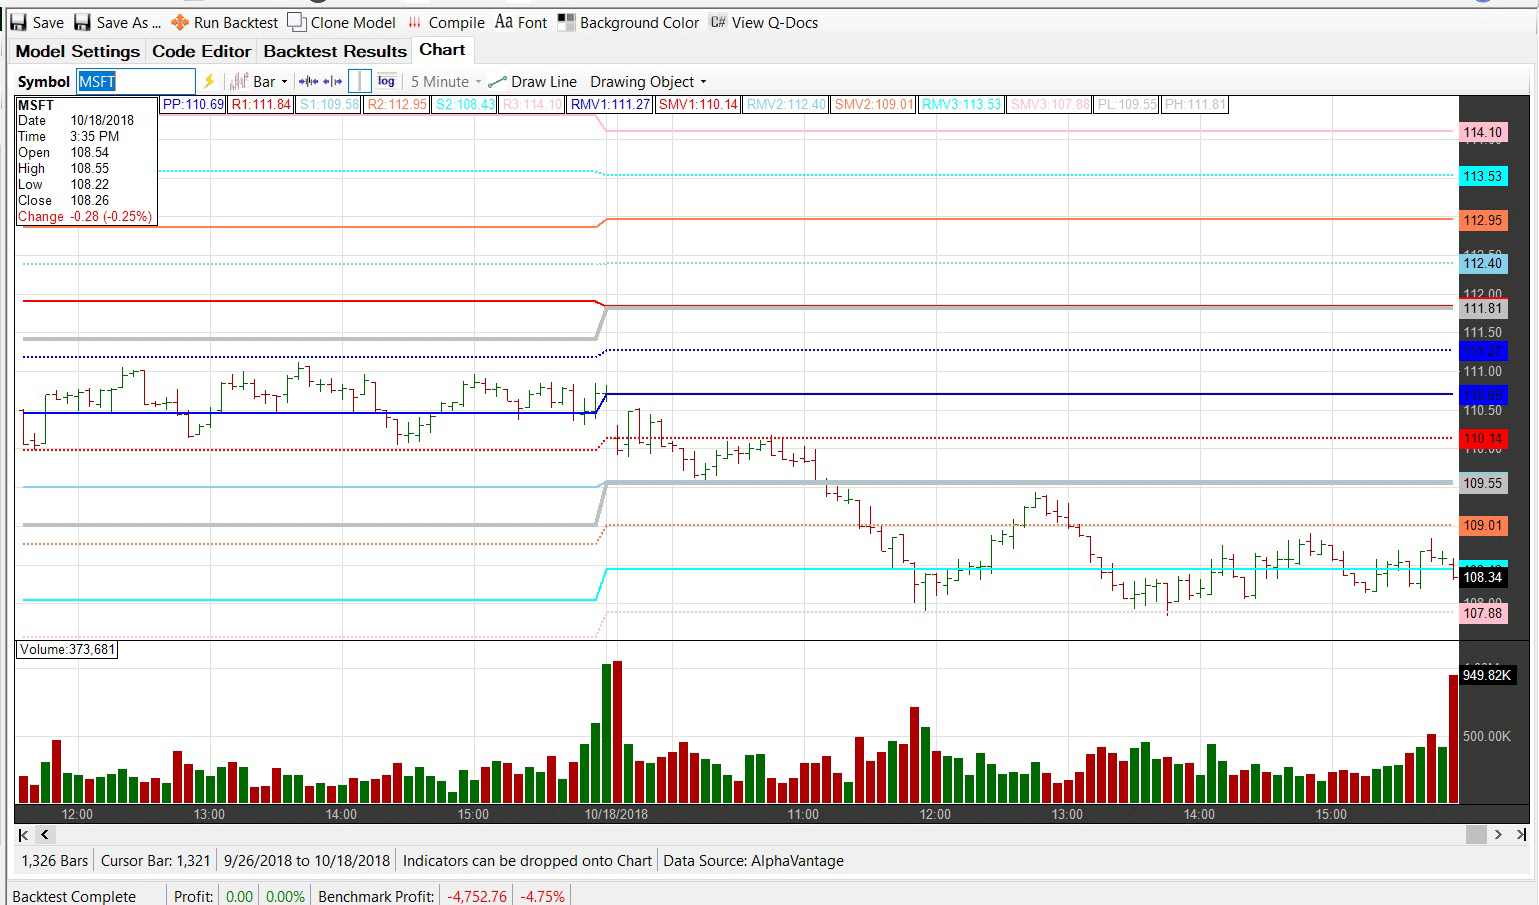
FIGURE 11: QUANTACULA STUDIO. This
sample chart in Quantacula Studio plots the pivot levels on a five-minute
chart of Microsoft.
—Dion Kurczek, Quantacula LLC
info@quantacula.com
www.quantacula.com
BACK TO LIST

TRADE NAVIGATOR: DECEMBER 2018
We’re making available a file for download within the Trade Navigator
library to make it easy for users to implement the indicator discussed in Sylvain
Vervoort’s May 2018 article in STOCKS & COMMODITIES, “The V-Trade,
Part 3: Technical Analysis—Fibonacci Projections And Daily Pivots.” The
filename is “SC201812.”
To download it, click on Trade Navigator’s file dropdown menu,
then select update data. Next, select download special file,
then and replace the word “upgrade” with “SC201812” (without
the quotes). Then click the start button. When prompted to upgrade,
click the yes button. If prompted to close all software, click on
the continue button. Your library will now download.
This library contains a template named “SC The VTrade” plus the
following indicators: Sve_PP, Sve_R1, Sve_R2, Sve_R3, Sve_S1, Sve_S2, Sve_S3,
Sve_R1M, Sve_R2M, Sve_R3M, Sve_S1M, Sve_S2M, Sve_S3M, Sve_PH, and Sve_PL.
The template allows you to modify your chart with a prebuilt indicator package
and settings. To use it, open the charting pulldown menu, select the templates command,
then on the sub-menu that opens, select the “SC The VTrade” template.
If you are prompted to “save the current chart settings as template?” your
answer will depend on whether you have made any changes to your current chart
template that you would like to keep. If you choose no, changes will
be discarded while a yes choice will save your changes to the prior
template on your chart before switching to the “SC The VTrade” template.
Adding indicators to your chart
You can insert these indicators individually onto your chart by opening the charting dropdown
menu, selecting the add to chart command, then on the indicators tab,
finding your named indicator, selecting it, and clicking on the add button.
You can repeat this procedure for additional indicators.
Users may contact our technical support staff by phone or by live chat (click
on the live chat tool near the top of the page at www.TradeNavigator.com or
via Trade Navigator’s help menu) if any assistance is needed.
A sample chart implementing the template is shown in Figure 12.
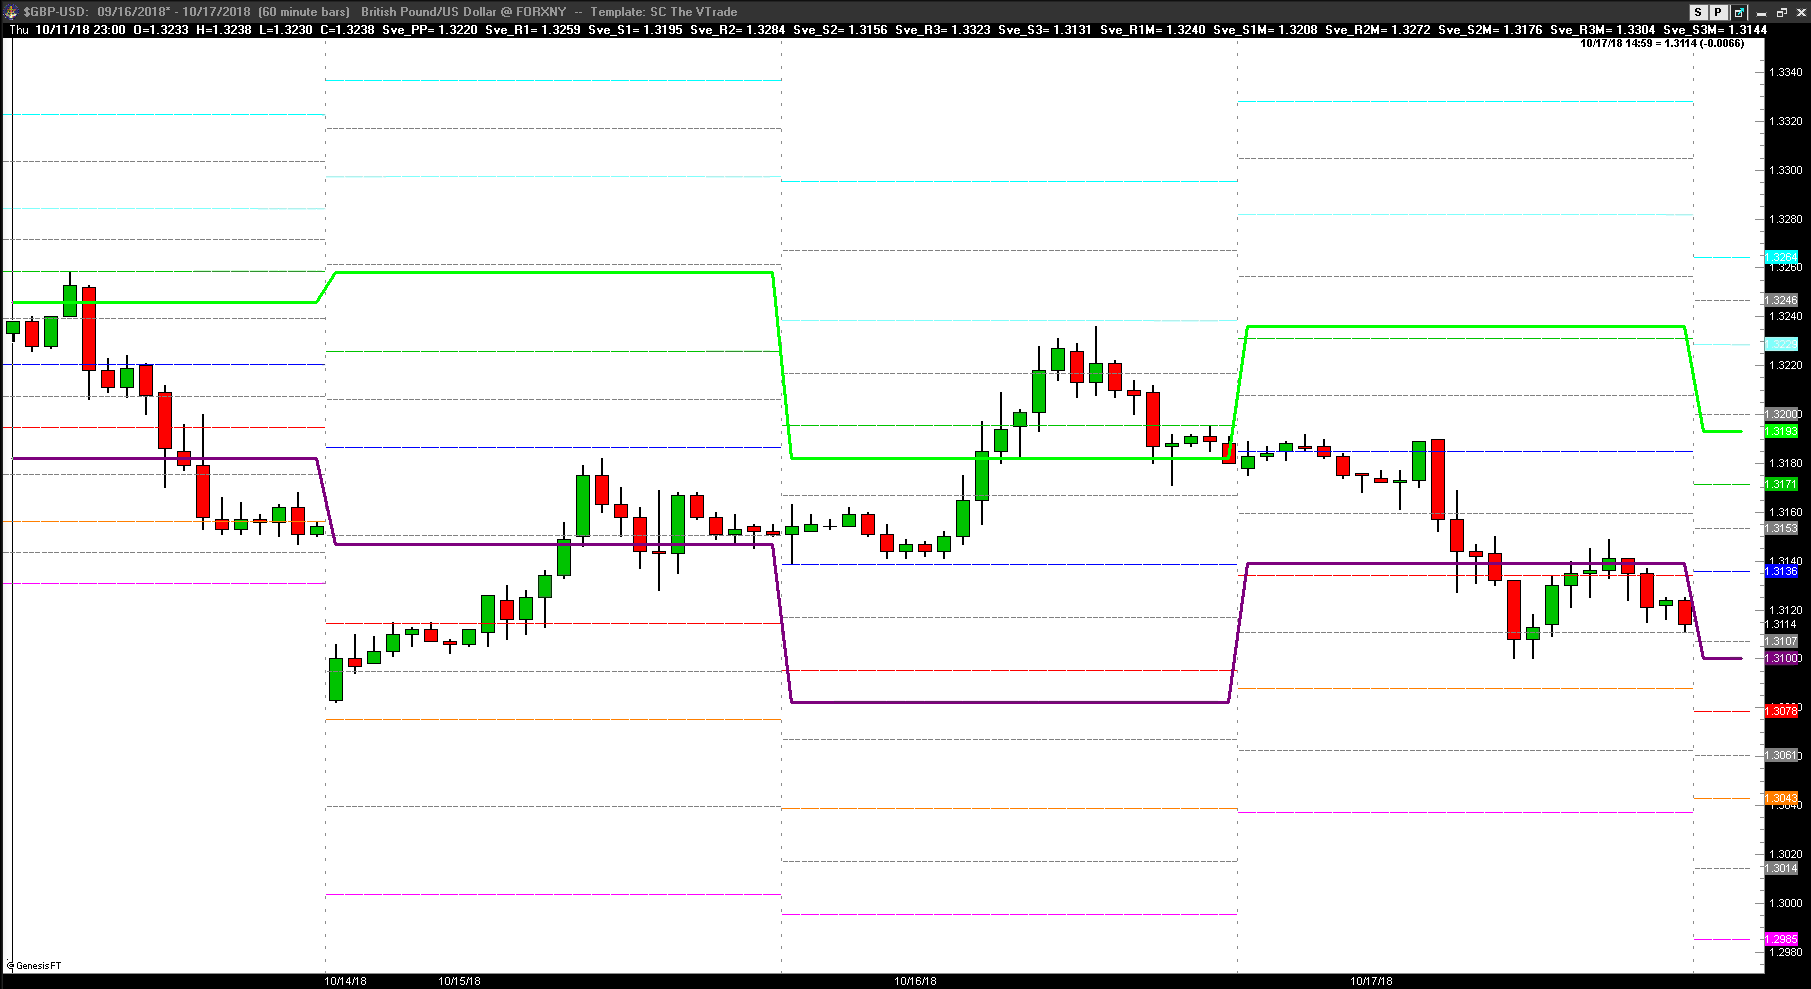
FIGURE 12: TRADE NAVIGATOR. This
sample chart implements the template to display the indicator.
—Genesis Financial Technologies
Tech support 719 884-0245
www.TradeNavigator.com
BACK TO LIST

QUANTCONNECT: DECEMBER 2018
The team at QuantConnect has developed an algorithm using the “SvePivots” indicator described in Sylvain Vervoort’s May 2018 article in STOCKS & COMMODITIES, “The V-Trade,
Part 3: Technical Analysis—Fibonacci Projections And Daily Pivots.” You can see the backtest and code at this link:
https://www.quantconnect.com/terminal/processCache/?request=embedded_backtest_0173e7a7af8e49717287f4e21c20e4f0.html
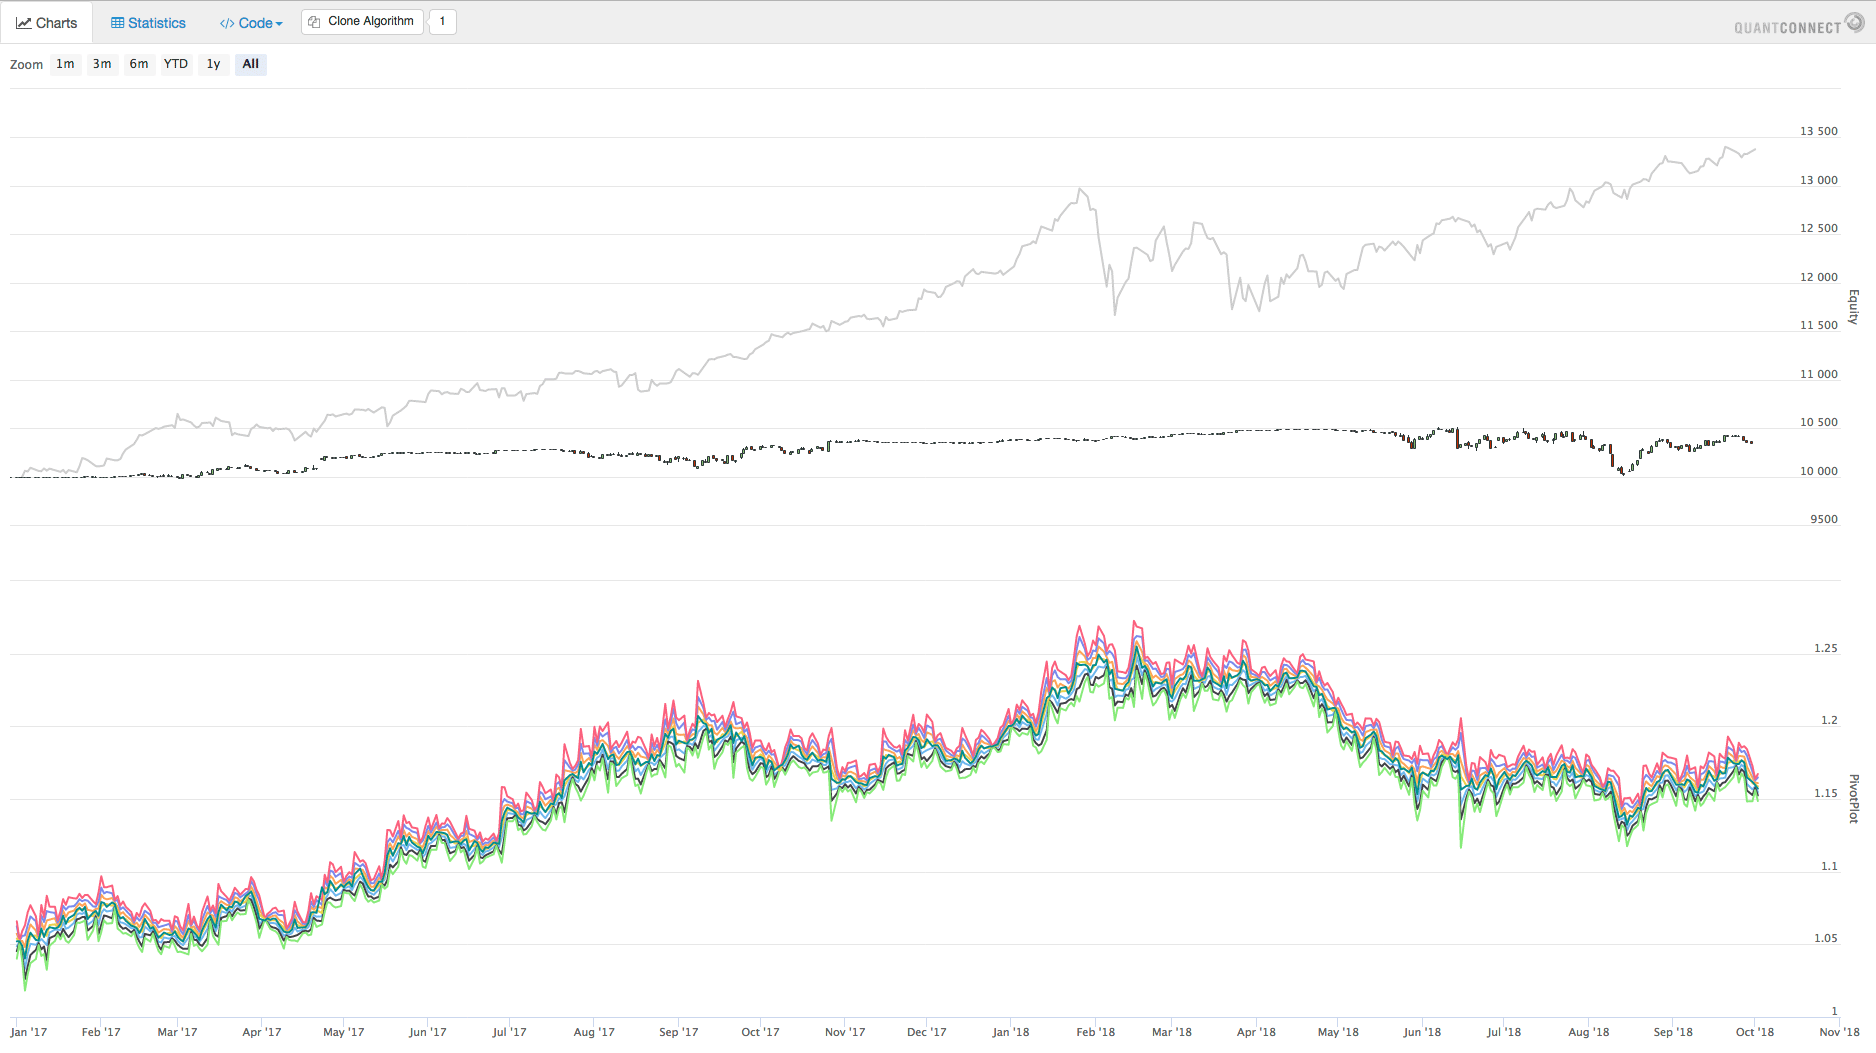
FIGURE 13: QUANTCONNECT CHART
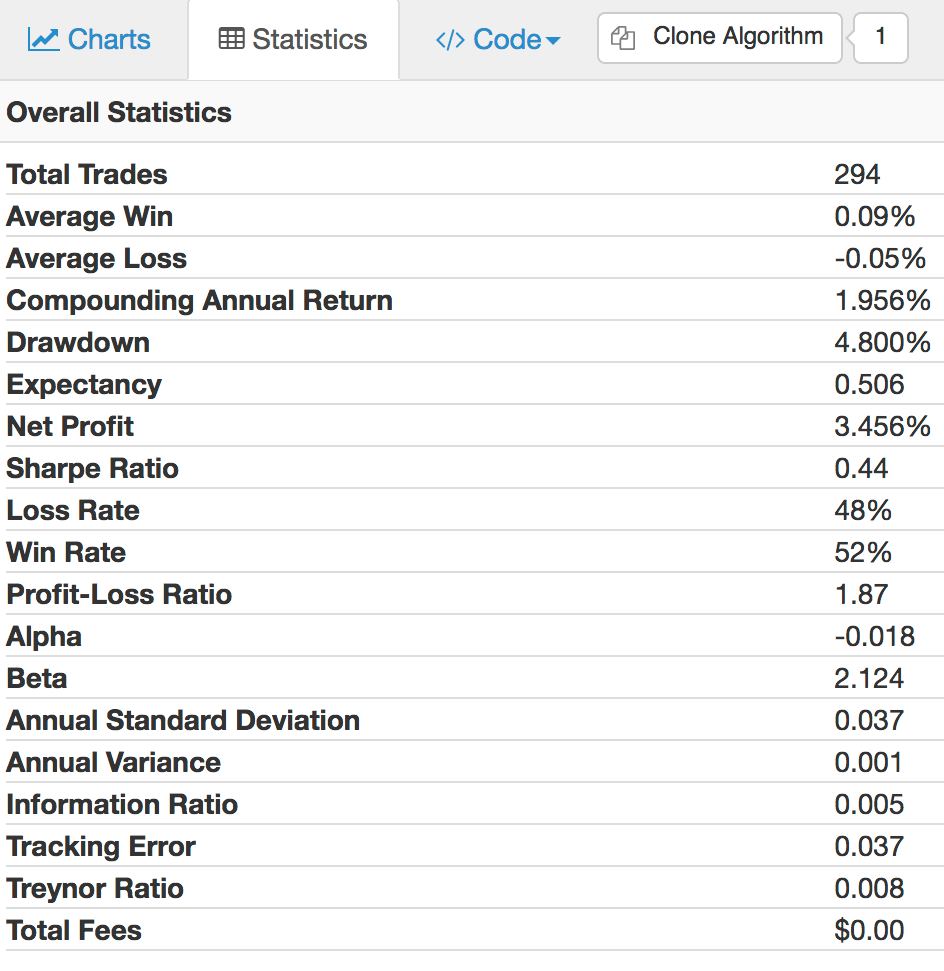
FIGURE 14: QUANTCONNECT RESULT TABLE
—https://www.quantconnect.com
BACK TO LIST

THINKORSWIM: DECEMBER 2018
We have improved the SVEPivot points study in thinkorswim to better align with the methods discussed in Sylvain Vervoot’s May 2018 STOCKS & COMMODITIES article, “The V-Trade, Part 3: Technical Analysis—Fibonacci Projections And Daily Pivots.”
The study is included as part of the available studies within thinkorswim. To add this to your chart, simply navigate to the studies menu on the charts tab, then select add study. You can either scroll down to the study and select it, or select edit studies and then search for SVEPivots and select add selected. Alternatively, you can load the study by simply clicking on https://tos.mx/uh0djM or enter this URL into a web browser and click open shared item from within thinkorswim. Choose view thinkscript and name it “SVEPivotnew.”
The newly enhanced study adds to the original by including six plots at in-between levels and the previous day’s high and low plots. Something of note is that unlike in some other platforms, there is no need to do any manual tuning of the study to work with specific instruments. The chart in Figure 15 shows the study added to a two-day, 30-minute chart of the forex pair GBP/USD. See Sylvain Vervoot’s article in the May 2018 issue for more information on how to use this study.

FIGURE 15: THINKORSWIM. Here, the study has been added to a two-day, 30-minute chart of the forex pair GBP/USD.
—thinkorswim
A division of TD Ameritrade, Inc.
www.thinkorswim.com
BACK TO LIST
Originally published in the December 2018 issue of
Technical Analysis of STOCKS & COMMODITIES magazine.
All rights reserved. © Copyright 2018, Technical Analysis, Inc.


