TRADERS’ TIPS
February 2019

For this month’s Traders’ Tips, the focus is Sylvain Vervoort’s
article in the August 2018 issue, “The
V-Trade, Part 6: Technical Analysis—Divergence Indicators.” Here,
we present the February 2019 Traders’ Tips code with possible implementations
in various software.
You can right-click on any chart to open it in a new tab or window
and view it at it’s originally supplied size, often much larger than
the version printed in the magazine.
The Traders’ Tips section is provided to help the reader implement
a selected technique from an article in this issue or another recent issue.
The entries here are contributed by software developers or programmers for
software that is capable of customization.

TRADESTATION: FEBRUARY 2019
In “The V-Trade, Part 6: Technical Analysis—Divergence Indicators” in the
August 2018 issue of STOCKS & COMMODITIES, author Sylvain Vervoort introduces
a modified version of the stochastic RSI, an indicator that was first introduced
by Tushar Chande and Stanley Kroll. That indicator applies a stochastic calculation
to an RSI value rather than a simple value, and Vervoort’s update provides
additional smoothing. Vervoort uses his new indicator primarily in the analysis
of divergence.
We have provided a function that can be used in your own EasyLanguage code
as well as an example indicator. The TradeStation EasyLanguage code for the
SVE stochastic function and the demonstration indicator based on the author’s
work are presented here.
Indicator: SVE Stochastic RSI
// SVE Stochastic RSI
// TASC Feb 2019
// Sylvain Vervoort

inputs:
	RSILength( 13 ),
	StochLength( 5 ),
	StochAvgLength( 8 ),
	OverBought( 80 ),
	OverSold( 20 ) ;

variables:
	SVEStochVal( 0 ) ;


SVEStochVal = SVEStochRSI(
	RSILength, StochLength, StochAvgLength ) ;

Plot1( SVEStochVal, "StochRSI" ) ;
Plot2( OverBought, "OB" ) ;
Plot3( OverSold, "OS" ) ;


Function: SVEStochRSI

// Stochastic RSI Function
// TASC Feb 2019
// Sylvain Vervoort

inputs:
	RSIPeriod( numericsimple ),
	StochLookBack( numericsimple ),
	StochAverage( numericsimple ) ;

variables:
	RSIValue( 0 ),
	RSIHighest( 0 ),
	RSILowest( 0 ),
	RSILow( 0 ),
	HiLow( 0 ),
	AvgRSILow( 0 ),
	AvgHiLow( 0 ) ;

RSIValue = RSI( Close, RSIPeriod ) ;
RSILowest = Lowest( RSIValue, StochLookBack ) ;
RSIHighest = Highest( RSIValue, StochLookBack ) ;
RSILow = RSIValue - RSILowest ;
HiLow = RSIHighest -RSILowest ;
AvgRSILow = Average( RSILow, StochAverage ) ;
AvgHiLow = Average( HiLow, StochAverage ) ;

SVEStochRSI =
	AvgRSILow / ( 0.1 + AvgHiLow ) * 100 ;
To download the EasyLanguage code, please visit our TradeStation and EasyLanguage
support forum. The files for this article can be found here: https://community.tradestation.com/Discussions/Topic.aspx?Topic_ID=156727.
The filename is “TASC_FEB2019.ZIP.”
For more information about EasyLanguage in general, please see https://www.tradestation.com/EL-FAQ.
A sample chart is shown in Figure 1.

FIGURE 1: TRADESTATION. This demonstrates
a TradeStation 60-minite chart of the USDJPY forex pair showing the SVE stochastic
RSI indicator.
This article is for informational purposes. No type of trading or investment
recommendation, advice, or strategy is being made, given, or in any manner
provided by TradeStation Securities or its affiliates.
—Doug McCrary
TradeStation Securities, Inc.
www.TradeStation.com
BACK TO LIST

THINKORSWIM: FEBRUARY 2019
We have put together a stochastic RSI indicator for thinkorswim based on the
article titled “The V-Trade, Part 6: Technical Analysis—Divergence Indicators”
by Sylvain Vervoort in the August 2018 issue of STOCKS & COMMODITIES.
We built the study and strategy referenced by using our proprietary scripting
language, thinkScript. To ease the loading process, simply click on https://tos.mx/Fl75Lg then
choose view thinkScript study and name it “SVEStochRSI.” This can
then be added to your chart from the edit study and strategies menu
within thinkorswim.

FIGURE 2: THINKORSWIM. The study
can be seen on a “bid” chart of the GBP/USD forex pair.
In Figure 2, the study can be seen on a “bid” chart of the GBP/USD forex pair
set to one day/15 minutes. See Sylvain Vervoot’s article in the August 2018
S&C for more details on how to interpret the study.
—thinkorswim
A division of TD Ameritrade, Inc.
www.thinkorswim.com
BACK TO LIST

WEALTH-LAB: FEBRUARY 2019
The SVEStochRSI indicator introduced by Sylvain Vervoort in his August 2018
article in STOCKS & COMMODITIES, “The V-Trade, Part 6: Technical Analysis—Divergence
Indicators,” is a price oscillator similar to StochRSI in its application and
interpretation.
Oscillating between zero and 100, it becomes overbought after reaching 80
and oversold after dropping below 20. In his article, the author highlights
its usage as a tool for confirming price reversals based on divergences between
price and indicator.
The example WealthScript code presented here can also be downloaded straight
from Wealth-Lab (use the menu open strategy, then download)
and includes a simple shorting strategy that triggers an entry when the a)
SVEStochRSI crosses under 70, and, b) price negatively diverges with the SVEStochRSI.
The divergence-detection routine focuses on the two indicator peaks just prior
to the crossunder. The code compares the relative price peaks corresponding
to the SVEStochRSI peak bars, and, if a negative divergence is detected, the
strategy draws in the divergence lines and initiates a short position, which
is closed simply with a time-based exit.
A sample chart is shown in Figure 3.

FIGURE 3: WEALTH-LAB. This Wealth-Lab
chart shows some example trades on the QQQ.
After updating the TASCIndicators library to its latest version, the SVEStochRSI
indicator can be found under the “TASC Magazine Indicators” group. Please install
(or update if you haven’t done so already) the library from our Wealth-lab.com site
to its latest version. Then you can plot it on a chart or use it as an entry
or exit condition in a rule-based strategy without having to program a single
line of code yourself.
Wealth-Lab strategy code (C#):

using System;
using System.Collections.Generic;
using System.Text;
using System.Drawing;
using WealthLab;
using WealthLab.Indicators;
using TASCIndicators;

namespace WealthLab.Strategies
{
	public class SVEStochRSIDivergence : WealthScript
	{
		StrategyParameter rsiPeriod;
		StrategyParameter stoPeriod;
		StrategyParameter smaPeriod;

		public SVEStochRSIDivergence()
		{
			rsiPeriod = CreateParameter("SVEStochRSI Period", 21, 2, 200, 20);
			stoPeriod = CreateParameter("Stochastic Period", 8, 2, 200, 20);
			smaPeriod = CreateParameter("SVEStochRSI Period", 5, 2, 200, 20);
		}

		protected override void Execute()
		{
			HideVolume();
			DataSeries srsi = SVEStochRSI.Series(Close, rsiPeriod.ValueInt, stoPeriod.ValueInt, smaPeriod.ValueInt);
			ChartPane rsiPane = CreatePane( 40, true, true);
			PlotSeries( rsiPane, srsi, Color.Red, LineStyle.Solid, 2);

			for (int bar = 3 * GetTradingLoopStartBar( srsi.FirstValidValue ) ; bar < Bars.Count; bar++)
			{
				if (IsLastPositionActive)
				{
					Position p = LastPosition;
					if (bar + 1 - p.EntryBar > 6)
						ExitAtMarket( bar + 1, p, "Time-based");
				}
				else if (CrossUnder(bar, srsi, 70))
				{
					// check the last two SVEStochRSI peaks for negative divergence with price
					int pb1 = (int)PeakBar.Value(bar, srsi, 20, PeakTroughMode.Value);
					if (pb1 == -1) continue;
					int pb2 = (int)PeakBar.Value(pb1, srsi, 20, PeakTroughMode.Value);
					if (pb2 == -1) continue;
					if ( Math.Sign(srsi[pb1] - srsi[pb2]) == -1 && Math.Sign(High[pb1] - High[pb2]) == 1)
					{
						SetBackgroundColor( bar, Color.FromArgb(50, Color.Green));
						DrawLine( rsiPane, pb2, srsi[pb2], pb1, srsi[pb1], Color.Blue, LineStyle.Solid, 2);
						DrawLine( PricePane, pb2, High[pb2], pb1, High[pb1], Color.Blue, LineStyle.Solid, 2);
						ShortAtMarket( bar + 1);
					}
				}
			}
		}
	}
}
—Gene (Eugene) Geren, Wealth-Lab team
MS123, LLC
www.wealth-lab.com
BACK TO LIST

NINJATRADER: FEBRUARY 2019
The SRSI indicator, as discussed in the August 2018 S&C article titled
“The V-Trade, Part 6: Technical Analysis—Divergence Indicators” by Sylvain
Vervoort, is available for download at the following links for NinjaTrader
8 and NinjaTrader 7:
Once the file is downloaded, you can import the indicator into NinjaTader
8 from within the Control Center by selecting Tools → Import → NinjaScript
Add-On and then selecting the downloaded file for NinjaTrader 8. To import
in NinjaTrader 7 from within the Control Center window, select the menu File → Utilities → Import
NinjaScript and select the downloaded file.
You can review the indicator’s source code in NinjaTrader 8 by selecting the
menu New → NinjaScript Editor → Indicators from within the Control
Center window and selecting the SRSI file. You can review the indicator’s source
code in NinjaTrader 7 by selecting the menu Tools → Edit NinjaScript → Indicator
from within the Control Center window and selecting the SRSI file.
NinjaScript uses compiled DLLs that run native, not interpreted, to provide
the highest performance possible.
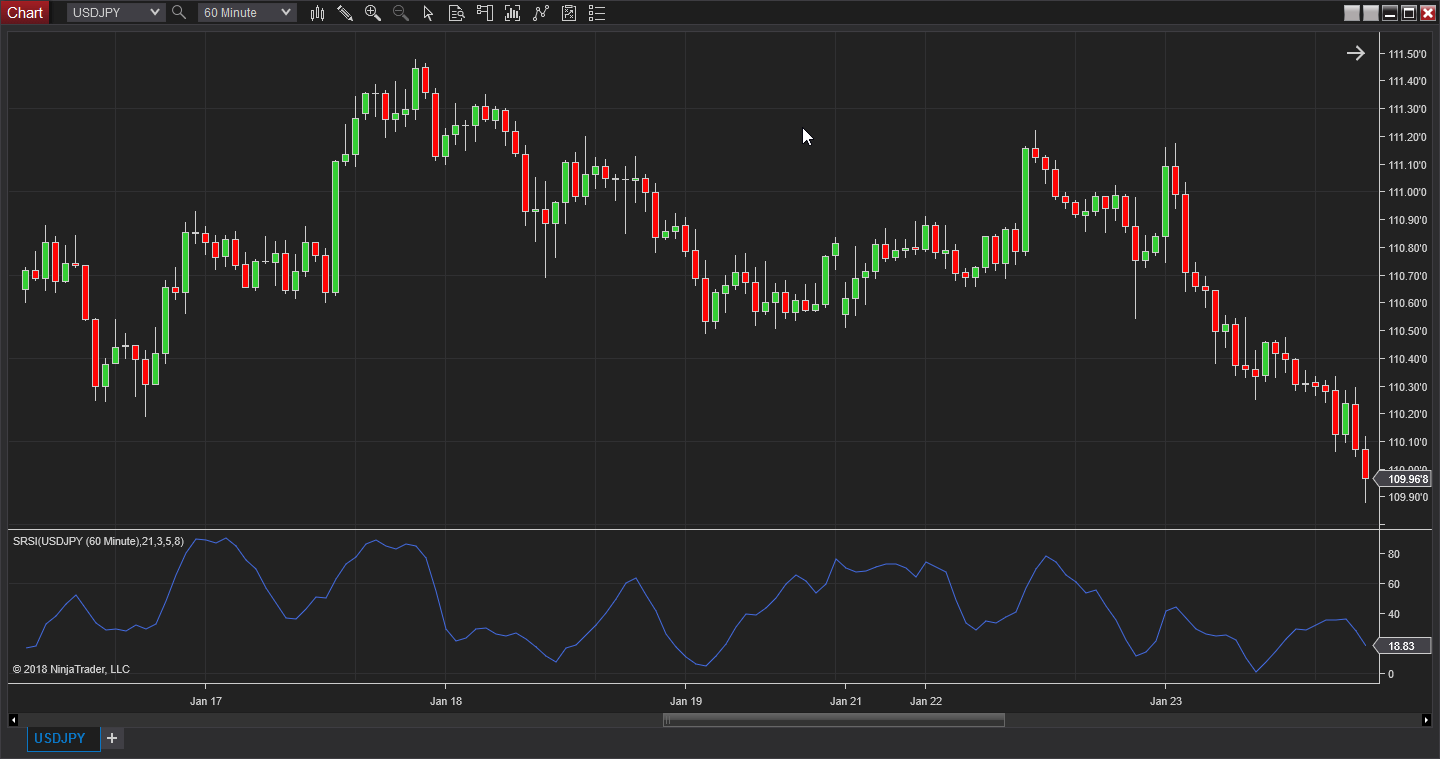
A sample chart implementing the indicator is shown in Figure 4.

FIGURE 4: NINJATRADER. The SRSI
indicator is displayed on a 60-minute USDJPY chart during January 2018.
—Raymond Deux & Jim Dooms
NinjaTrader, LLC
www.ninjatrader.com
BACK TO LIST

NEUROSHELL TRADER: FEBRUARY 2019
The stochastic RSI described by Sylvain Vervoort in his August 2018 STOCKS & COMMODITIES
article “The V-Trade, Part 6: Technical Analysis—Divergence Indicators” can
be easily implemented in NeuroShell Trader by combining two of NeuroShell Trader’s
800+ indicators. To implement the indicators, select new indicator from
the insert menu and use the indicator wizard to set up the following
indicators:
Stoch%D( RSI(Close,21), RSI(Close,21), RSI(Close,21), 5, 8)
Users of NeuroShell Trader can go to the STOCKS & COMMODITIES section
of the NeuroShell Trader free technical support website to download a copy
of this or any previous Traders’ Tips.
A sample chart is shown in Figure 5.

FIGURE 5: NEUROSHELL TRADER. This
sample NeuroShell Trader chart displays the stochastic RSI indicator.
—Marge Sherald, Ward Systems Group, Inc.
301 662-7950, sales@wardsystems.com
www.neuroshell.com
BACK TO LIST

QUANTACULA: FEBRUARY 2019
We have added the SVEStochRSI indicator to Quantacula’s TASC Extensions library,
so it is available to Quantacula.com and Quantacula Studio users. It is based
on the article “The V-Trade, Part 6: Technical Analysis—Divergence Indicators”
by Sylvain Vervoort in the August 2018 issue of STOCKS & COMMODITIES, in
which the author uses the SVEStochRSI to detect divergences with price. We
developed a Quantacula model to identify and plot such divergences by coloring
the background of the chart.
Quantacula source code

using QuantaculaBacktest;
using System;
using QuantaculaCore;
using QuantaculaIndicators;
using System.Drawing;

namespace Quantacula
{
    public class MyModel : UserModelBase
    {
        //create indicators and other objects here, this is executed prior to the main trading loop
        public override void Initialize(BarHistory bars)
        {
            //create and plot SVEStochRSI and zig zag
            sve = new SVEStochRSI(bars.Close, 13, 5, 8);
            Plot(sve);
            zz = new ZigZag(sve, 20, PeakTroughReversalTypes.Point);
            Plot(zz);

            //plot zig zag of highs/lows
            zzHL = new ZigZagHL(bars, 6, PeakTroughReversalTypes.Percent);
            Plot(zzHL);

            //calculate peaks and troughs of SVEStochRSI
            svePT = new PeakTroughCalculator(sve, sve, 20, PeakTroughReversalTypes.Point);

            //calculate peaks/troughs based on highs/lows
            sveHL = new PeakTroughCalculator(bars, 5, PeakTroughReversalTypes.Percent);
        }

        //execute the strategy rules here, this is executed once for each bar in the backtest history
        public override void Execute(BarHistory bars, int idx)
        {
            //look for divergences
            if (svePT.HasRisingTroughs(idx))
            {
                if (sveHL.HasFallingTroughs(idx))
                {
                    PeakTrough t1 = svePT.GetTrough(idx);
                    PeakTrough t2 = sveHL.GetTrough(idx);
                    if (Math.Abs(t1.PeakTroughIndex - t2.PeakTroughIndex) < 10)
                        SetBackgroundColor(idx, bullish);
                }
            }
            else if (svePT.HasFallingPeaks(idx))
            {
                if (sveHL.HasRisingPeaks(idx))
                {
                    PeakTrough p1 = svePT.GetPeak(idx);
                    PeakTrough p2 = sveHL.GetPeak(idx);
                    if (Math.Abs(p1.PeakTroughIndex - p2.PeakTroughIndex) < 10)
                        SetBackgroundColor(idx, bearish);
                }
            }

        }

        //declare private variables below
        IndicatorBase sve;
        IndicatorBase zz, zzHL;
        PeakTroughCalculator svePT;
        PeakTroughCalculator sveHL;
        Color bearish = Color.FromArgb(32, 255, 0, 0);
        Color bullish = Color.FromArgb(32, 0, 128, 0);
    }
}
The Quantacula framework includes a helper object called PeakTroughCalculator,
which makes it easier to work with divergences in C# coded models. You construct
a PeakTroughCalculator by passing it source data (either a pair of TimeSeries
objects or a single BarHistory object). The PeakTroughCalculator analyzes the
source data and returns a list of peaks and troughs based on the reversal amount
and reversal type (percent or point) that you specified.
It also contains several other methods that let you detect whether the data
has rising or falling peaks or troughs at any point in time. This is the basis
for our divergence test. If the SVEStochRSI has rising troughs while the source
data has falling troughs, we consider this a bullish divergence. If the SVEStochRSI
has falling peaks while the source data has rising peaks, it is a bearish divergence.
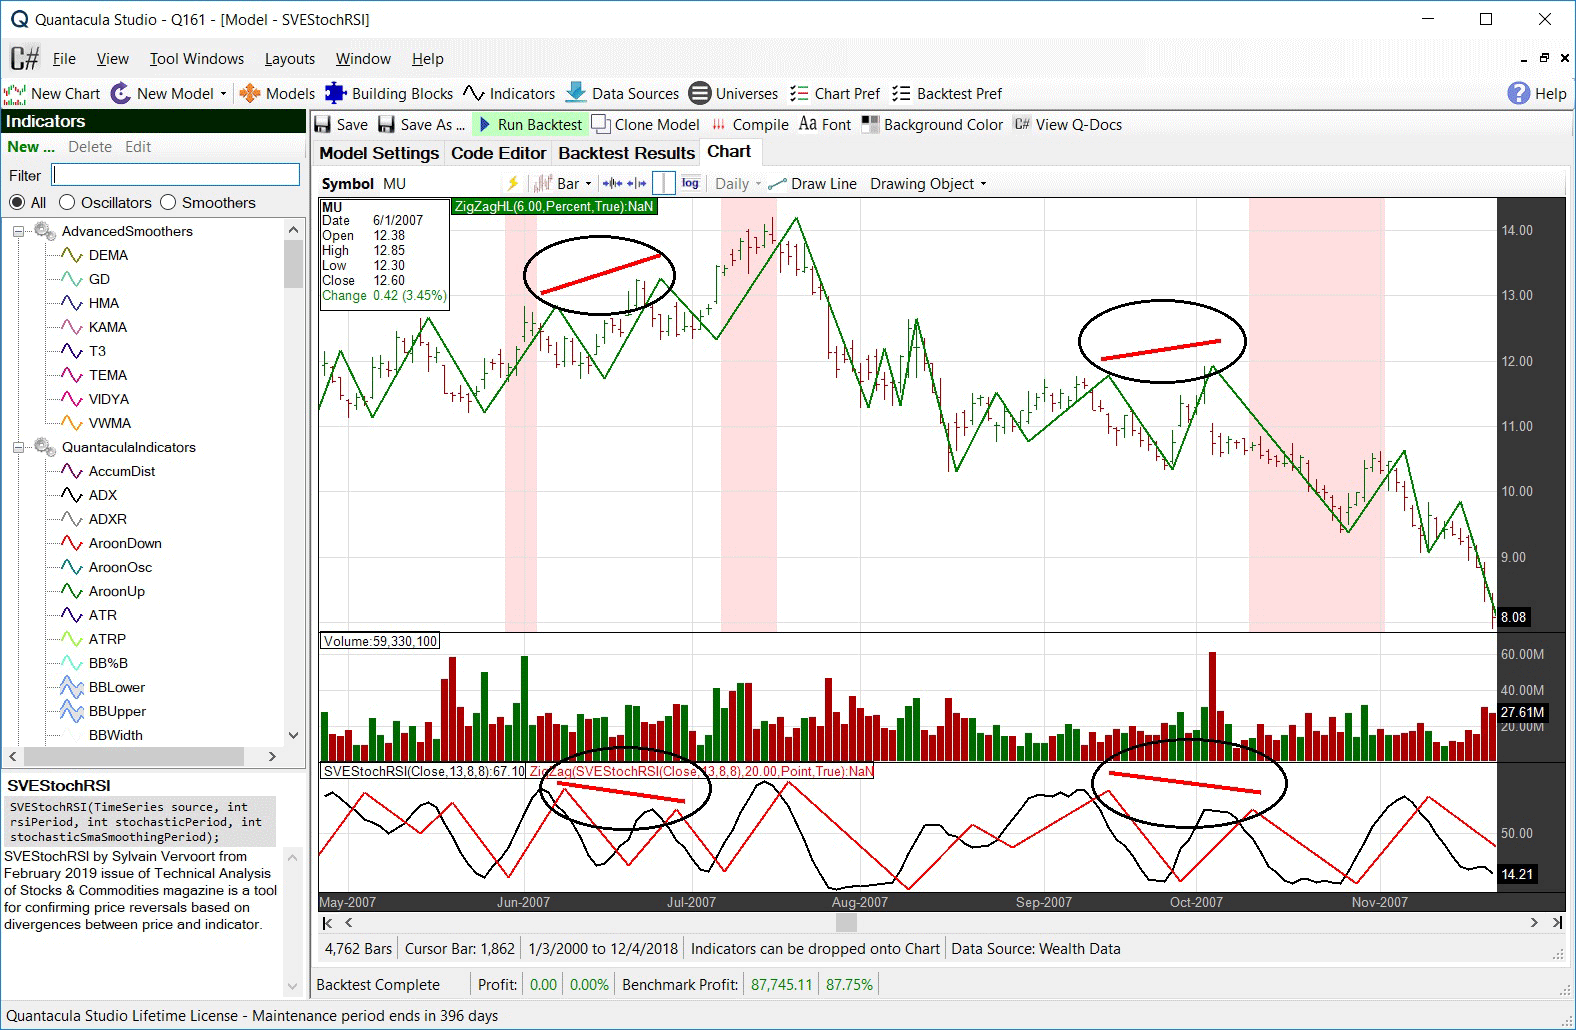
Figure 6 demonstrates the indicator on a sample chart.

FIGURE 6: QUANTACULA. Here, two
bearish divergences in the stock MU were correctly identified when the SVEStochRSI
had falling peaks while MU data experienced rising peaks.
—Dion Kurczek, Quantacula LLC
info@quantacula.com
www.quantacula.com
BACK TO LIST

AIQ: FEBRUARY 2019
An importable AIQ EDS file based on Sylvain Vervoort’s August 2018 S&C
article, “The V-Trade, Part 6: Technical Analysis—Divergence Indicators,” can
be obtained on request via email to info@TradersEdgeSystems.com.
The code is shown here:
!The V-Trade Part 6
!Author: Sylvain Vervoort, TASC Feb 2019
!Coded by: Richard Denning
!www.TradersEdgeSystems.com

!INPUTS:
stochLen is 5.
stochSum is 8.
rsiW is 21.

!RSI WILDER:
U 	is [close]-val([close],1).
D 	is val([close],1)-[close].
rsiLen	is 2 * rsiW - 1.
AvgU 	is ExpAvg(iff(U>0,U,0),rsiLen).
AvgD 	is ExpAvg(iff(D>=0,D,0),rsiLen).
rsi 	is 100-(100/(1+(AvgU/AvgD))).

hiRSI 	is highresult(rsi,stochLen).
lowRSI  	is lowresult(rsi,stochLen).
RSIlow 	is rsi - lowRSI.
RSIhilow  is hiRSI - lowRSI.
ema1  	is simpleavg(RSIlow,stochSum).
ema2 	is simpleavg(RSIhilow,stochSum).
sveStochRSI is (ema1/(ema2 + 0.1))*100.
Figure 7 demonstrates the indicator on a chart of IBM.

FIGURE 7: AIQ. The sveStochRSI
is shown on a chart of IBM.
—Richard Denning
info@TradersEdgeSystems.com
for AIQ Systems
BACK TO LIST

TRADERSSTUDIO: FEBRUARY 2019
An importable TradersStudio set of files for Sylvain Vervoort’s August 2018
S&C article, “The V-Trade, Part 6: Technical Analysis—Divergence Indicators,”
can be obtained on request via email to info@TradersEdgeSystems.com.
The code is shown here:
'The V-Trade Part 6
'Author: Sylvain Vervoort, TASC Feb 2019
'Coded by: Richard Denning
'www.TradersEdgeSystems.com

Function sveStochRSI(stochLen,stochSum,RSIlen)
Dim theRSI As BarArray
Dim hiRSI As BarArray
Dim lowRSI As BarArray
Dim RSIlow As BarArray
Dim RSIhiLow As BarArray
Dim ema1 As BarArray
Dim ema2  As BarArray

theRSI = rsi(C,RSIlen,0)
hiRSI = Highest(theRSI,stochLen,0)
lowRSI = Lowest(theRSI,stochLen,0)
RSIlow = theRSI - lowRSI
RSIhiLow = hiRSI - lowRSI
ema1 = Average(RSIlow,stochSum,0)
ema2 = Average(RSIhiLow,stochSum,0)
sveStochRSI = (ema1/(ema2 + 0.1))*100

End Function
'-------------------------------------------------
Sub sveStochRSI_IND(stochLen,stochSum,RSIlen)
Dim sStochRSI As BarArray
sStochRSI = sveStochRSI(stochLen,stochSum,RSIlen)
plot1(sStochRSI)

End Sub
'--------------------------------------------------
The TradersStudio chart in Figure 8 demonstrates the indicator on a chart
of Apple Inc. (AAPL).

FIGURE 8: TRADERSSTUDIO. The sveStochRSI
is shown on a chart of AAPL.
—Richard Denning
info@TradersEdgeSystems.com
for TradersStudio
BACK TO LIST
MICROSOFT EXCEL: FEBRUARY 2019
In “The V-Trade, Part 6: Technical Analysis—Divergence Indicators” in the
August 2018 issue of STOCKS & COMMODITIES, author Sylvain Vervoort presents
a new indicator built using a smoothed stochastics computation over a standard
RSI.
The computation is straightforward, if a little bulky: To implement it in
Excel, 13 columns of formulas did the trick for the price chart and 13 more
for the renko chart.
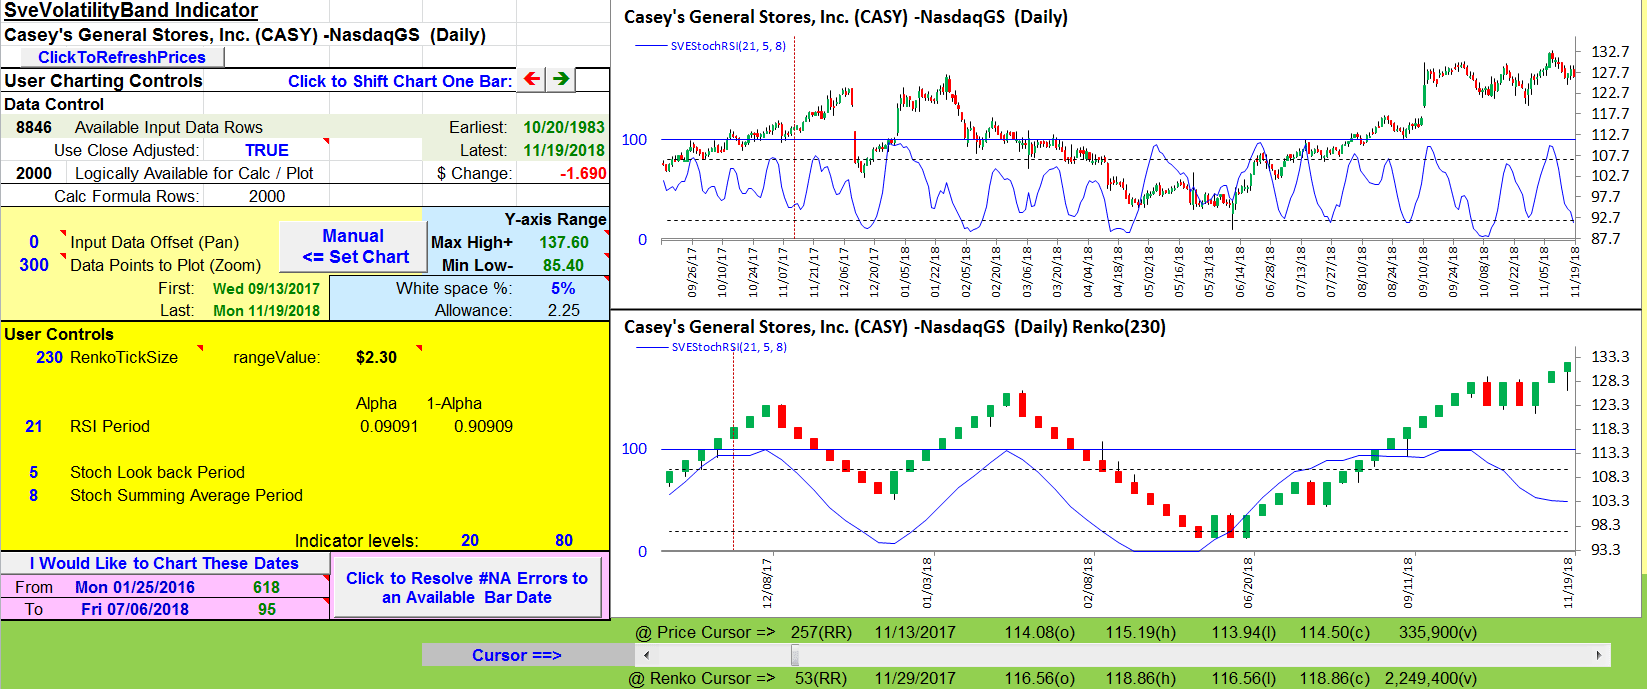
In Figure 9, I show a price chart and a renko chart of the roughly same time
period. To economize on chart space, I have plotted the SVEStochRSI along with
the 20 and 80 indicator levels as an overlay in the lower half of each chart.

FIGURE 9: EXCEL. This shows the
SVEStochRSI indicator on both price and renko charts of the roughly same
time period.
A working version of this spreadsheet for this month’s Traders’ Tip can be
downloaded here.
To successfully download it, follow these steps:
- Right-click on the Excel
file link, then
- Select “save as” (or “save target as”) to place
a copy of the spreadsheet file on your hard drive.
—Ron McAllister
Excel and VBA programmer
rpmac_xltt@sprynet.com
BACK TO LIST
Originally published in the February 2019 issue of
Technical Analysis of STOCKS & COMMODITIES magazine.
All rights reserved. © Copyright 2019, Technical Analysis, Inc.


