TRADERS’ TIPS
March 2019

For this month’s Traders’ Tips, the focus is Sylvain Vervoort’s article in the September 2018 issue, “The V-Trade, Part 7: Technical Analysis—V-Wave Count.” Here, we present the March 2019 Traders’ Tips code with possible implementations in various software.
You can right-click on any chart to open it in a new tab or window and view it at it’s originally supplied size, often much larger than the version printed in the magazine.
The Traders’ Tips section is provided to help the reader implement a selected technique from an article in this issue or another recent issue. The entries here are contributed by software developers or programmers for software that is capable of customization.

TRADESTATION: MARCH 2019
In “The V-Trade, Part 7: Technical Analysis—V-Wave Count,” which appeared in the September 2018 issue of Technical Analysis of STOCKS & COMMODITIES, author Sylvain Vervoort introduces a tool to assist in counting waves based on Elliott wave theory. His SVE zigzag ticks indicator automatically draws trendlines highlighting the waves using a specified number of points to detect the pullbacks. A sample chart is shown in Figure 1.

FIGURE 1: TRADESTATION. This sample TradeStation mean renko chart of the FDAX index shows the SVE zigzag ticks indicator.
Here is the TradeStation EasyLanguage code for a zigzag indicator based on the author’s description.
Indicator: SVE ZigZag Ticks
// SVE ZigZag Ticks
// TASC Mar 2019
// Sylvain Vervoort

using elsystem;
using elsystem.drawing;
using elsystem.drawingobjects;

inputs:
	double HighPivotPrice( High ),
	double LowPivotPrice( Low ),
	double RetracePnts( 5 ),
	int LineColor( Yellow ),
	int LineWidth( 1 ) ;

variables:
	intrabarpersist bool UseBNPoint( false ),
	int DrawingObjectBarNumber( 0 ),
	TrendLine ZigZagTrendline( NULL ),
	DTPoint SwingDTPoint( NULL ),
	DTPoint LastSwingDTPoint( NULL ),
	BNPoint SwingBNPoint( NULL ),
	BNPoint LastSwingBNPoint( NULL ),
	double NewSwingPrice( 0 ),
	double SwingPrice( Close ),
	int TLDir( 0 ),
	bool SaveSwing( false ),
	bool AddTL( false ),
	bool UpdateTL( false );

method TrendLine CreateNewTrendline()
variables:  TrendLine tempTL;
begin
	if UseBNPoint then
		tempTL = TrendLine.Create(
			LastSwingBNPoint, SwingBNPoint )
	else { use DTPoint }
		tempTL = TrendLine.Create(
			LastSwingDTPoint, SwingDTPoint );

	tempTL.Persist = false;
	tempTL.Lock = true;
	tempTL.Color = GetColorFromInteger(
		255, LineColor );
	tempTL.ExtLeft = false;
	tempTL.ExtRight = false;
	tempTL.Weight = LineWidth;
	if DrawingObjects <> NULL then
		DrawingObjects.Add( tempTL );
	return tempTL;
end;

method Color GetColorFromInteger(
	int Alpha, int ColorInteger )
begin
	return Color.FromARGB(
		Alpha, GetRValue( ColorInteger ),
	 GetGValue( ColorInteger ), GetBValue(
	 	ColorInteger ) );
end;

once
begin
	UseBNPoint = BarType = 0 or (
		BarType > 4 and BarType <> 14 );

	if UseBNPoint then
		SwingBNPoint = BNPoint.Create(
			CurrentBar + MaxBarsBack - 1, Close )
	else
		SwingDTPoint = DTPoint.Create(
			BarDateTime, Close );
end;

if UseBNPoint then
	DrawingObjectBarNumber =
		CurrentBar + MaxBarsBack - 1;


NewSwingPrice = SwingHigh(
	1, HighPivotPrice, 1, 2 );

if NewSwingPrice  <> -1 then
begin
	if TLDir <= 0 and NewSwingPrice >=
		SwingPrice + RetracePnts then
	begin
		SaveSwing = true;
		AddTL = true;
		TLDir = 1;
	end
	else if TLDir = 1 and NewSwingPrice >=
		SwingPrice then
	begin
		SaveSwing = true;
		UpdateTL = true;
	end;
end
else
begin
	NewSwingPrice = SwingLow( 1,
		LowPivotPrice, 1, 2 );
	if NewSwingPrice <> -1 then
	begin
		if TLDir >= 0 and NewSwingPrice <=
			SwingPrice - RetracePnts then
		begin
			SaveSwing = true;
			AddTL = true;
			TLDir = -1;
		end
		else if TLDir = -1 and NewSwingPrice <=
			SwingPrice then
		begin
			SaveSwing = true;
			UpdateTL = true;
		end;
	end;
end;

if SaveSwing then
begin
	if UseBNPoint then
	begin
		LastSwingBNPoint = SwingBNPoint;
		SwingBNPoint = BNPoint.Create(
			DrawingObjectBarNumber[1],
			NewSwingPrice );
	end
	else
	begin
		LastSwingDTPoint = SwingDTPoint;
		SwingDTPoint = DTPoint.Create(
			BarDateTime[1],	NewSwingPrice );
	end;
	SwingPrice = NewSwingPrice;
	SaveSwing = false;
end;

if AddTL then
begin
	ZigZagTrendline = CreateNewTrendline();
	AddTL = false;
end
else if UpdateTL then
begin
	if ZigZagTrendline <> NULL then
	begin
		if UseBNPoint then
			ZigZagTrendline.SetEndPoint(
				SwingBNPoint )
		else
			ZigZagTrendline.SetEndPoint(
				SwingDTPoint );
	end;
	UpdateTL = false;
end;
To download the EasyLanguage code, please visit our TradeStation and EasyLanguage support forum. The files for this article can be found here: https://community.tradestation.com/Discussions/Topic.aspx?Topic_ID=156727. The filename is “TASC_MAR2019.ZIP.” For more information about EasyLanguage in general, please visit TradeStation.com.
This article is for informational purposes. No type of trading or investment recommendation, advice, or strategy is being made, given, or in any manner provided by TradeStation Securities or its affiliates.
—Doug McCrary
TradeStation Securities, Inc.
www.TradeStation.com
BACK TO LIST

eSIGNAL: MARCH 2019
For this month’s Traders’ Tip, we’ve provided the study SveHLZigZagTicks.efs based on the article by Sylvain Vervoort, “The V-Trade, Part 7: Technical Analysis—V-Wave Count,” from the September 2018 issue of Technical Analysis of STOCKS & COMMODITIES.
The study displays the waves (swings) on the price chart. A sample chart is shown in Figure 2.

FIGURE 2: eSIGNAL. Here is an example of the study plotted on a 60-minute chart of SPY.
The study contains formula parameters that may be configured through the edit chart window (right-click on the chart and select “edit chart”).
To discuss this study or download a complete copy of the formula code, please visit the EFS library discussion board forum under the forums link from the support menu at www.esignal.com or visit our EFS KnowledgeBase at https://www.esignal.com/support/kb/efs/. The eSignal formula script (EFS) is shown below.
/*********************************
Provided By:
eSignal (Copyright c eSignal), a division of Interactive Data
Corporation. 2016. All rights reserved. This sample eSignal
Formula Script (EFS) is for educational purposes only and may be
modified and saved under a new file name.  eSignal is not responsible
for the functionality once modified.  eSignal reserves the right
to modify and overwrite this EFS file with each new release.

Description:
    The V-Trade. Part 7: Technical Analysis—V-Wave Count
    by Sylvain Vervoort


Version:            1.00  01/15/2019

Formula Parameters:                     Default:
NumberOfTicks                           200

Notes:
The related article is copyrighted material. If you are not a subscriber
of Stocks & Commodities, please visit www.traders.com.

**********************************/


var fpArray = new Array();

function preMain(){
    setPriceStudy(true);
    setStudyTitle("SveHLZigZagTicks");


    var x = 0;
    fpArray[x] = new FunctionParameter("NumberOfTicks", FunctionParameter.NUMBER);
	with(fpArray[x++]){
        setName("Reversal Number of Ticks");
        setLowerLimit(2);
        setDefault(200);

    }

    fpArray[x] = new FunctionParameter("LineColor", FunctionParameter.COLOR);
	with(fpArray[x++]){
        setName("Line Color");
        setDefault(Color.RGB(0,148,255));

    }
}

var bInit = false;
var bVersion = null;
var vFlat = null;
var vCurrentTrend = null;

var xOpen = null;
var xHigh = null;
var xLow = null;
var xClose = null;


var vLastHigh = null;
var vLastHigh_1 = null;
var vLastLow = null;
var vLastLow_1 = null;
var vZZTemp = [];
var vZZfinal;

var point = null;
var fNewBar = null;
var vLastSwingH = null;
var Count = null;


var x1a = null;
var x1b = null;
var y1a = null;
var y1b = null;
var cntr = null;
var sType;

function main(NumberOfTicks, LineColor){
    if (bVersion == null) bVersion = verify();
    if (bVersion == false) return;

    if (getBarState() == BARSTATE_ALLBARS){
        bInit = false;
    }

    if (!bInit){

        xClose = close();
        xHigh = high();
        xLow = low();
        xOpen = open();
        point = getMinTick();
        vCurrentTrend = 1;
        Count = null;

        x1b = null;
        y1b = null;
        x1a = null;
        y1a = null;
        cntr = null;

        bInit = true;
    }

    fNewBar = false;

    if (getBarState() == BARSTATE_NEWBAR){
        vLastHigh_1 = vLastHigh;
        vLastLow_1 = vLastLow;
        fNewBar = true;
        Count = Count+1;

        if (x1a != null) x1a -= 1;
        if (x1b != null) x1b -= 1;

    }

    vFlat = 1;

    if (vCurrentTrend > 0) {
        if (xHigh.getValue(0) >= vLastHigh_1) {
            vLastHigh = xHigh.getValue(0);
            if (!fNewBar) vZZTemp.shift();
            vZZTemp.unshift(xHigh.getValue(0));

        }
        else if (xLow.getValue(0) <= (vLastHigh_1 - (point * NumberOfTicks))){
            vLastLow = xLow.getValue(0);
            vLastHigh  = xLow.getValue(0);
            if (!fNewBar) vZZTemp.shift();
            vZZTemp.unshift(xLow.getValue(0));
            vCurrentTrend = -1;
        }
        else {
            vLastHigh = vLastHigh_1;
            if (!fNewBar) vZZTemp.shift();
            vZZTemp.unshift(vLastHigh);
        }
    }
    else {
        if (xLow.getValue(0) <= vLastLow_1){
            vLastLow = xLow.getValue(0);
            if (!fNewBar) vZZTemp.shift();
            vZZTemp.unshift(xLow.getValue(0));
        }
        else if (xHigh.getValue(0) >= (vLastLow_1 + (point * NumberOfTicks))) {
            vLastHigh = xHigh.getValue(0);
            vLastLow  = xHigh.getValue(0);
            if (!fNewBar) vZZTemp.shift();
            vZZTemp.unshift(xHigh.getValue(0));
            vCurrentTrend = 1;
        }
        else {
            vLastLow = vLastLow_1;
            if (!fNewBar) vZZTemp.shift();
            vZZTemp.unshift(vLastLow);
        }
    }


    if (vZZTemp[vFlat] < vZZTemp[vFlat+1] && vZZTemp[0] >= vZZTemp[1]) {

        if (vLastSwingH == false ){
            removeLine(sType+cntr)
            cntr -= 1;
        }
        else {
            x1a = x1b;
            y1a = y1b;
        }

        x1b = -vFlat;
        y1b = xLow.getValue(-vFlat)

        doLine("con",LineColor);
        vLastSwingH = false;
    }
    else if (vZZTemp[vFlat] > vZZTemp[vFlat+1] && vZZTemp[0] <= vZZTemp[1]) {

        if (vLastSwingH == true ){
            removeLine(sType+cntr)
            cntr -= 1;
        }
        else {
            x1a = x1b;
            y1a = y1b;
        }
            x1b = -vFlat;
            y1b = xHigh.getValue(-vFlat)

        doLine("con",LineColor);
        vLastSwingH = true;
    }

    if (vZZTemp[0] == vZZTemp[1]) vFlat = vFlat + 1;
    else vFlat = 1;

    return;

}

function doLine(sType, LineColor) {
        cntr += 1;
    if (x1a != null && x1b != null){
        drawLineRelative(x1a, y1a, x1b, y1b, PS_SOLID,
            3, LineColor, sType+cntr);
    }
    return;
}

function verify(){
    var b = false;
    if (getBuildNumber() < 779){

        drawTextAbsolute(5, 35, "This study requires version 10.6 or later.",
            Color.white, Color.blue, Text.RELATIVETOBOTTOM|Text.RELATIVETOLEFT|Text.BOLD|Text.LEFT,
            null, 13, "error");
        drawTextAbsolute(5, 20, "Click HERE to upgrade.@URL=https://www.esignal.com/download/default.asp",
            Color.white, Color.blue, Text.RELATIVETOBOTTOM|Text.RELATIVETOLEFT|Text.BOLD|Text.LEFT,
            null, 13, "upgrade");
        return b;
    }
    else
        b = true;

    return b;
}
—Eric Lippert
eSignal, an Interactive Data company
800 779-6555, www.eSignal.com
BACK TO LIST

WEALTH-LAB: MARCH 2019
The SVEHLZigZagTicks indicator, introduced by Sylvain Vervoort in his September 2018 S&C article, “The V-Trade, Part 7: Technical Analysis—V-Wave Count,” is now part of our TASCIndicators library.
We coded it as a trailing reverse indicator, which marks the reverse of a trend-following move of a certain number of ticks off the last price extreme. It can be applied to any bar scale, not just tick-based charts. Crossovers and crossunders of the indicator line can be used to trigger trend trades.
A sample chart is shown in Figure 3.

FIGURE 3: WEALTH-LAB. This sample chart demonstrates application of the indicator to a one-minute chart of TSLA (data provided by AlphaVantage).
In addition, we’ve extended the already-published SVEHLZZperc indicator to accept “points” (that is, ticks) as input in addition to the other types of price movement (percent, ATR, and combined).
After updating the TASCIndicators library to its latest version, the SVEHLZigZagTicks indicator can be found under the TASC Magazine Indicators group. Please install (or update if you haven’t done so already) the library from the wealth-lab.com site to its latest version. Then you can plot it on a chart or use it as an entry or exit condition in a rule-based strategy without having to program any code yourself.
—Gene (Eugene) Geren, Wealth-Lab team
MS123, LLC
www.wealth-lab.com
BACK TO LIST

NEUROSHELL TRADER: MARCH 2019
The SveHLZigZagTicks indicator that was introduced in Sylvain Vervoort’s September 2018 article in STOCKS & COMMODITIES, “The V-Trade, Part 7: Technical Analysis—V-Wave Count,” can be implemented in NeuroShell Trader using NeuroShell Trader’s ability to call external dynamic linked libraries. Dynamic linked libraries can be written in C, C++, Power Basic, or Delphi.
After coding the indicator in your preferred compiler and creating a DLL, you can insert the resulting SveHLZigZagTicks indicator as follows:
- Select “new indicator” from the insert menu
- Choose the “external program & library calls” category
- Select the appropriate external DLL call indicator
- Set up the parameters to match your DLL
- Select the finished button.
An alternative method to analyzing wave counts in NeuroShell Trader is to use the Turning Points add-on, which not only plots lines between peaks and valleys, but also plots peak/valley support & resistance lines, the support/resistance price oscillator, Fibonacci retracement lines, price, time and slope statistical measures, and the probability that the current price is a new peak or valley.
Users of NeuroShell Trader can go to the Stocks & Commodities section of the NeuroShell Trader free technical support website to download a copy of this or any previous Traders’ Tips.
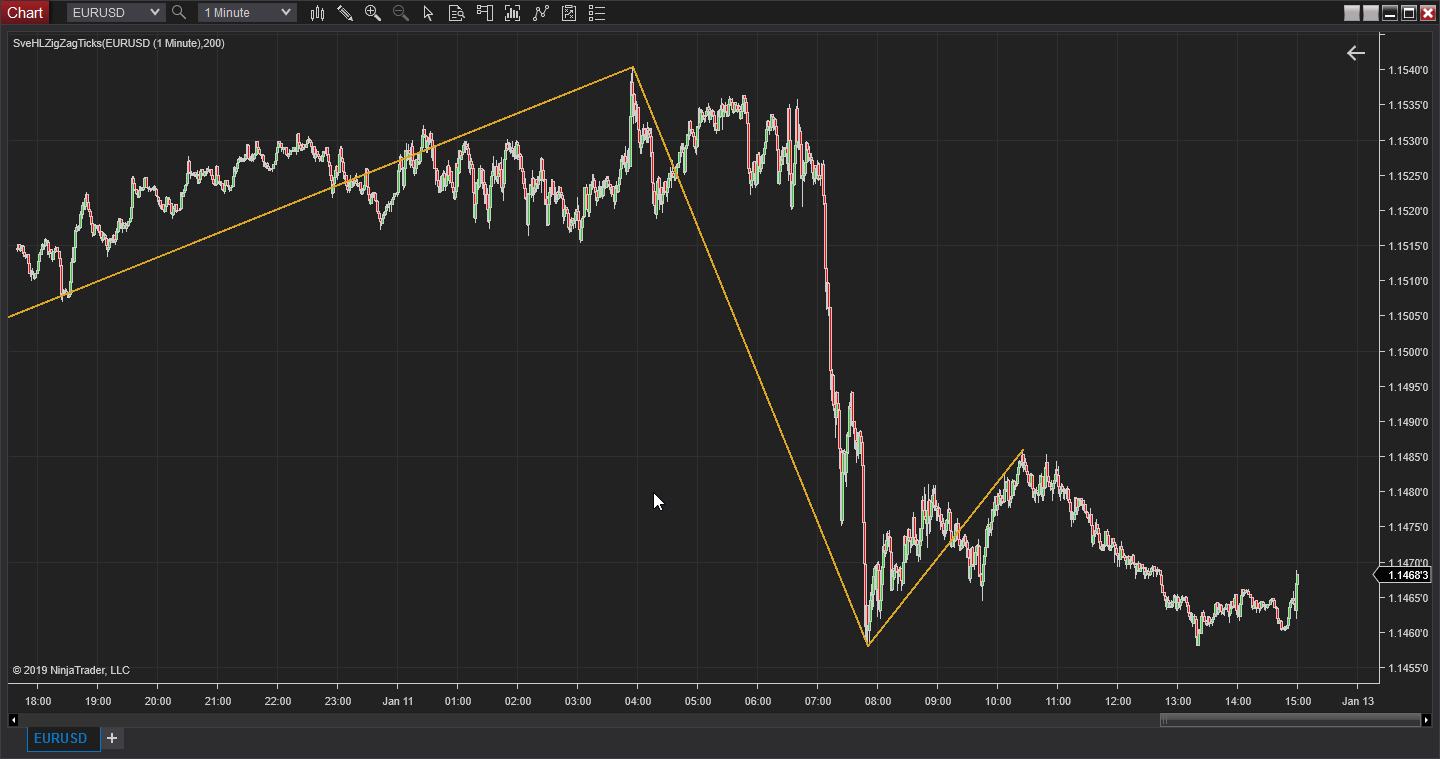
A sample chart is shown in Figure 4.

FIGURE 4: NEUROSHELL TRADER. This NeuroShell Trader chart displays the EUR/USD 200-tick SveHLZigZagTicks indicator.
—Marge Sherald, Ward Systems Group, Inc.
301 662-7950, sales@wardsystems.com
www.neuroshell.com
BACK TO LIST

QUANTACULA: MARCH 2019
In “The V-Trade, Part 7: Technical Analysis—V-Wave Count” in the September 2018 issue of Technical Analysis of STOCKS & COMMODITIES, author Sylvain Vervoort uses several customized zigzags as part of his trading methodology. The Quantacula platform contains two built-in indicators to let you easily add zigzags to your charts or to your trading models.
- Our ZigZag indicator takes as input a single data series, generating zigzags based on a specified reversal amount, expressed either as a percentage or a flat value.
- Our ZigZagHL indicator uses the historical highs and lows to create a zigzag, letting you specify the reversal amount to use, either as a percentage or a flat value.
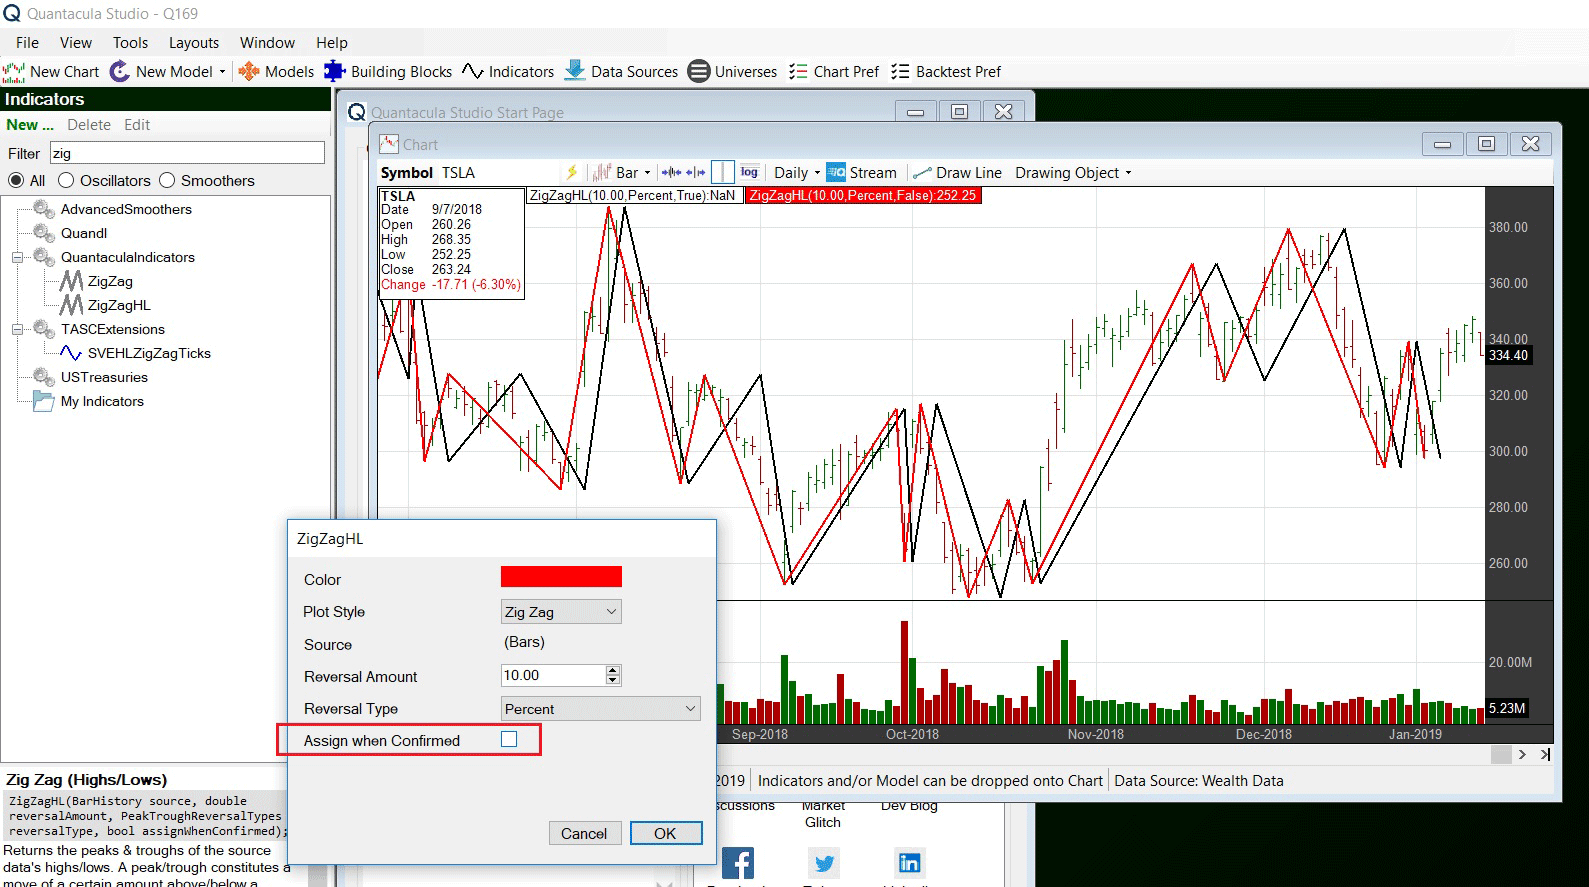
Both indicators have an important additional parameter called assign when confirmed. When this is set to true (default), the zigzag points are anchored to the bars at which they were detected, that is, the point in time that the source data moved by at least the specified reversal amount. In the chart shown in Figure 5, this zigzag is colored in black. This indicator is safe to use in a backtest.

FIGURE 5: QUANTACULA. The standard zigzag is plotted in red, while the zigzag that is “safe” for backtesting is plotted in black.
When assign when confirmed is false, the zigzag is anchored to the points on the chart that contain the peaks and troughs of the price moves. This is your typical zigzag and is plotted in red in Figure 5. Notice how the black zigzag is always delayed by one or more bars. The red zigzag can be useful when scanning for historical chart patterns, but it is not safe to use when backtesting, since it relies on future information when establishing its values.
Quantacula defaults to the “safe” zigzag option, which can be used in a backtest. But it also provides the classic zigzag for charting and pattern-detection purposes. More importantly, it clearly shows you the delay in the standard zigzag, so you can make more informed decisions when using zigzag in a trading strategy.
—Dion Kurczek, Quantacula LLC
info@quantacula.com
www.quantacula.com
BACK TO LIST

AIQ: MARCH 2019
The AIQ program has a built-in zigzag indicator that is similar to the one discussed in Sylvain Vervoort September 2018 S&C article, “The V-Trade, Part 7: Technical Analysis—V-Wave Count.” This indicator is demonstrated on an AIQ chart in Figure 6.

FIGURE 6: AIQ. This demonstrates the built-in zigzag indicator on an AIQ chart of SPY.
—Richard Denning
info@TradersEdgeSystems.com
for AIQ Systems
BACK TO LIST

NINJATRADER: MARCH 2019
The SveHLZigZagTicks indicator, as discussed in the September 2018 S&C article titled “The V-Trade, Part 7: Technical Analysis—V-Wave Count” by Sylvain Vervoort, is available for download at the following links for NinjaTrader 8 and for NinjaTrader 7:
Once the file is downloaded, you can import the indicator into NinjaTader 8 from within the Control Center by selecting Tools → Import → NinjaScript Add-On and then selecting the downloaded file for NinjaTrader 8. To import into NinjaTrader 7, from within the Control Center window, select the menu File → Utilities → Import NinjaScript and select the downloaded file.
You can review the indicator’s source code in NinjaTrader 8 by selecting the menu New → NinjaScript Editor → Indicators from within the Control Center window and selecting the SveHLZigZagTicks file. You can review the indicator’s source code in NinjaTrader 7 by selecting the menu Tools → Edit NinjaScript → Indicator from within the Control Center window and selecting the SveHLZigZagTicks file.
NinjaScript uses compiled DLLs that run native, not interpreted, which provides you with the highest performance possible.
A sample chart implementing the indicator is shown in Figure 7.

FIGURE 7: NINJATRADER. The SveHLZigZagTicks indicator is displayed on a one-minute EURUSD chart during January 2019.
—Raymond Deux & Jim Dooms
NinjaTrader, LLC
www.ninjatrader.com
BACK TO LIST
Originally published in the March 2019 issue of
Technical Analysis of STOCKS & COMMODITIES magazine.
All rights reserved. © Copyright 2019, Technical Analysis, Inc.


