TRADERS’ TIPS
APRIL 2019

For this month’s Traders’ Tips, the focus is Vitali Apirine’s article in this issue, “Adaptive Exponential Moving Average.” Here, we present the April 2019 Traders’ Tips code with possible implementations in various software.
You can right-click on any chart to open it in a new tab or window and view it at it’s originally supplied size, often much larger than the version printed in the magazine.
The Traders’ Tips section is provided to help the reader implement a selected technique from an article in this issue or another recent issue. The entries here are contributed by software developers or programmers for software that is capable of customization.

TRADESTATION: APRIL 2019
In “Adaptive Exponential Moving Average” in this issue, author Vitali Apirine introduces a new adaptive moving average (AEMA) technique that when combined with a standard exponential moving average gives traders another tool to help identify overall trends. In addition, the author describes a method for using this new indicator to help identify turning points.
Here, we are providing the TradeStation EasyLanguage code for an indicator and a strategy based on the author’s work. We have also included the code for an AEMA function so that you can easily include the AEMA in your own EasyLanguage code.
Indicator: Adaptive Exponential Moving Average
// Adaptive EMA Indicator
// TASC APR 2018
// Vitali Apirine
inputs:
	Period( 10 ),
	PDS( 10 ) ;

variables:
	AEMA( 0 ) ;

AEMA = _AEMA( Period, PDS ) ;

Plot1( AEMA, "AEMA" ) ;


Strategy: Adaptive Exponential Moving Average
// Adaptive EMA Strategy
// TASC APR 2018
// Vitali Apirine

inputs:
	Period( 10 ),
	PDS( 10 ),
	EMALength( 10 ) ;

variables:
	AEMA( 0 ),
	EMA( 0 ) ;

AEMA = _AEMA( Period, PDS ) ;
EMA = XAverage( Close, EMALength ) ;

if AEMA crosses over EMA then
	Buy next bar at Market
else if EMA crosses over AEMA then
	SellShort next bar at Market ;

Function: _AEMA
// Adaptive EMA Function
// TASC APR 2018
// Vitali Apirine
inputs:
	Periods( numericsimple ),
	PDS( numericsimple ) ;

variables:
	MLTP1( 2 / ( Periods + 1 ) ),
	MLTP2( 0 ),
	Rate( 0 ) ;

MLTP2 = AbsValue( ( Close - Lowest( Low, PDS ) )
	- ( Highest( High, PDS ) - Close )) / ( Highest( High, PDS )
	- Lowest( Low, PDS ) ) ;

Rate = MLTP1 * ( 1 + MLTP2 ) ;

if CurrentBar <= Periods then
	_AEMA = Average( Close, Periods )
else
	_AEMA = _AEMA[1] + Rate * ( Close - _AEMA[1] ) ;
To download the EasyLanguage code, please visit our TradeStation and EasyLanguage support forum. The files for this article can be found here: https://community.tradestation.com/Discussions/Topic.aspx?Topic_ID=156727. The filename is “TASC_APR2019.ZIP.”
For more information about EasyLanguage in general, please see https://www.tradestation.com/EL-FAQ.
A sample chart is shown in Figure 1.

FIGURE 1: TRADESTATION. This shows a five-minute chart of Apple (AAPL) with the adaptive exponential moving average indicator and strategy applied.
This article is for informational purposes. No type of trading or investment recommendation, advice, or strategy is being made, given, or in any manner provided by TradeStation Securities or its affiliates.
—Doug McCrary
TradeStation Securities, Inc.
www.TradeStation.com
BACK TO LIST

WEALTH-LAB: APRIL 2019
The AEMA is a new adaptive moving average presented by Vitali Apirine in his article in this issue, “Adaptive Exponential Moving Average.”
With the look and feel of an EMA (exponential moving average), AEMAs with different lengths can be used to create a trading system based on double crossovers. In a few easy steps, we’ll show how to set up an AEMA-based trading system in Wealth-Lab without coding.
Step 1. Install (or update) the TASCIndicators library to its most-recent version from our website, wealth-lab.com, or using the built-in Extension Manager. Once you see the AEMA listed under the “TASC Magazine Indicators” group, it’s ready for use.
Step 2. Now add some entry and exit blocks, then drag and drop “indicator crosses above (below) indicator” from general indicators under the conditions tab on top of each one (respectively).
Step 3. For each entry and exit, choose a faster AEMA (10,10) for “indicator1” and a slower (50,50) for “indicator2” where prompted.
Figure 2 shows an example of setting up a strategy in Wealth-Lab from rules by simple drag & drop.
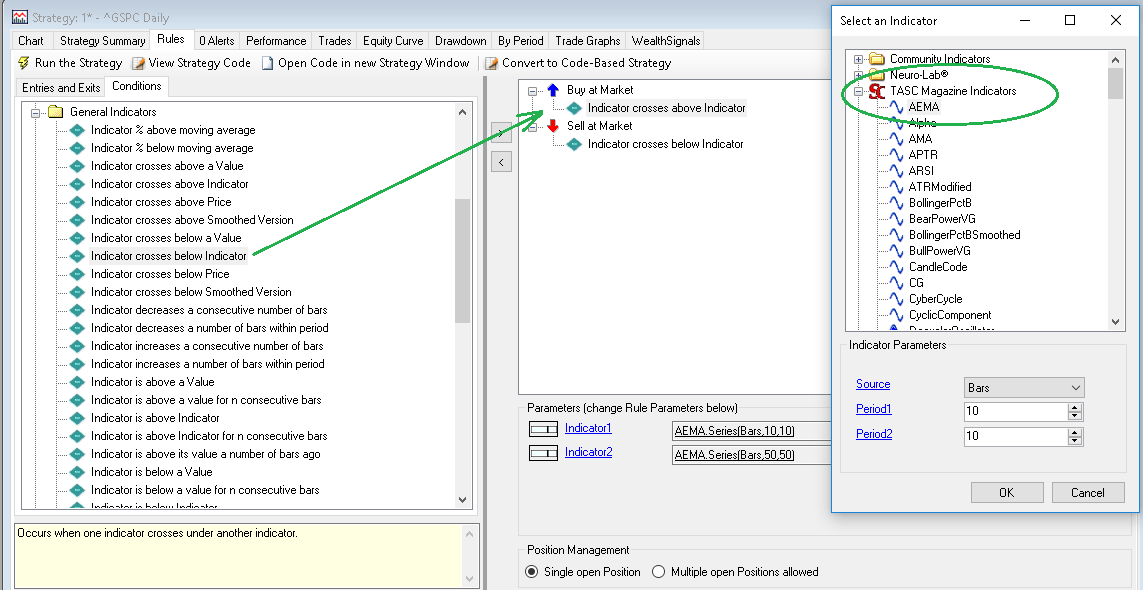
FIGURE 2: WEALTH-LAB. Here is an example of creating a strategy that’s based on an adaptive exponential moving average (AEMA) using rules in Wealth-Lab.
If everything is set up correctly, your trading system will generate trades such as the ones shown in Figure 3.
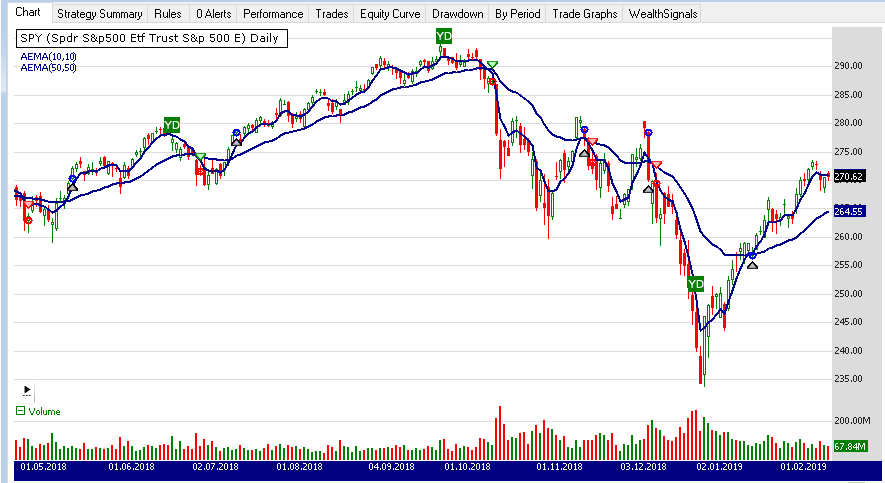
FIGURE 3: WEALTH-LAB. Here’s an example trading system applied to a daily chart of QQQ (data provided by Yahoo).
But the rules doesn’t have to be symmetric. Here’s a twist if you like to let profits ride: Choose a pair of slower AEMA periods for the exits—say, AEMA(20,20) and AEMA(100,100).
The bottom line is that in a couple of minutes you’ve prototyped a trading system without having to write any code.
—Gene (Eugene) Geren, Wealth-Lab team
MS123, LLC
www.wealth-lab.com
BACK TO LIST

NINJATRADER: APRIL 2019
An AEMA indicator, as discussed by Vitali Apirine in his article in this issue, “Adaptive Exponential Moving Average,” is available for download at the following links for NinjaTrader 8 and NinjaTrader 7:
Once the file has been downloaded, you can import the indicator into NinjaTader 8 from within the control center by selecting Tools → Import → NinjaScript Add-On and then selecting the downloaded file for NinjaTrader 8. To import into NinjaTrader 7, from within the control center window, select the menu File → Utilities → Import NinjaScript and select the downloaded file.
You can review the indicator’s source code in NinjaTrader 8 by selecting the menu New → NinjaScript Editor → Indicators from within the control center window and selecting the AEMA file. You can review the indicator’s source code in NinjaTrader 7 by selecting the menu Tools → Edit NinjaScript → Indicator from within the control center window and selecting the AEMA file.
NinjaScript uses compiled DLLs that run native, not interpreted, which provides you with the highest performance possible.
A sample chart implementing the strategy is shown in Figure 4.

FIGURE 4: NINJATRADER. AEMAs of lengths 50,50 and 10,10 are seen here plotted on a daily chart of the S&P 500 index between May 2012 and March 2013.
—Raymond Deux & Jim Dooms
NinjaTrader, LLC
www.ninjatrader.com
BACK TO LIST

QUANTACULA: APRIL 2019
The adaptive exponential moving average (AEMA) indicator described by Vitali Apirine in his article in this issue is available as part of the TASC Extension that comes bundled with Quantacula Studio. It is also available for models built and backtested on the Quantacula.com website.
We decided to compare the AEMA with the EMA by running a five-year backtest on the stocks of the Nasdaq 100. We used the QPremium Nasdaq 100 data set that correctly accounts for symbols that move into and out of the index over time, eliminating the problem of survivorship bias. We implemented a straightforward moving average crossover model with periods of 10 and 50, as described in the article. We backtested with 1% of equity per position to ensure we get all simulated trades filled. No commission was applied to these backtests since we simply want to compare the raw performance of the indicators.
The chart on the left in Figure 5 shows the equity curve of the EMA model, and the chart on the right shows the AEMA result. In this basic backtest, using the AEMA in a crossover situation handily outperformed the EMA. It resulted in a net profit of 126.71% over five years, while the EMA model yielded only 21.73%.
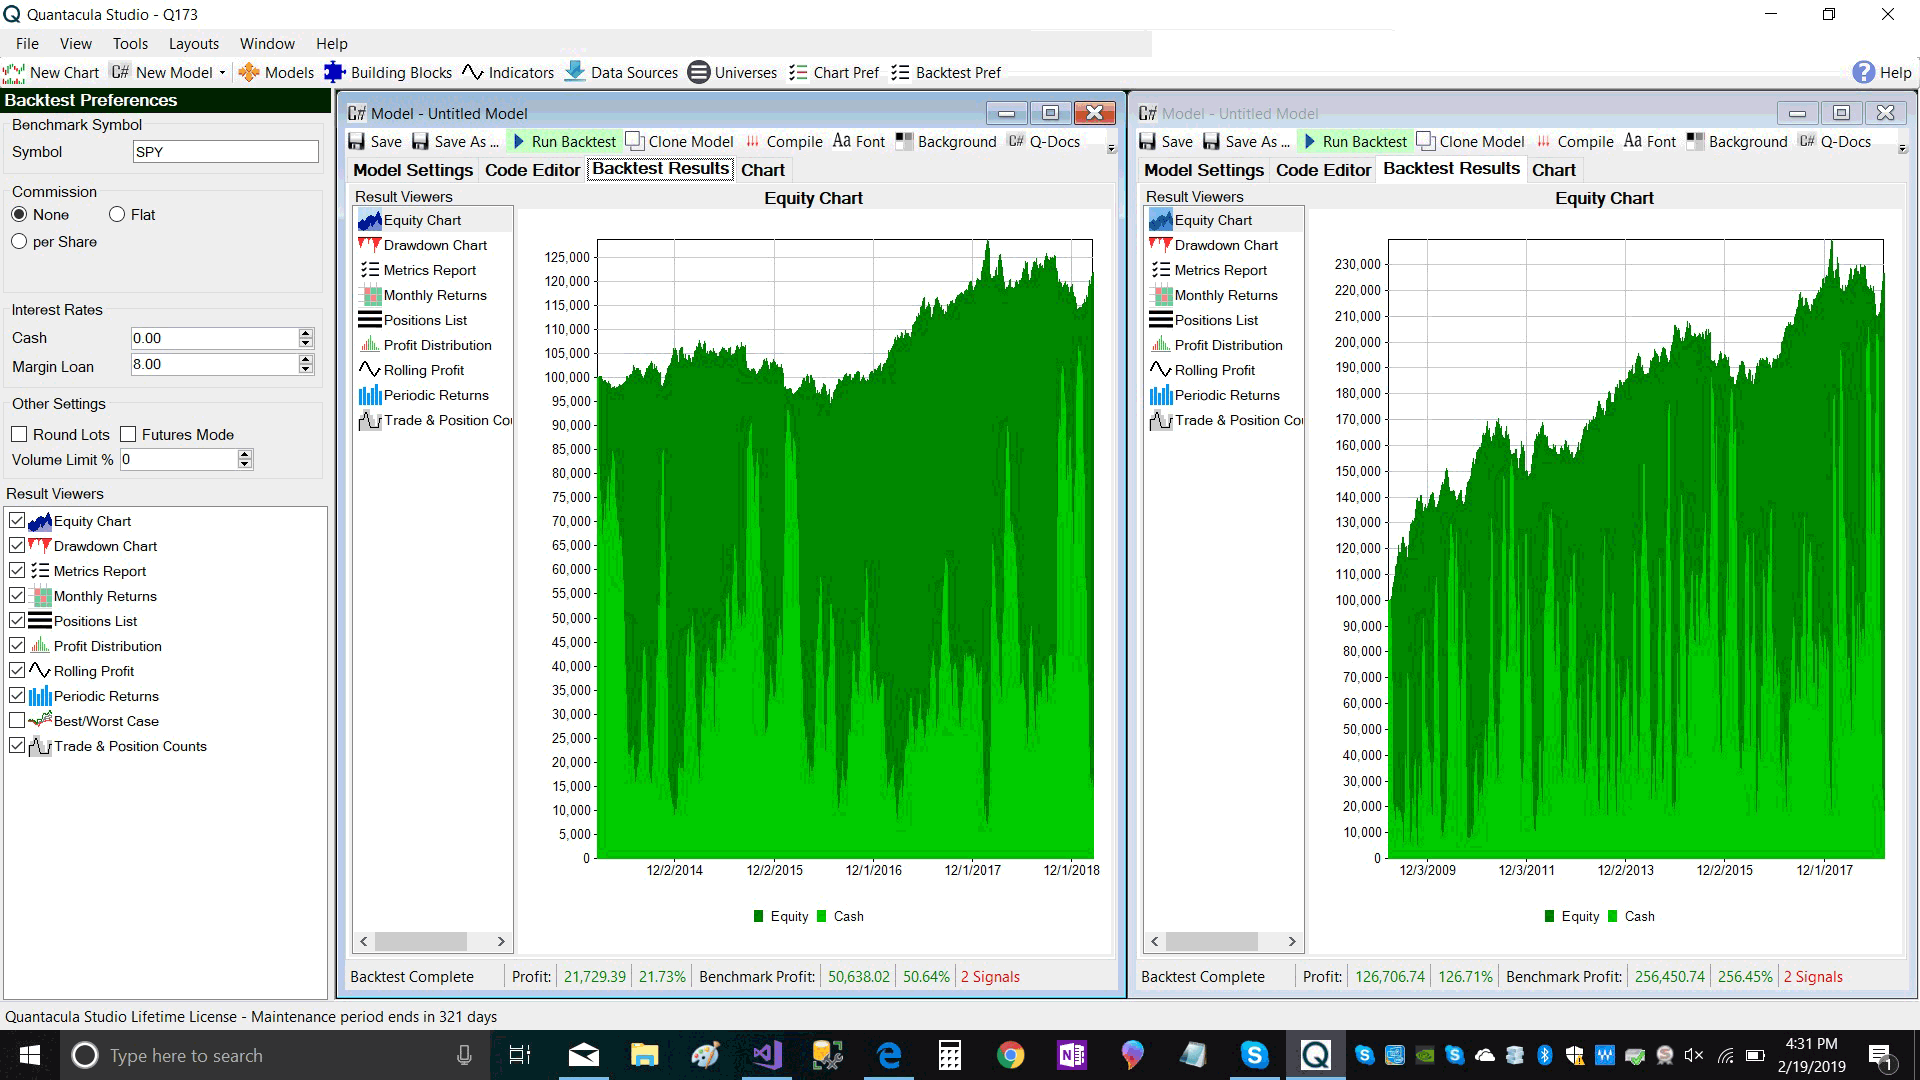
FIGURE 5: QUANTACULA STUDIO. The chart on the left shows the equity curve of the EMA model, and the chart on the right shows the AEMA result.
—Dion Kurczek, Quantacula LLC
info@quantacula.com
www.quantacula.com
BACK TO LIST

NEUROSHELL TRADER: APRIL2019
An adaptive exponential moving average (AEMA) indicator such as the one described by Vitali Apirine in his article in this issue, “Adaptive Exponential Moving Average,” can be easily implemented in NeuroShell Trader using NeuroShell Trader’s ability to call external dynamic linked libraries. Dynamic linked libraries can be written in C, C++ and Power Basic.
After moving the MetaStock code given in Apirine’s article to your preferred compiler and creating a DLL, you can insert the resulting indicator into NeuroShell as follows:
- Select “new indicator” from the insert menu.
- Choose the “external program & library calls”
category.
- Select the appropriate “external DLL call” indicator.
- Set up the parameters to match your DLL.
- Select the finished button.
Users of NeuroShell Trader can go to the Stocks & Commodities section of the NeuroShell Trader free technical support website to download a copy of this or any of previous Traders’ Tips.
A sample chart is shown in Figure 6.
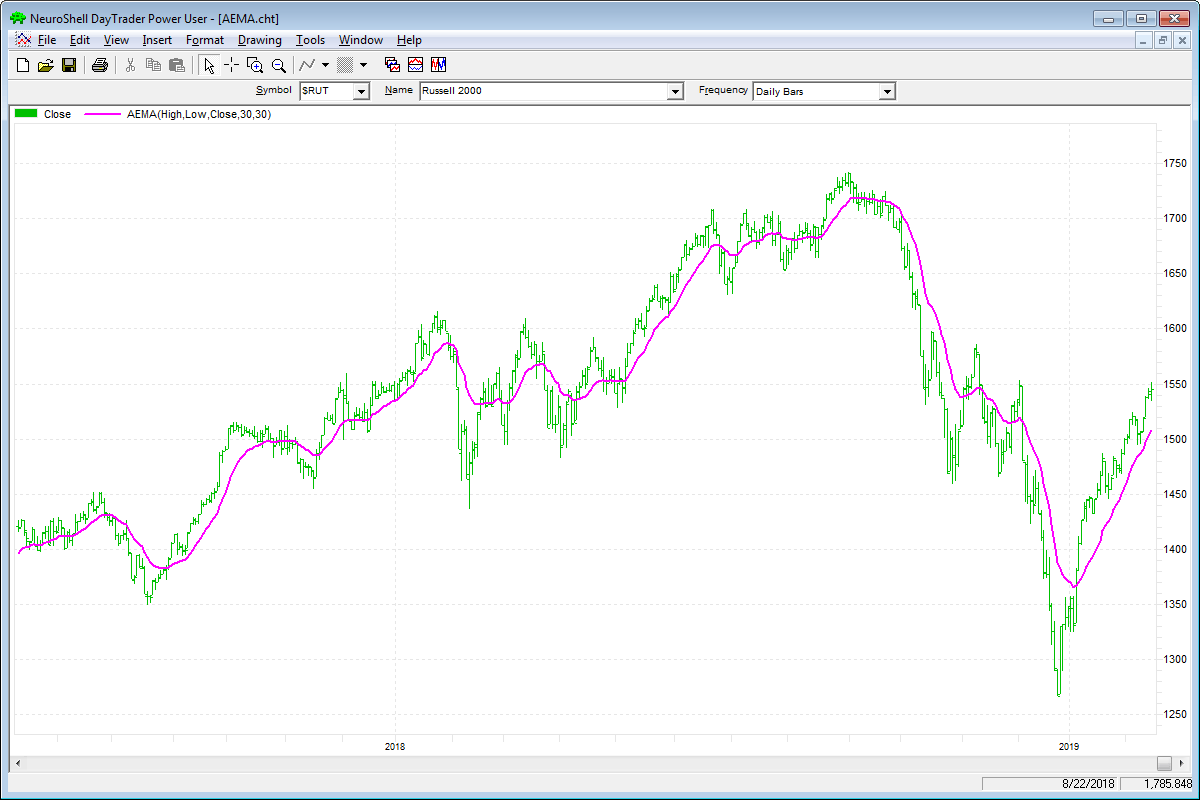
FIGURE 6: NEUROSHELL TRADER. This NeuroShell Trader chart shows adaptive exponential moving averages on a chart of the Russell 2000 Index.
—Marge Sherald,
Ward Systems Group, Inc.
301 662-7950, sales@wardsystems.com
www.neuroshell.com
BACK TO LIST

AIQ: APRIL 2019
The importable AIQ EDS file based on Vitali Apirine’s article in this issue, “Adaptive Exponential Moving Average,” can be obtained on request via email to info@TradersEdgeSystems.com. The code is also shown below.
!ADAPTIVE EXPONENTIAL MOVING AVERAGE
!Author: Vitali Apirine, TASC April 2019
!Coded by: Richard Denning 2/17/2019
!www.TradersEdgeSystems.com

!INPUTS:
AvgLen is 30.
Len is 30.
C is [close].
L is [low].
H is [high].
HH is highresult(H,Len).
LL is lowresult(L,Len).

MLTP1 is (2/ (AvgLen + 1)).
MLTP2 is  ABS((C - LL) - (HH - C)) / (HH - LL).
Rate is MLTP1*(1+MLTP2).

! To stop the recursion we just return the value of Sma after we have looped 240 times into this routine.
DaysInto is ReportDate() - RuleDate().
Stop if DaysInto > 240.
stopAema is iff(stop,Sma, myAema).
myAema is valresult(stopAema,1)+Rate*(C-valresult(stopAema,1)).

!For comparison, exponential
Ema is expavg(C,AvgLen).
Sma is simpleavg(C,AvgLen).

ShowValures if 1.
Figure 7 shows the AEMA(30,30) indicator on a chart of Apple Inc. compared to an exponential moving average EMA(30).

FIGURE 7: AIQ. This shows an example of the AEMA(30,30) and EMA(30) on a chart of Apple Inc (AAPL).
—Richard Denning
info@TradersEdgeSystems.com
for AIQ Systems
BACK TO LIST

TRADERSSTUDIO: APRIL 2019
The importable TradersStudio file based on Vitali Apirine’s article in this issue, “Adaptive Exponential Moving Average,” can be obtained on request via email to info@TradersEdgeSystems.com. The code listing is also shown below.
'ADAPTIVE EXPONENTIAL MOVING AVERAGE
'Author: Vitali Apirine, TASC April 2019
'Coded by: Richard Denning 2/17/2019
'www.TradersEdgeSystems.com

Function AEMA(AvgLen,LBlen)
'AvgLen = 30
'LBlen = 30
Dim HH,LL,MLTP1,MLTP2,Rate
Dim myAEMA As BarArray

HH = Highest(H,LBlen)
LL = Lowest(L,LBlen)

MLTP1 = 2/(AvgLen + 1)
MLTP2 =  Abs((C - LL) - (HH - C)) / (HH - LL)
Rate = MLTP1*(1+MLTP2)

myAEMA = IFF(BarNumber+1<=AvgLen,Average(C,AvgLen),myAEMA[1]+Rate*(C-myAEMA[1]))
AEMA = myAEMA
End Function
'-------------------------------------------------------------------------------
'Code to plot indicator:
sub AEMA_IND(AvgLen,LBlen)
Dim myAEMA As BarArray
myAEMA = AEMA(AvgLen,LBlen)
plot1(myAEMA)
End Sub
Figure 8 shows the AEMA(30,30) indicator on a chart of Apple Inc. compared to an exponential moving average EMA(30).

FIGURE 8: TRADERSSTUDIO. The AEMA(30,30) and EMA(30) are shown on a chart of Apple Inc. (AAPL).
—Richard Denning
info@TradersEdgeSystems.com
for TradersStudio
BACK TO LIST

eSIGNAL: APRIL 2019
For this month’s Traders’ Tip, we’ve provided the study AEMA.efs based on the article in this issue by Vitali Apirine, “Adaptive Exponential Moving Average.” This study can be used to help determine the overall trend of the market.
The studies contain formula parameters that may be configured through the edit chart window (right-click on the chart and select “edit chart”). A sample chart is shown in Figure 9.

FIGURE 9: ESIGNAL. Here is an example of the study plotted on a daily chart of $SPX.
To discuss this study or download a complete copy of the formula code, please visit the EFS library discussion board forum under the forums link from the support menu at www.esignal.com or visit our EFS KnowledgeBase at https://www.esignal.com/support/kb/efs/.
—Eric Lippert
eSignal, an Interactive Data company
800 779-6555, www.eSignal.com
BACK TO LIST
MICROSOFT EXCEL: APRIL 2019
In “Adaptive Exponential Moving Average” in this issue, author Vitali Apirine presents a simple approach to making an exponential moving average (EMA) a bit more reactive than the standard EMA when the current prices are near the highest or lowest prices of the recent past.
The resulting AEMA is able to track closer to significant price movements than a standard EMA, a feature that can assist in detecting turning points a bit earlier that the standard EMA may.
The calculations are quite simple. In the article, Apirine holds the periods and PDS values equal for the main and secondary calculations.
As for the sensitivity of the AEMA calculation, I found it instructive to shuffle things a bit, such as giving the period a value of 50 and giving the PDS a value of 20, and then I did the flip side of that and made the period value 20 and gave the PDS a value of 50.
Note: To avoid a bit of visual confusion, you should try to display the moving averages that correspond to the crossover combination you have selected.
Figure 10 presents a chart demonstrating the EMA(10) and AEMA(10,10) with crossovers. Figure 11 also shows the EMA(50) and AEMA(50,50), but this time from a longer-term perspective, showing fewer reversals.

FIGURE 10: EXCEL. This chart shows an example of the EMA(10) and AEMA(10,10) with crossovers.

FIGURE 11: EXCEL. This also shows the EMA(50) and AEMA(50,50) but this time from a longer-term perspective, showing fewer reversals.
The spreadsheet file for this Traders’ Tip can be downloaded here. To successfully download it, follow these steps:
- Right-click on the Excel file link, then
- Select “save as” (or “save target as”) to place a copy of the spreadsheet file on your hard drive.
—Ron McAllister
Excel and VBA programmer
rpmac_xltt@sprynet.com
BACK TO LIST

AMIBROKER: APRIL 2019
In his article “Adaptive Exponential Moving Average” Vitali Apirine presents an adaptive exponential moving average that changes its smoothing factor based on volatility to react faster to large price movements. Ready-to-use code is provided below.
function AEMA( input, per1, per2 )
{
    mltp1 = 2 / ( per1 + 1 );

    ll = LLV( L, per2 );
    hh = HHV( H, per2 );

    mltp2 = abs( ( ( C - ll ) - ( hh - C ) ) / ( hh - ll ) );

    rate = mltp1 * ( 1 + mltp2 );

    return AMA( input, rate );
}

Plot( C, "Close", colorDefault, styleBar | styleThick );

per1 = Param("period1", 30, 2, 100 );
per2 = Param("period2", 30, 2, 100 );

Plot( AEMA( Close, per1, per2 ), "AEMA"+ _PARAM_VALUES(), colorBlue, styleThick );

Plot( EMA( Close, per1 ), "EMA" + per1, colorRed );
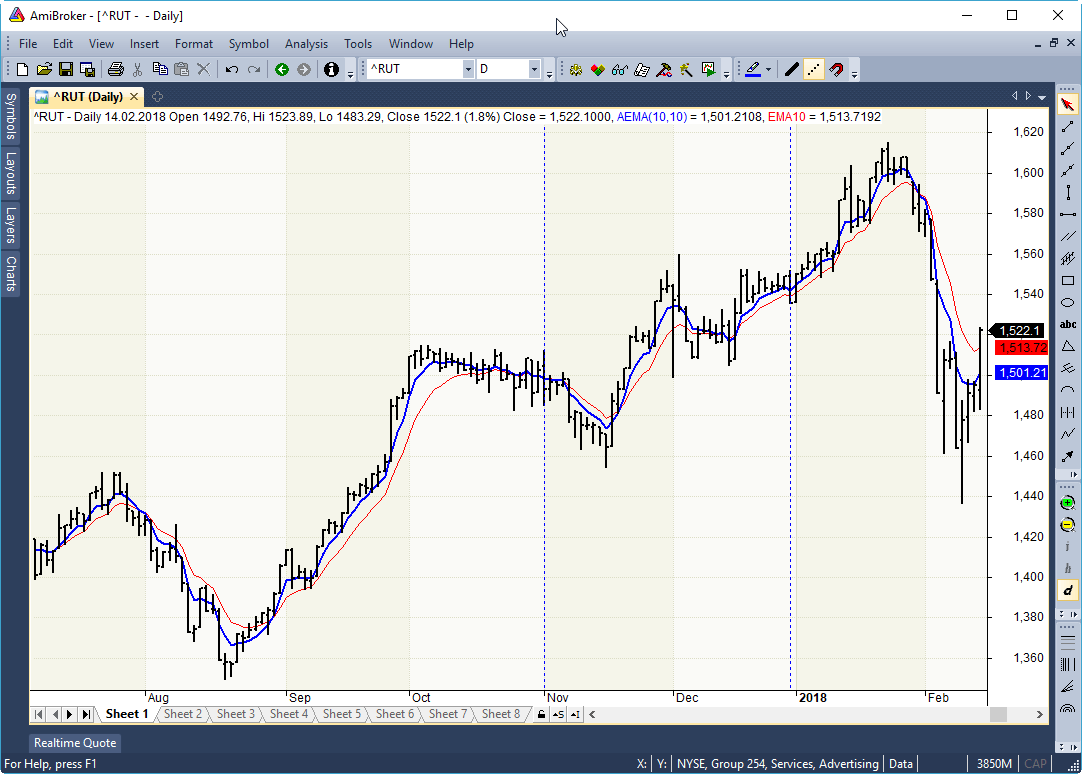
FIGURE 12: AMIBROKER
—Tomasz Janeczko, AmiBroker.com
www.amibroker.com
BACK TO LIST
Originally published in the April 2019 issue of
Technical Analysis of STOCKS & COMMODITIES magazine.
All rights reserved. © Copyright 2019, Technical Analysis, Inc.


