TRADERS’ TIPS
May 2019

For this month’s Traders’ Tips, the focus is Anthony Garner’s article in this issue, “Backtesting A Mean-Reversion Strategy In Python.” Here, we present the May 2019 Traders’ Tips code with possible implementations in various software.
You can right-click on any chart to open it in a new tab or window and view it at it’s originally supplied size, often much larger than the version printed in the magazine.
Python code is also provided by Garner in the article, which S&C subscribers will find in the Article Code section of our website here.
The Traders’ Tips section is provided to help the reader implement a selected technique from an article in this issue or another recent issue. The entries here are contributed by software developers or programmers for software that is capable of customization.

TRADESTATION: MAY 2019
In “Backtesting A Mean-Reversion Strategy In Python” in this issue, author Anthony Garner introduces a strategy based on the concept of buying an oversold asset and selling an overbought asset. To quantify this, he uses the classic z-score calculation. In addition, he adds a component to evaluate the existing trend as well as position sizing to allow for reinvestment.
Here is TradeStation EasyLanguage code for an indicator and strategy based on the author’s concepts. We also included a function for calculating the z-score that can be used in your own code.
Indicator: Z Score
// TASC May 2019
// Mean-Reversion Strategy
// Anthony Garner

inputs:
	Price( Close ),
	ZScoreLength( 10 ),
	EntryLevel( 1 ),
	ExitLevel( .5 ) ;

variables:
	ZS( 0 ) ;

ZS = ZScore( Price, ZScoreLength ) ;

Plot1( ZS, "Z Score" ) ;
Plot2( EntryLevel, "Sell Level" ) ;
Plot3( -EntryLevel, "Buy Level" ) ;
Plot4( ExitLevel, "Exit Short" ) ;
Plot5( -ExitLevel, "Exit Long" ) ;


Strategy: Z Score Mean-Reversion
// TASC May 2019
// Mean-Reversion Strategy
// Anthony Garner

inputs:
	Price( Close ),
	ZScoreLength( 10 ),
	FastAvgLength( 10 ),
	SlowAvgLength( 100 ),
	EntryLevel( 1 ),
	ExitLevel( .5 ),
	InitialCapital( 10000 ),
	LeverageToUse( 2 ),
	MinTradeSize( 100 ),
	MaxTradeSize( 1000 ) ;

variables:
	ZS( 0 ),
	FastAvgValue( 0 ),
	SlowAvgValue( 0 ),
	AccountEquity( 0 ),
	TradeSize( 0 ) ;

ZS = ZScore( Price, ZScoreLength ) ;
FastAvgValue = Average( Close, FastAvgLength ) ;
SlowAvgValue = Average( Close, SlowAvgLength ) ;

AccountEquity = InitialCapital
	+ NetProfit + OpenPositionProfit ;
TradeSize = MinList( MaxList(
	Floor( AccountEquity * LeverageToUse / Close ),
	MinTradeSize ), MaxTradeSize ) ;

if ZS crosses above EntryLevel and
	FastAvgValue < SlowAvgValue then
	SellShort ( "ZS SE" ) TradeSize shares
		next bar at Market
else if ZS crosses below -EntryLevel and
	FastAvgValue > SlowAvgValue then
	Buy ( "ZS LE" ) TradeSize shares
		next bar at Market ;

if FastAvgValue crosses over SlowAvgValue then
	Buy to Cover ( "Trend Chg SX" ) next bar at Market
else if FastAvgValue crosses under SlowAvgValue then
	Sell ( "Trend Chg LX" ) next bar at Market ;

if ZS crosses under ExitLevel then
	Buy to Cover ( "ZS SX" ) next bar at Market
else if ZS crosses over -ExitLevel then
	Sell ( "ZS LX" ) next bar at Market ;


Function: Z Score
// Function Name: ZScore
// Return Type: Double
// Storage: Simple

inputs:
	Price( NumericSeries ),
 	AvgLen( NumericSimple ) ;

ZScore = (Price - Average( Price, AvgLen ) )
 / StandardDev( Price, AvgLen, 1 ) ;
To download the EasyLanguage code, please visit our TradeStation and EasyLanguage support forum. The files for this article can be found here: https://community.tradestation.com/Discussions/Topic.aspx?Topic_ID=156727. The filename is “TASC_MAY2019.ZIP.” For more information about EasyLanguage in general, please see https://www.tradestation.com/EL-FAQ.
A sample chart is shown in Figure 1.

FIGURE 1: TRADESTATION. This example TradeStation chart shows the daily SPY with the mean-reversion strategy and indicator applied.
This article is for informational purposes. No type of trading or investment recommendation, advice, or strategy is being made, given, or in any manner provided by TradeStation Securities or its affiliates.
—Doug McCrary
TradeStation Securities, Inc.
www.TradeStation.com
BACK TO LIST

WEALTH-LAB: MAY 2019
Wealth-Lab owes to C# the power of extensibility and ability to express trading rules of any complexity. However, its strong point is also that no programming may be required to “wire-frame” a trading system idea.
The Strategy Builder in Wealth-Lab lets us throw building blocks known as rules onto a “drawing board,” group them together, or divide them into separate chunks. To put together a strategy based on the concepts presented in Anthony Garner’s article in this issue, “Backtesting A Mean-Reversion Strategy In Python,” you could take actions such as the following:
- Add a few entry buy/sell rules (or short/cover if you prefer).
- Drag and drop some selections of Indicator crosses below (above) a value and pick “ZScore” from the Community Indicators group (requires the Community Indicators library v2019.04 or greater).
- Do the same for fast moving average is above (below) slow moving average to take trades only if the long-term trend is in your favor.
- For the exit, repeat step 2 with an opposite z-score value.
There’s one more exit rule in the Python code that Garner provides in his article, which liquidates positions if the z-score flips from positive to negative or vice versa without going through the neutral zone. As shown in Figure 2, implementing it is a matter of dropping an “OR” divider with a couple of extra conditions below it.
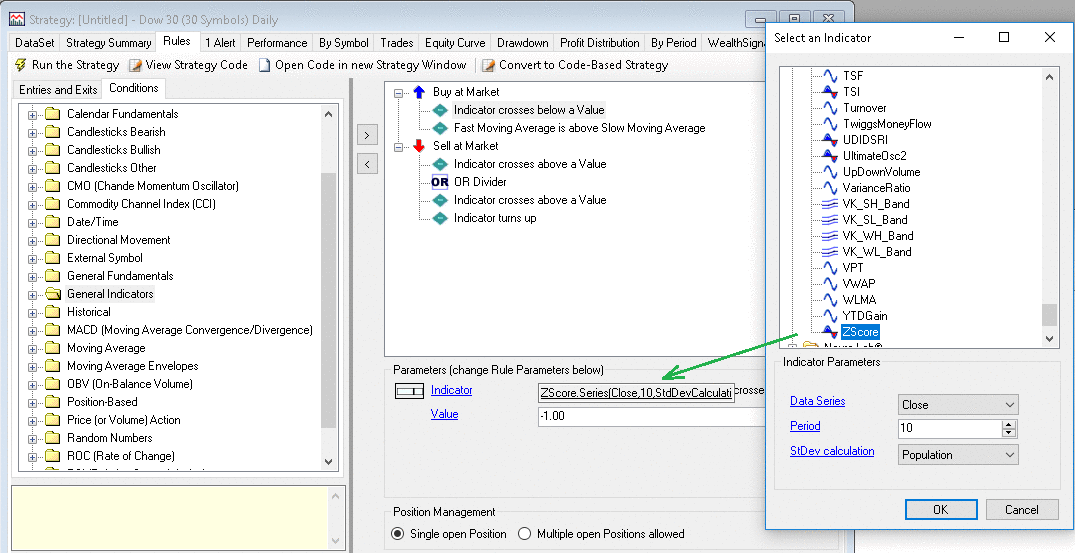
FIGURE 2: WEALTH-LAB. Here is an example of creating a mean-reversion strategy using the rules wizard.
If everything’s done right, your trading system will generate trades similar to those shown in Figure 3. Those of you who prefer C# to take complete control will find a sample strategy code listing here. (This will also be available in the Traders’ Tips section at Traders.com.)
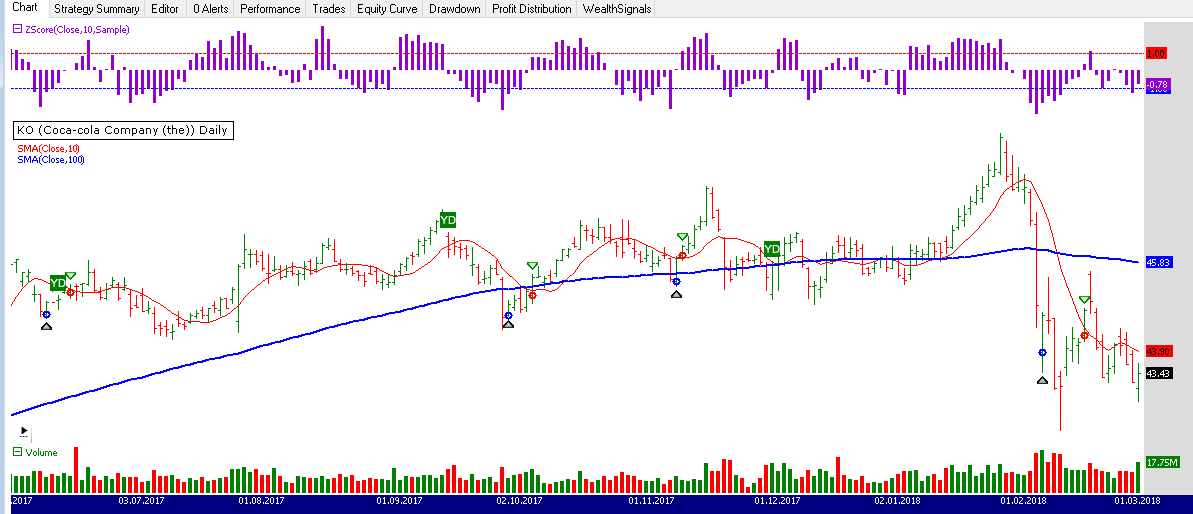
FIGURE 3: WEALTH-LAB. Here are some characteristic trades on a daily chart of Coca-Cola (data provided by Yahoo).
Bottom line: The advantage of Wealth-Lab over software packages that require coding is that we can come up with a mean-reversion system like the one presented by Garner’s article in just a few minutes’ time.
using System;
using System.Collections.Generic;
using System.Text;
using System.Drawing;
using WealthLab;
using WealthLab.Indicators;
using Community.Indicators;

namespace WealthLab.Strategies
{
	public class MeanReversion : WealthScript
	{
		private StrategyParameter paramPeriod;

		public MeanReversion()
		{
			paramPeriod = CreateParameter("Period", 10, 5, 30, 5);
		}

		protected override void Execute()
		{
			int period = paramPeriod.ValueInt;
			int lmaPeriod = period * 10;

			SMA sma = SMA.Series( Close, period );
			SMA lma = SMA.Series( Close, lmaPeriod );
			DataSeries zscore = ZScore.Series( Close, period, StdDevCalculation.Sample );
			PlotSeries( PricePane, sma, Color.Red, LineStyle.Solid, 1 );
			PlotSeries( PricePane, lma, Color.Blue, LineStyle.Solid, 2 );

			ChartPane zPane = CreatePane( 30, true, true );
			PlotSeries( zPane, zscore, Color.DarkViolet, LineStyle.Histogram, 3 );
			DrawHorzLine( zPane, 1.0, Color.Red, LineStyle.Dashed, 1 );
			DrawHorzLine( zPane, -1.0, Color.Blue, LineStyle.Dashed, 1 );

			/* The trigger is a move up or down by more than one standard deviation from the 10-day average price:
			a z-score of over +1 triggers a sell and a z-score of less than -1 triggers a buy. */

			for(int bar = GetTradingLoopStartBar(1); bar < Bars.Count; bar++)
			{
				if ( IsLastPositionActive )
				{
					/* exit all positions if zscore flips from positive to negative or vice versa
					without going through the neutral zone */
					if( (zscore[bar - 1] < -0.5 && zscore[bar] > 0.5) ||
						// Clear positions if the z-score between -.5 and .5
						Math.Abs(zscore[bar]) < 0.5 )
						SellAtMarket( bar+1, LastPosition );
				}
				else
				{
					/* Buy long if the z-score is < -2 and the longer term trend is positive */
					if( zscore[bar] < -2 && sma[bar] > lma[bar])
						BuyAtMarket( bar+1 );
				}
			}
		}
	}
}
—Gene (Eugene) Geren), Wealth-Lab team
MS123, LLC
www.wealth-lab.com
BACK TO LIST

METASTOCK: MAY 2019
Anthony Garner’s article in this issue, “Backtesting A Mean-Reversion Strategy In Python,” presents a trading system and the code to backtest it using the Python language. The code to test the system in MetaStock is provided here.
General tab:
Name: Mean-Reversion Strategy
Notes:
Based on code provided by Anthony Garner
Buy Order tab:
Formula:
length:= 10;
sma:= mov(c,length, S);
lma:= mov(c, length*10, s);
dev:= std(c, length);
z:= (C - sma)/dev;
(z < -1) AND (sma > lma)

Sell Order tab:
Formula:
length:= 10;
sma:= mov(c,length, S);
lma:= mov(c, length*10, s);
dev:= std(c, length);
z:= (C - sma)/dev;
z > -0.5

Sell Short Order tab:
Formula:
length:= 10;
sma:= mov(c,length, S);
lma:= mov(c, length*10, s);
dev:= std(c, length);
z:= (C - sma)/dev;
(z > 1) AND (sma < lma)
—William Golson
MetaStock Technical Support
www.metastock.com
BACK TO LIST

THINKORSWIM: MAY 2019
We have put together a strategy for thinkorswim based on Anthony Garner’s article “Backtesting A Mean-Reversion Strategy In Python.” The strategy is built using our proprietary scripting language, thinkscript, as opposed to Python. To ease the loading process, simply click on https://tos.mx/rIy6Qv or enter the address into a web browser and then click open shared item from within thinkorswim. Choose view thinkscript and name it “SimpleMeanReversion.” This can then be added to your chart.
A sample chart is shown in Figure 4.

FIGURE 4: THINKORSWIM. This shows the strategy added to a daily chart of SPY for the timeframe beginning in 1993 until the middle of March 2019.
—thinkorswim
A division of TD Ameritrade, Inc.
www.thinkorswim.com
BACK TO LIST

NINJATRADER: MAY 2019
The MeanReversal strategy that is discussed in “Backtesting A Mean-Reversion Strategy In Python” in this issue by Anthony Garner is available for download at the following links for NinjaTrader 8 and NinjaTrader 7:
Once the file is downloaded, you can import the strategy in NinjaTader 8 from within the control center by selecting Tools → Import → NinjaScript Add-On and then selecting the downloaded file for NinjaTrader 8. To import into NinjaTrader 7, from within the control center window, select the menu File → Utilities → Import NinjaScript and select the downloaded file.
You can review the strategy’s source code in NinjaTrader 8 by selecting the menu New → NinjaScript Editor → Strategies from within the control center window and selecting the MeanReversal file. You can review the strategy’s source code in NinjaTrader 7 by selecting the menu Tools → Edit NinjaScript → Strategy from within the control center window and selecting the MeanReversal file.
NinjaScript uses compiled DLLs that run native, not interpreted, to provide you with the highest performance possible.
A sample chart implementing the strategy is shown in Figure 5.

FIGURE 5: NINJATRADER. Here, the MeanReversal shows some successful long trades in the NinjaTrader 8 Strategy Analyzer between August 2017 and October 2017 on SPY.
—Raymond Deux & Jim Dooms
NinjaTrader, LLC
www.ninjatrader.com
BACK TO LIST

NEUROSHELL TRADER: MAY 2019
The mean-reversion strategy described by Anthony Garner in his article in this issue, “Backtesting A Mean-Reversion Strategy In Python,” can be easily implemented in NeuroShell Trader by combining a few of NeuroShell Trader’s 800+ indicators. Simply select “New trading strategy” from the insert menu and enter the following in the appropriate locations of the trading strategy wizard:
BUY LONG CONDITIONS: [All of which must be true]
     CrossBelow(StndNormZScore(Close,10),-1)
     A>B(Avg(Close,10),Avg(Close,100))
     A<B(Lag(StndNormZScore(Close,10),1),0.5)

SELL LONG CONDITIONS: [All of which must be true]
     CrossAbove(StndNormZScore(Close,10),0.5)

SELL SHORT CONDITIONS: [All of which must be true]
     CrossAbove(StndNormZScore(Close,10),1)
     A<B(Avg(Close,10),Avg(Close,100))
     A>B(Lag(StndNormZScore(Close,10),1),-0.5)

COVER SHORT CONDITIONS: [All of which must be true]
     CrossBelow(StndNormZScore(Close,10),0.5)

POSITION SIZING METHOD:
     Percent of Account
          100.00% of account balance
If you choose to use pyramiding or slippage, those can be set up in the trading parameters dialog as well. After entering the system conditions, you can also choose whether the parameters should be genetically optimized. After backtesting the trading strategy, use the detailed analysis button to view the backtest and trade-by-trade statistics for the system.
Users of NeuroShell Trader can go to the Stocks & Commodities section of the NeuroShell Trader free technical support website to download a copy of this or any previous Traders’ Tips.
A sample chart is shown in Figure 6.

FIGURE 6: NEUROSHELL TRADER. This NeuroShell Trader chart displays the mean-reversion strategy applied to SPY.
—Marge Sherald, Ward Systems Group, Inc.
301 662-7950, sales@wardsystems.com
www.neuroshell.com
BACK TO LIST

TRADE NAVIGATOR: MAY 2019
To make it easy to implement the concepts presented in “Backtesting A Mean-Reversion Strategy In Python” by Anthony Garner in this issue, we’ve created a special file that can be downloaded in Trade Navigator.
The file name for this library is “SC201905.” To download it, click on Trade Navigator’s blue telephone button, select download special file, and replace the word “upgrade” with “SC201905” (without the quotes). Then click the start button. When prompted to upgrade, click the yes button. If prompted to close all software, click on the continue button. Your library will now download.
The library contains a prebuilt strategy called “mean-reversion strategy” based on the article. This prebuilt strategy can be overlaid onto your chart by opening the charting dropdown menu, selecting the add to chart command, then selecting the strategies tab.
If you have any difficulty importing the library or using the strategy, users may contact our technical support staff by phone or by live chat. The live chat tool is located under Trade Navigator’s help menu, or near the top of the homepage. Support hours are M-F 8am-8pm US Eastern Time. Happy Trading!
—Genesis Financial Technologies
Tech support 719 884-0245
www.TradeNavigator.com
BACK TO LIST

AIQ: MAY 2019
The importable AIQ EDS file based on Anthony Garner’s article in this issue, “Backtesting A Mean-Reversion Strategy In Python,” can be obtained on request via email to info@TradersEdgeSystems.com. The code is also shown below.
I backtested the author’s mean-reversion system (MeanRev.eds) using both the EDS module, which tests every trade on a one-share basis, and also via the Portfolio Manager, which performs a trading simulation. The short side strategy showed a loss overall in the EDS test so I tested only the long side in the Portfolio Manager. I selected trades using the z-score, taking the lowest values. For capitalization, I used max of three trades per day with a max total of 10 open trades at one time, 10% allocated to each position. I did not deduct slippage but did deduct commissions. I used a recent list of the NASDAQ 100 stocks to run the test. The equity curve and account statistics report are shown in Figure 7.

FIGURE 7: AIQ. This shows the equity curve (blue line) from long-only trading the NASDAQ 100 list of stocks from 1999 to March 15, 2019. The red line is the NDX index.
!Backtesting a Mean-Reversion Strategy In Python
!Author: Anthony Garner, TASC May 2019
!Coded by: Richard Denning 3/14/19
!www.TradersEdgeSystems.com

!ABBREVIATIONS:
C is [close].

!INPUTS:
meanLen is 10.
longZmult is -1.
shortZmult is 1.
meanMult is 10.

!FORMULAS:
SMA is simpleavg(C,meanLen).
LMA is simpleavg(C,meanLen*meanMult).
STD is sqrt(variance(C,meanLen)).
zScore is (C - SMA) / STD.

!TRADING SIGNALS & EXITS:
buyLong if zScore < longZmult and SMA > LMA.
sellShort if zScore > shortZmult and SMA < LMA.
exitLong if valresult(zScore,1) < -0.5 and zScore > 0.5.
exitShort if valresult(zScore,1) > 0.5 and zScore < -0.5.

showValues if 1.
—Richard Denning
info@TradersEdgeSystems.com
for AIQ Systems
BACK TO LIST

TRADERSSTUDIO: MAY 2019
The importable TradersStudio file based on Anthony Garner’s article in this issue, “Backtesting A Mean-Reversion Strategy In Python,” can be obtained on request via email to info@TradersEdgeSystems.com. The code is also shown below.
After coding the system given in the article in TradersStudio, I ran a quick optimization trading the Nasdaq 100 list of stocks. The results showed the short moving average parameter should be changed to 20 from 10, with the other parameters staying the same. Figures 8 and 9 show the results of trading a constant 200 shares of each stock with parameters (20,-1,10) trading the long-only side. I did not code or test the short side.
'Backtesting a Mean-Reversion Strategy In Python
'Author: Anthony Garner, TASC May 2019
'Coded by: Richard Denning 3/14/19
'www.TradersEdgeSystems.com

sub MEAN_REV(meanLen,longZmult,meanMult)

'INPUTS:
'meanLen = 20,longZmult = -1,meanMult = 10

Dim SMA As BarArray
Dim LMA As BarArray
Dim STD As BarArray
Dim zScore As BarArray

'FORMULAS:
SMA = Average(C,meanLen)
LMA = Average(C,meanLen*meanMult)
STD = StdDevS(C,meanLen)
zScore = (C - SMA) / STD

'TRADING SIGNALS & EXITS:
If zScore < longZmult And SMA > LMA Then Buy("LE",1,0,Market,Day)
If zScore[1] < -0.5 And zScore > 0.5 Then ExitLong("LX","",1,0,Market,Day)

End Sub
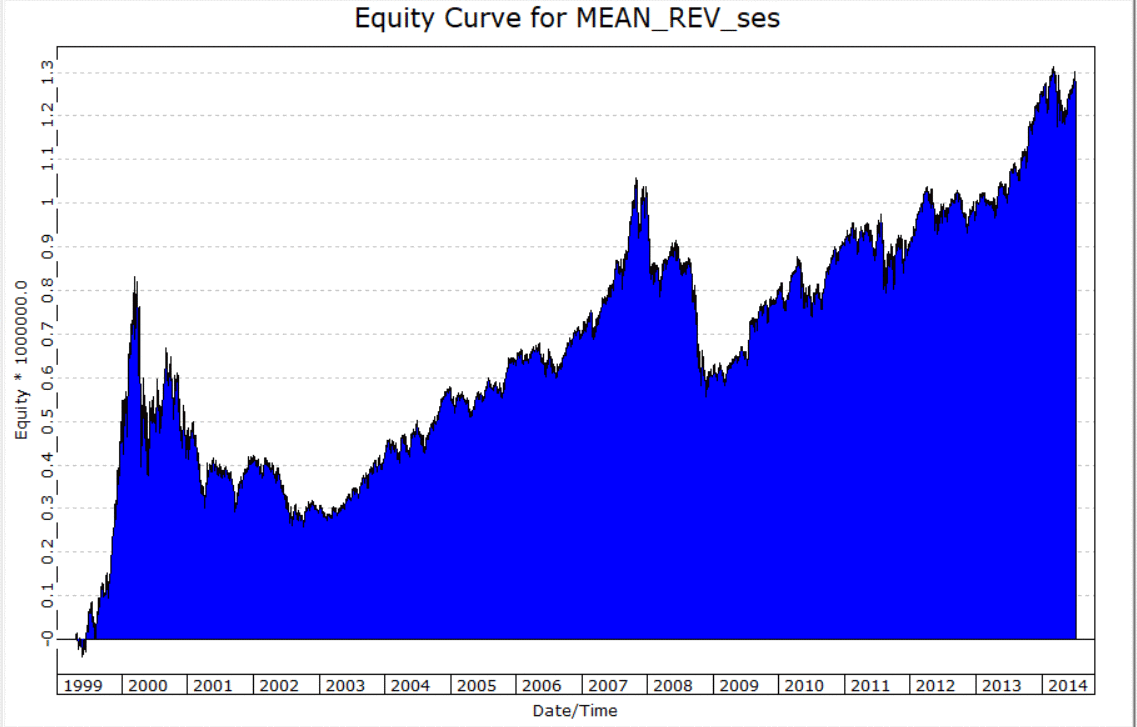
FIGURE 8: TRADERSSTUDIO. This shows the equity curve for MEAN_REV_ses (20,-1,10), long-only trading 200 shares of each of the stocks in the NASDAQ 100 for the period 1999 to 2014.
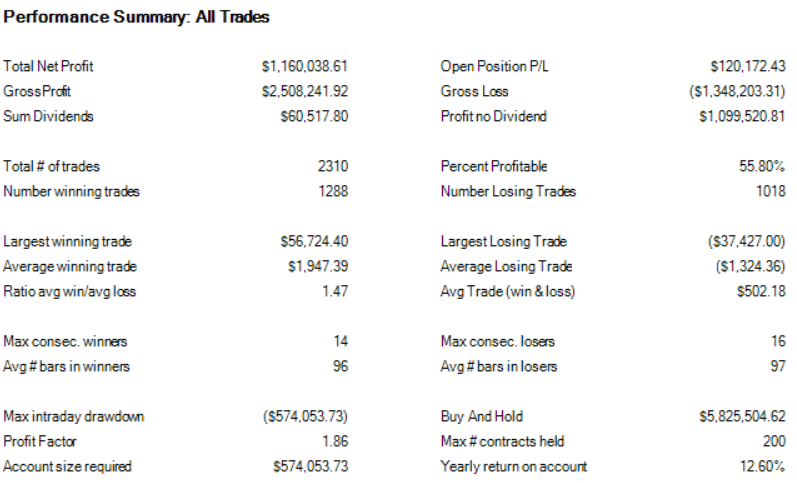
FIGURE 9: TRADERSSTUDIO. This shows the summary report for MEAN_REV_ses (20,-1,10), long-only trading 200 shares of each of the stocks in the NASDAQ 100 for the period 1999 to 2014.
—Richard Denning
info@TradersEdgeSystems.com
for TradersStudio
BACK TO LIST
MICROSOFT EXCEL: MAY 2019
In “Backtesting A Mean-Reversion Strategy In Python” in this issue, Anthony Garner outlines a simple mean-reversion strategy and the logic to test it.

FIGURE 10: EXCEL. Price action is shown with z-score decision boundaries highlighted.
He includes a number of settings that can be used to customize the results. which I have implemented in Excel (Figure 10). Some of the controls need a bit of explaining:
The % of equity actually controls the number of shares in a given transaction, as it is the main driver in the calculation of fixed fraction, which is the number of shares you can buy with that percentage of your current equity.
Max position (Figure 11) sets a “soft” high-water mark in that once you have more shares (long or short) than this number, you will not add any more. But your first purchase or short sale may have exceeded this max by quite a bit.

FIGURE 11: EXCEL. Here, the equity with max position control is set to 1.
You can play with the user controls. Enjoy!
The spreadsheet file for this Traders’ Tip can be downloaded here. To successfully download it, follow these steps:
- Right-click on the Excel file link, then
- Select “save as” (or “save target as”) to place a copy of the spreadsheet file on your hard drive.
—Ron McAllister
Excel and VBA programmer
rpmac_xltt@sprynet.com
BACK TO LIST
Originally published in the May 2019 issue of
Technical Analysis of STOCKS & COMMODITIES magazine.
All rights reserved. © Copyright 2019, Technical Analysis, Inc.


