TRADERS’ TIPS
July 2019

The focus of Traders’ Tips this month is Vitali Apirine’s article in this issue, “Exponential Deviation Bands.” Here, we present the July 2019 Traders’ Tips code with possible implementations in various software.
You can right-click on any chart to open it in a new tab or window and view it at it’s originally supplied size, often much larger than the version printed in the magazine.
The Traders’ Tips section is provided to help the reader implement a selected technique from an article in this issue or another recent issue. The entries here are contributed by software developers or programmers for software that is capable of customization.

TRADESTATION: JULY 2019
In “Exponential Deviation Bands” in this issue, author Vitali Apirine introduces a price band indicator based on exponential deviation rather than the more traditional standard deviation, such as is used in the well-known Bollinger Bands. As compared to standard deviation bands, the author’s exponential deviation bands apply more weight to recent data and generate fewer breakouts. Apirine describes using the bands as a tool to assist in identifying trends.
Here, we are providing TradeStation EasyLanguage code for an indicator based on Apirine’s concepts. This code can be downloaded by visiting our TradeStation and EasyLanguage support forum at https://community.tradestation.com/Discussions/Topic.aspx?Topic_ID=156727. The filename is “TASC_JUL2019.ZIP.”
For more information about EasyLanguage in general, please see https://www.tradestation.com/EL-FAQ.
A sample chart is shown in Figure 1.

FIGURE 1: TRADESTATION. This shows a daily chart of the NYSE Composite Index with the exponential deviation bands indicator applied.
Indicator: Exponential Deviation Bands

// TASC JUL 2019
// Exponential Deviation Bands
// Vitali Apirine


inputs:
	Periods( 20 ),
	DevMult( 2 ),
	UseSMA( false ) ;

variables:
	XAvgValue( 0 ),
	SAvgValue( 0 ),
	AvgVAlue( 0 ),
	ED( 0 ),
	PD( 0 ),
	MLTP( 0 ),
	UpperBand( 0 ),
	LowerBand( 0 ) ;

once
begin
	MLTP = 2 / ( Periods + 1 ) ;
end ;

XAvgValue = XAverage( Close, Periods ) ;
SAvgValue = Average( Close, Periods ) ;

if UseSMA then
begin
	AvgValue = SAvgValue ;
end
else
	AvgValue = XAvgValue ;

PD = AbsValue( AvgValue - Close ) ;
ED = PD * MLTP + ED[1] * ( 1 - MLTP ) ;
UpperBand = AvgValue + ED * DevMult ;
LowerBAnd = AvgValue - ED * DevMult ;

if CurrentBar > Periods  then
begin
	Plot1( AvgVAlue, "Avg" ) ;
	Plot2( UpperBand, "Upper ExDev Band" ) ;
	Plot3( LowerBand, "Lower ExDev Band" ) ;
end ;
This article is for informational purposes. No type of trading or investment recommendation, advice, or strategy is being made, given, or in any manner provided by TradeStation Securities or its affiliates.
—Doug McCrary
TradeStation Securities, Inc.
www.TradeStation.com
BACK TO LIST

QUANTACULA: JULY 2019
We’ve added the exponential deviation bands that are described by Vitali Apirine in his article in this issue to the TASC Extensions for Quantacula. That way, the bands are available as built-in indicators on Quantacula.com and in Quantacula Studio.
We quickly mocked up a drag & drop model using these bands, which appeared to consistently work to identify profitable entries and exits. We used the following rules:
- Buy next bar at market if closing price crosses below the lower ExpDevBandLower
- Sell at limit price equal to the current value of the ExpDevBandUpper.
Figure 2 shows a representative chart of the model on MSFT showing three trades occurring as the stock oscillates. Figure 3 shows the model mocked up in the drag & drop model builder.

FIGURE 2: QUANTACULA STUDIO. This sample chart demonstrates three profitable trades in a sideways market using exponential deviation bands.
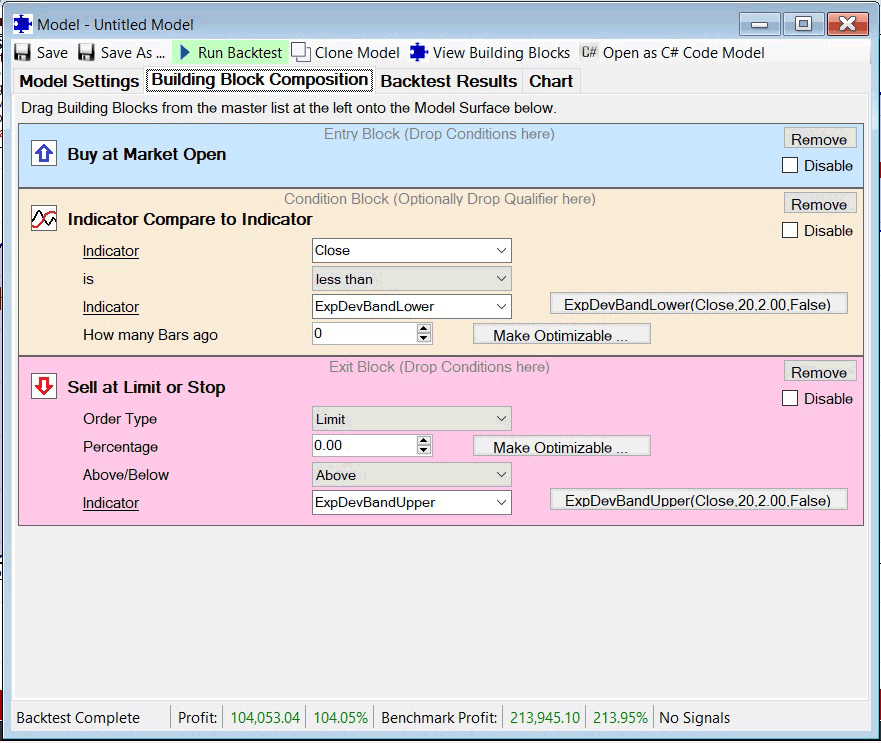
FIGURE 3: QUANTACULA STUDIO. This demonstrates building the exponential deviation bands model in Quantacula Studio’s drag & drop model builder.
—Dion Kurczek, Quantacula LLC
info@quantacula.com
www.quantacula.com
BACK TO LIST

eSIGNAL: JULY 2019
For this month’s Traders’ Tip, we’ve provided the study Exponential_Deviation_Bands.efs based on the article by Vatali Apirine in this issue, “Exponential Deviation Bands.” This study can be used to help identify the underlying trend.
The study contains formula parameters that may be configured through the edit chart window (right-click on the chart and select “edit chart”). A sample chart is shown in Figure 4.

FIGURE 4: eSIGNAL. Here is an example of the study plotted on a daily chart of $NYA.
To discuss this study or download a complete copy of the formula code, please visit the EFS library discussion board forum under the forums link from the support menu at www.esignal.com or visit our EFS KnowledgeBase at www.esignal.com/support/kb/efs/. The eSignal formula script (EFS) is shown below.
/**********************************
Provided By:
Copyright 2019 Intercontinental Exchange, Inc. All Rights Reserved.
eSignal is a service mark and/or a registered service mark of Intercontinental Exchange, Inc.
in the United States and/or other countries. This sample eSignal Formula Script (EFS)
is for educational purposes only.
Intercontinental Exchange, Inc. reserves the right to modify and overwrite this EFS file with each new release.

Description:
   Exponential Deviation Bands
   by Vitali Apirine


Version:            1.00  05/13/2019

Formula Parameters:                     Default:
Periods                                 20
Type                                    Simple

Notes:
The related article is copyrighted material. If you are not a subscriber
of Stocks & Commodities, please visit www.traders.com.

**********************************/


var fpArray = new Array();

function preMain(){
    setPriceStudy(true);
    setStudyTitle("Exponential Deviation Bands");
    setCursorLabelName("Upper", 0);
    setCursorLabelName("Basis", 1);
    setCursorLabelName("Lower", 2);
    setPlotType(PLOTTYPE_LINE);
    setDefaultBarFgColor(Color.RGB(0x00,0x94,0xFF),0);
    setDefaultBarFgColor(Color.RGB(0xFE,0x69,0x00),1);
    setDefaultBarFgColor(Color.RGB(0x00,0x94,0xFF),2);


    var x = 0;
    fpArray[x] = new FunctionParameter("Periods", FunctionParameter.NUMBER);
	with(fpArray[x++]){
        setName("Periods");
        setLowerLimit(1);
        setDefault(20);
        }
    fpArray[x] = new FunctionParameter("Type", FunctionParameter.STRING);
	with(fpArray[x++]){
        setName("Type");
        addOption("Simple");
        addOption("Exponential")
        setDefault("Simple");
        }

}

var bInit = false;
var bVersion = null;
var xClose = null;
var xMA = null;
var vRate = null;
var vDev = null;
var vED = null;
var vED_1 = null;
var vMDev = null;

function main(Periods, Type){
    if (bVersion == null) bVersion = verify();
    if (bVersion == false) return;

    if (getBarState() == BARSTATE_ALLBARS){
        bInit = false;
    }

    if (getCurrentBarCount() < Periods) return;

    if (!bInit){

        xClose = close();
        vRate = 2 / ( Periods + 1 );
        vED_1 = 0;
        vED = 0;

        switch (Type) {
            case "Simple":
                xMA = sma(Periods);
                break;
            case "Exponential":
                xMA = ema(Periods);
                break;
        }
        bInit = true;
    }

    if (getBarState() == BARSTATE_NEWBAR)   {
        vED_1 = vED;
        vED = 0;
    }
    if (xMA.getValue(0) == null) return;
    vDev = Math.abs(xMA.getValue(0) - xClose.getValue(0));
    vMDev = 0;
    for (var i = 0; i < Periods; i++) {
        vMDev = vMDev + (Math.abs(xMA.getValue(0) - xClose.getValue(-i)));
    }
    vMDev = vMDev / Periods;

    if (vED_1 == 0  ){
        vED_1 = vMDev;
        vED = vMDev;
    }
    else vED = vDev * vRate + vED_1 * (1 - vRate);

    return [xMA.getValue(0) + (2 * vED),xMA.getValue(0), xMA.getValue(0) - (2 * vED)]
}


function verify(){
    var b = false;
    if (getBuildNumber() < 779){

        drawTextAbsolute(5, 35, "This study requires version 10.6 or later.",
            Color.white, Color.blue, Text.RELATIVETOBOTTOM|Text.RELATIVETOLEFT|Text.BOLD|Text.LEFT,
            null, 13, "error");
        drawTextAbsolute(5, 20, "Click HERE to upgrade.@URL=https://www.esignal.com/download/default.asp",
            Color.white, Color.blue, Text.RELATIVETOBOTTOM|Text.RELATIVETOLEFT|Text.BOLD|Text.LEFT,
            null, 13, "upgrade");
        return b;
    }
    else
        b = true;

    return b;
}
—Eric Lippert
eSignal, an Interactive Data company
800 779-6555, www.eSignal.com
BACK TO LIST

WEALTH-LAB: JULY 2019
Although author Vitali Apirine hasn’t provided a trading system in his article “Exponential Deviation Bands” this time, the exponential deviation bands he presents are similar in application to other bands like Bollinger Bands, yet are more responsive to price action.
One of the possible approaches to trading with them is during a rangebound market. Our simple system’s concept is based on the ADX indicator’s trait. A declining ADX indicates a less directional market, which may be approached with a swing trading system. In the flat market, an entry can be made when the lower band is violated—and with an upsurge in the ADX ending that trade.
Entry rules:
- Buy at limit at the lower exponential deviation band if ADX is less than it was 10 bars ago.
Exit rules:
- Sell on the open after 10 bars in the trade.
- Sell on the open if the ADX rises above its value 10 bars ago.
As you can see in the sample chart shown in Figure 5, Walmart was trading in ranges during our in-sample period from 1/1/2000 to 1/1/2010 (at the bottom). The system was able to beat the market (see equity in the top half of the chart). In Figure 6, both good and bad example trades are shown on a daily chart of WMT.
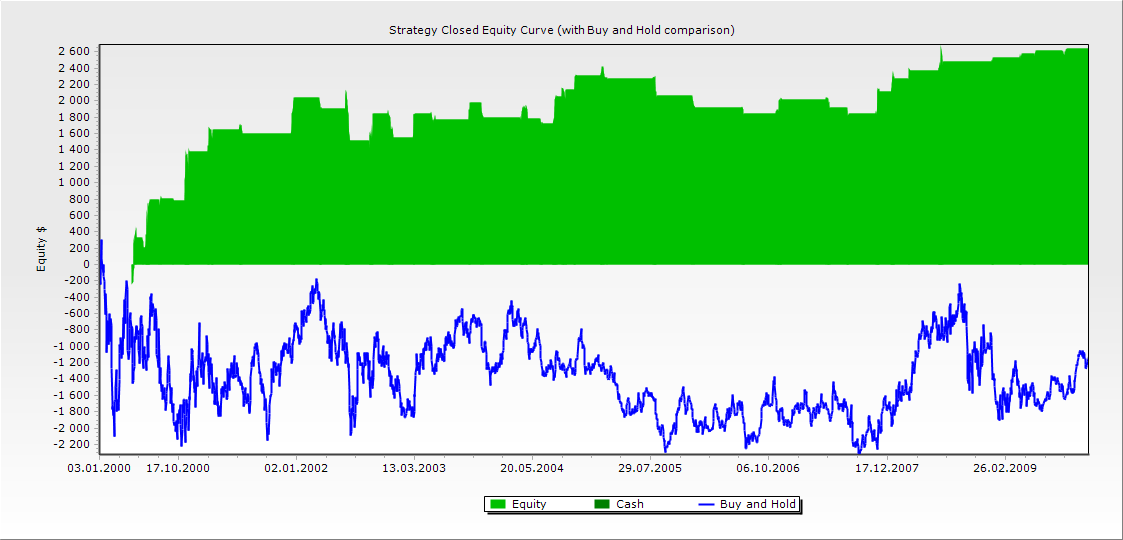
FIGURE 5: WEALTH-LAB. Walmart was trading in ranges during our in-sample period from 1/1/2000 to 1/1/2010 (at the bottom). The system was able to beat the market (see equity in the top half of the chart).
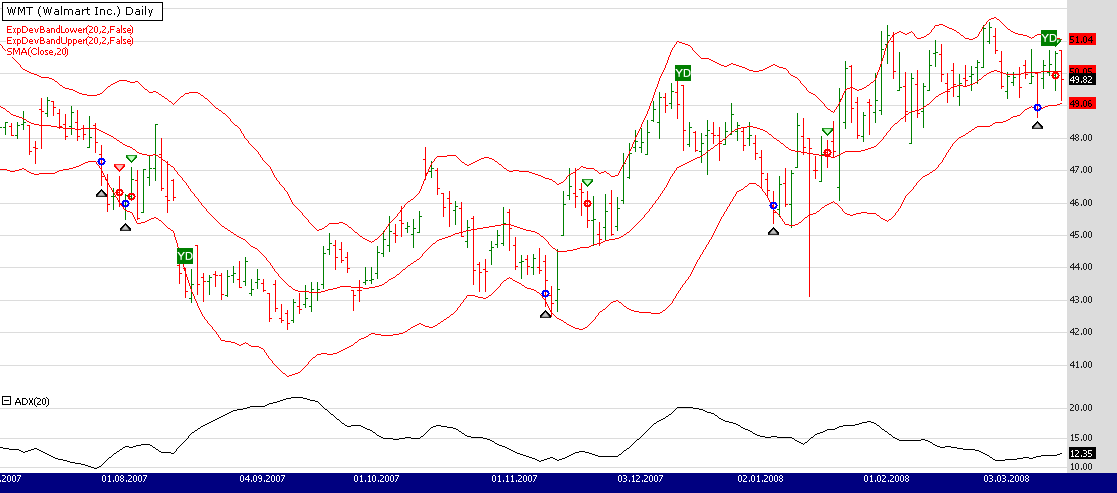
FIGURE 6: WEALTH-LAB. Here, both good and bad example trades are shown on a daily chart of WMT (data provided by Yahoo).
To use these bands, install (or update) the TASCIndicators library to its most-recent version from our website or using the built-in extension manager. Once you see “ExpDevBandLower” and “ExpDevBandUpper” listed under the TASC Magazine Indicators group, they’re ready for use in Wealth-Lab.
C# Code
using System;
using System.Collections.Generic;
using System.Text;
using System.Drawing;
using WealthLab;
using WealthLab.Indicators;
using TASCIndicators;

namespace WealthLab.Strategies
{
	public class TASCJuly2019 : WealthScript
	{
		private StrategyParameter paramPeriod;
		private StrategyParameter paramDev;
		private StrategyParameter paramExit;

		public TASCJuly2019()
		{
			paramPeriod = CreateParameter("Period",20,10,100,10);
			paramDev = CreateParameter("Deviations",2,0.5,4,0.5);
			paramExit = CreateParameter("Exit after",10,2,40,2);
		}

		protected override void Execute()
		{
			var period = paramPeriod.ValueInt;
			var dev = paramDev.Value;
			int exitAfter = paramExit.ValueInt;

			var adx = ADX.Series( Bars, period);
			var ma = SMA.Series( Close, period);
			var ebu = ExpDevBandUpper.Series( Close, period,dev,false);
			var ebl = ExpDevBandLower.Series( Close, period,dev,false);

			ChartPane adxPane = CreatePane( 20, false, true);
			PlotSeries( adxPane, adx, Color.Black, LineStyle.Solid, 1);
			PlotSeriesFillBand( PricePane, ebl,ebu,Color.Red,Color.Transparent,LineStyle.Solid,1);
			PlotSeries( PricePane, ma, Color.Red, LineStyle.Solid, 1 );
			HideVolume();

			for(int bar = GetTradingLoopStartBar(1); bar < Bars.Count; bar++)
			{
				if (IsLastPositionActive)
				{
					Position p = LastPosition;

					if (bar+1 - p.EntryBar >= exitAfter)
						SellAtMarket( bar+1, p, "Timed exit");
					else
						if(adx[bar] > adx[bar - 10] )
							ExitAtMarket( bar+1, p, "Trend alert");
				}
				else
				{
					if(adx[bar] < adx[bar - period])
						BuyAtLimit( bar+1, ebl[bar]);
				}
			}
		}
	}
}
—Eugene (Gene Geren), Wealth-Lab team
MS123, LLC
www.wealth-lab.com
BACK TO LIST

NINJATRADER: JULY 2019
The exponential deviation bands indicator, as discussed in the article by Vitali Apirine in this issue, is available for download at the following links for NinjaTrader 8 and NinjaTrader 7:
Once the file is downloaded, you can import the indicator into NinjaTader 8 from within the control center by selecting Tools → Import → NinjaScript Add-On and then selecting the downloaded file for NinjaTrader 8. To import into NinjaTrader 7, from within the control center window, select the menu File → Utilities → Import NinjaScript and select the downloaded file.
You can review the indicator’s source code in NinjaTrader 8 by selecting the menu New → NinjaScript Editor → Indicators from within the control center window and selecting the “exponential deviation bands” file. You can review the indicator’s source code in NinjaTrader 7 by selecting the menu Tools → Edit NinjaScript → Indicator from within the control center window and selecting the “exponential deviation bands” file.
NinjaScript uses compiled DLLs that run native, not interpreted, which provides you with the highest performance possible.
A sample chart implementing the strategy is shown in Figure 7.
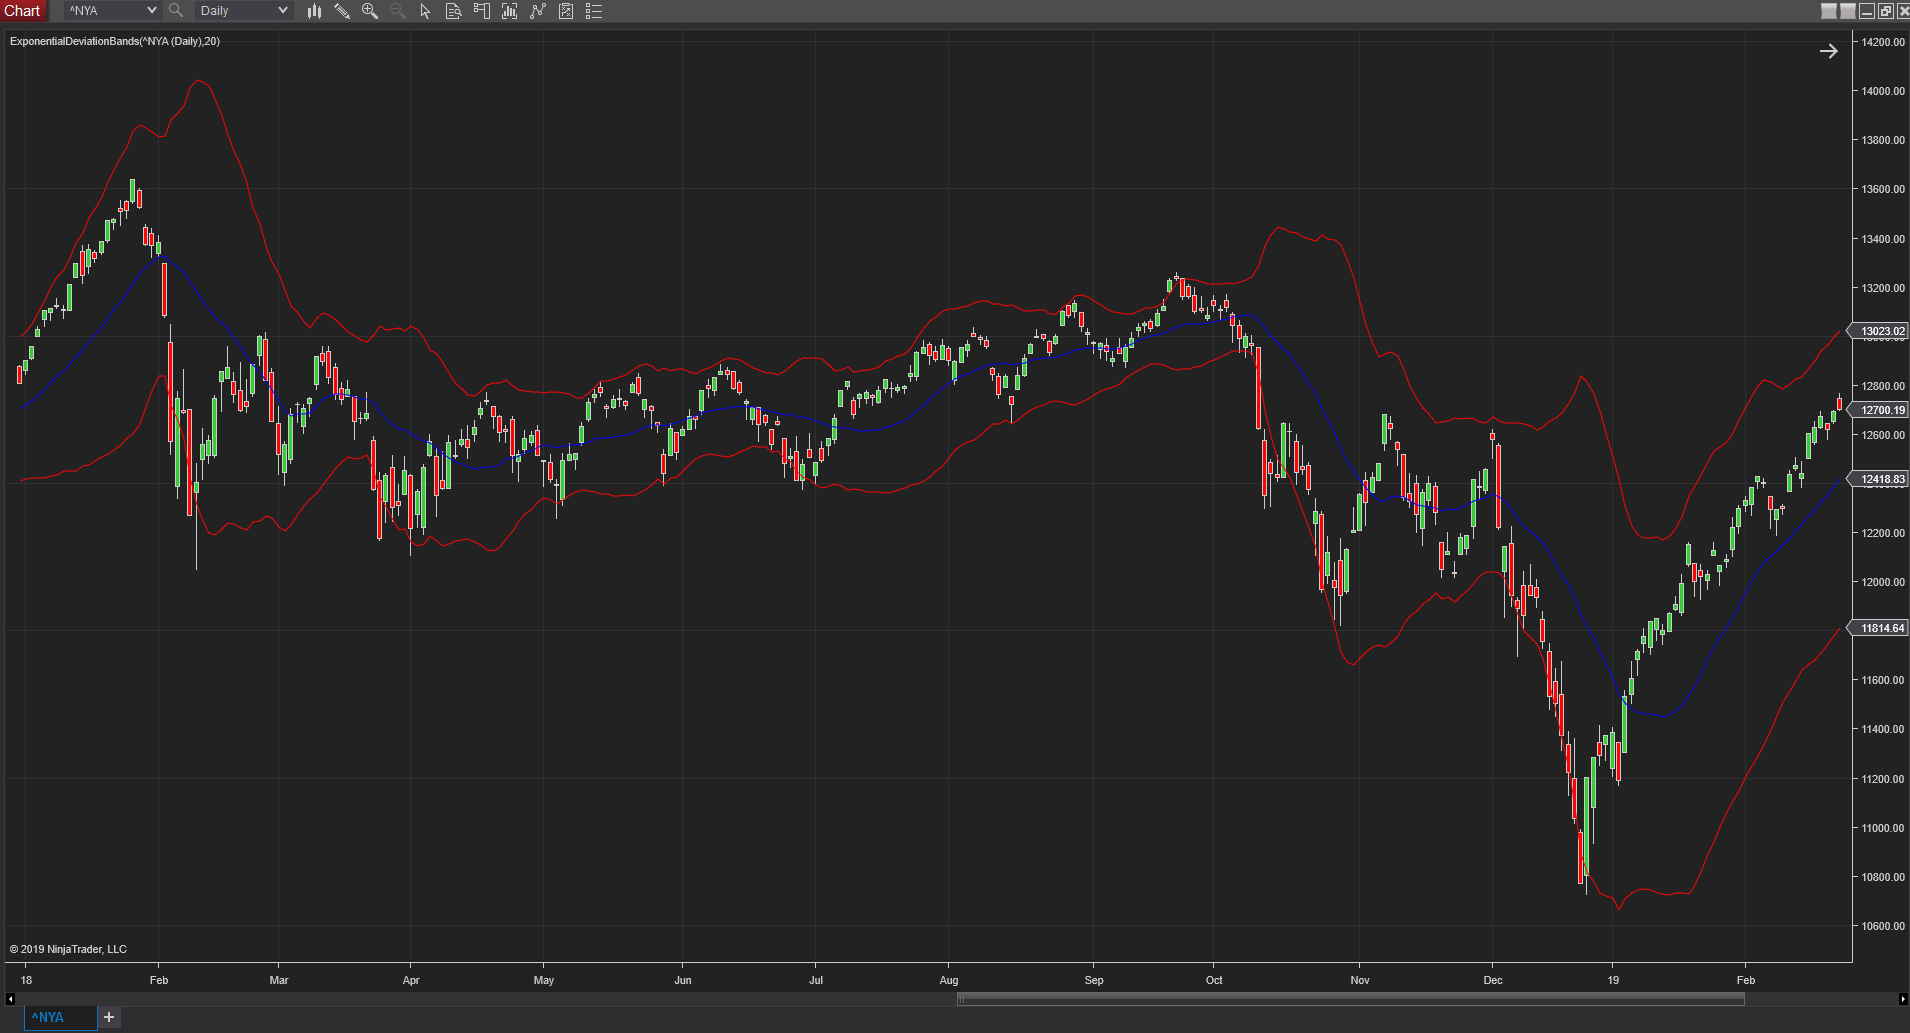
FIGURE 7: NINJATRADER. The exponential deviation bands indicator using an SMA is displayed here on a one-day NYSE composite chart from January 2018 to February 2018.
—Raymond Deux & Chris Lauber
NinjaTrader, LLC
www.ninjatrader.com
BACK TO LIST

NEUROSHELL TRADER: JULY 2019
The exponential deviation bands described by Vitali Apirine in his article in this issue can be easily implemented in NeuroShell Trader by combining two of NeuroShell Trader’s 800+ indicators. To implement the indicators, select “new indicator” from the insert menu and use the indicator wizard to set up the following indicators:
Upper band:	Add2(Avg(Close,20),Mul2(2,ExpAvg(Abs(Sub(Avg(Close,20),Close)),20)))

Middle band:	Avg(Close,20)

Lower band:	Sub(Avg(Close,20),Mul2(2,ExpAvg(Abs(Sub(Avg(Close,20),Close)),20)))
Users of NeuroShell Trader can go to the Stocks & Commodities section of the NeuroShell Trader free technical support website to download a copy of this or any previous Traders’ Tips.
A sample chart is shown in Figure 8.

FIGURE 8: NEUROSHELL TRADER. This NeuroShell Trader chart shows exponential deviation bands applied to the Dow Jones Industrial Average.
—Marge Sherald, Ward Systems Group, Inc.
301 662-7950, sales@wardsystems.com
www.neuroshell.com
BACK TO LIST

AIQ: JULY 2019
The importable AIQ EDS file based on Vitali Apirine’s article in this issue, “Exponential Deviation Bands,” and a recreated Excel spreadsheet similar to the one shown in the article can be obtained on request via email to info@TradersEdgeSystems.com. The code is also shown here:
!EXPONENTIAL DEVIATION BANDS
!Author: Vitali Apirine, TASC July 2019
!Coded by: Richard Denning, 5/15/2019
!www.TradersEdgeSystems.com

C is [close].
Periods is 20.

MA20 is simpleavg(C,Periods).   !expavg(C,Periods).  !or simpleavg(C,Periods).
MDev20 is (Abs(MA20-C)+Abs(MA20-valresult(C,1))+Abs(MA20-valresult(C,2))+Abs(MA20-valresult(C,3))
      +Abs(MA20-valresult(C,4))+Abs(MA20-valresult(C,5))+Abs(MA20-valresult(C,6))+Abs(MA20-valresult(C,7))
     +Abs(MA20-valresult(C,8))+Abs(MA20- valresult(C,9))+Abs(MA20- valresult(C,10))+Abs(MA20- valresult(C,11))
     +Abs(MA20- valresult(C,12))+Abs(MA20- valresult(C,13))+Abs(MA20- valresult(C,14))+Abs(MA20- valresult(C,15))
      +Abs(MA20- valresult(C,16)) +Abs(MA20- valresult(C,17))+Abs(MA20- valresult(C,18))+Abs(MA20- valresult(C,19)))/20.

Dev is Abs(MA20-C).
Rate is 2/( Periods +1).

DaysInto is ReportDate() - RuleDate().
Stop if DaysInto >= 200.
stopEXD is iff(Stop,Mdev20, EXD).
EXD is Dev*Rate + valresult(stopEXD,1)*(1-Rate).

UpperExp is MA20+2*EXD.
MidExp is MA20.
LowerExp is MA20-2*EXD.

ShowValues if 1.
Figure 9 shows the exponential deviation bands centered on a 20-bar simple moving average on a chart of the New York Composite Index (NYA).

FIGURE 9: AIQ. Here are exponential deviation bands centered on a 20-bar simple moving average on a chart of the New York Composite Index (NYA).
—Richard Denning
info@TradersEdgeSystems.com
for AIQ Systems
BACK TO LIST

TRADE NAVIGATOR: JULY 2019
We have created a special file to make it easy to download the library based on the article in this issue by Vitali Apirine, “Exponential Deviation Bands.”
The file name is “SC201907.” To download it, click on Trade Navigator’s blue telephone button, select “download special file,” then erase the word “upgrade” and type in “SC201907” (without the quotes), then click the start button. When prompted to upgrade, click the yes button. If prompted to close all software, click on the continue button. Your library will now download. This library contains three indicators: “ED upper band,” “ED lower band,” and “ExpDev.” The library also includes a prebuilt study named “exponential deviation study.”
Once installed, you can insert these indicators onto your chart by opening the charting dropdown menu, selecting the add to chart command, then on the indicators tab, find your named indicator, select it, then click on the add button. Repeat this procedure for additional indicators as well if you wish. To add the study, on the add to chart dialogue box’s “studies” tab, please select “exponential deviation study,” then click the add button.
If you have any difficulty creating or using the indicators and/or template, feel free to contact our technical support or use our live chat.
—Genesis Financial Technologies
Tech support (719) 884-0245
www.TradeNavigator.com
BACK TO LIST

AMIBROKER: JULY 2019
In “Exponential Deviation Bands” in this issue, author Vitali Apirine presents deviation bands that are based on exponential moving average as opposed to classic bands centered around simple moving average.
Ready-to-use code for AmiBroker is provided below. A sample chart is shown in Figure 10.
AmiBroker code:

Periods = Param("Periods", 20, 2, 100 );
Width = Param("Width", 2, 1, 3, 0.01 );
MA20 = EMA(C,Periods);

Dev = MDev = abs(MA20-C);
for( i = 1; i < Periods; i++ )
   MDev += abs( MA20 - Ref( C, -i ) );

MDev /= Periods;

EXD = EMA( MDev, Periods );
// uncomment line below if you need a chart
// that exactly matches article
// EXD = EMA( Dev, Periods );
up = MA20+Width*EXD;
dn = MA20-Width*EXD;

Plot( C, "Price", colorDefault, styleCandle );

Plot( MA20, "ExpDevBands"+_PARAM_VALUES(), colorRed );
Plot( up, "", colorBlue );
Plot( dn, "", colorBlue );
//PlotOHLC( up, up, dn, dn, "", ColorBlend( colorWhite, GetChartBkColor() ), styleCloud );
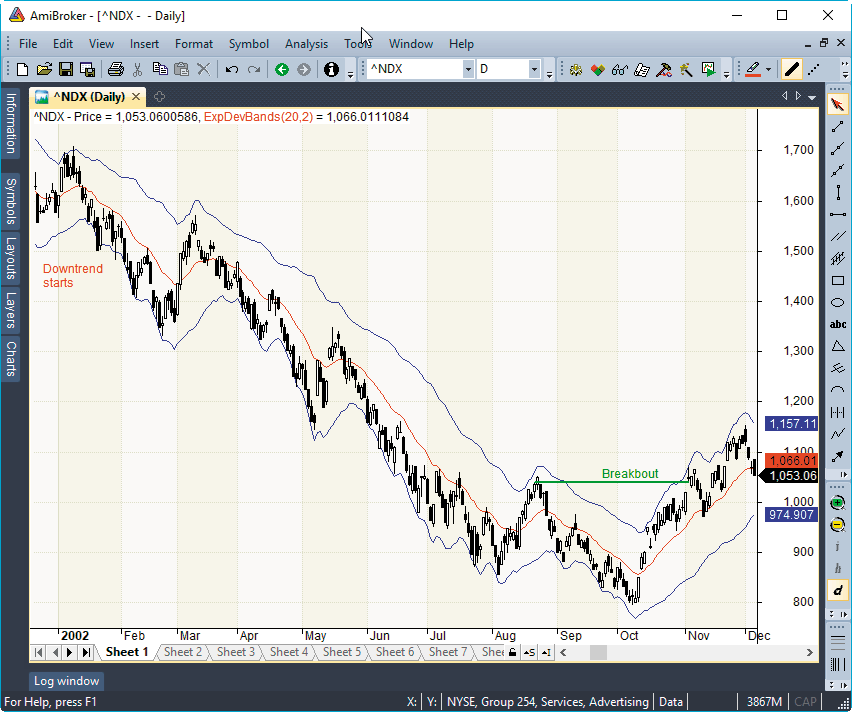
FIGURE 10: AMIBROKER. Here is a daily chart of the Nasdaq 100 with exponential deviation bands, replicating a chart from Vitali Apirine’s article in this issue.
—Tomasz Janeczko, AmiBroker.com
www.amibroker.com
BACK TO LIST

TRADERSSTUDIO: JULY 2019
The importable TradersStudio code file for Vitali Apirine’s article in this issue, “Exponential Deviation Bands,” and a recreated Excel spreadsheet similar to the one shown in the article can be obtained on request via email to info@TradersEdgeSystems.com. The code is also shown here:
'EXPONENTIAL DEVIATION BANDS
'Author: Vitali Apirine, TASC July 2019
'Coded by: Richard Denning, 5/15/2019
'www.TradersEdgeSystems.com

Function EXD(Periods,ByRef UpperExp,ByRef LowerExp) As BarArray
  'Periods = 20
  Dim Dev, Rate
  Dim theEXD As BarArray
  Dim MA As BarArray
  MA = Average(C,Periods)
  Dev = Abs(MA-C)
  Rate = 2/(Periods +1)
  theEXD = Dev*Rate + EXD[1]*(1-Rate)
  UpperExp = MA+2*theEXD
  LowerExp = MA-2*theEXD
  EXD = theEXD
End Function
'---------------------------------------------------------------
'INDICATOR PLOT:
Sub EDEV_BANDS(Periods)
  Dim theEXD As BarArray
  Dim MA As BarArray
  Dim UpperExp As BarArray
  Dim LowerExp As BarArray
  MA = Average(C,Periods)
  theEXD = EXD(Periods,UpperExp,LowerExp)
End Sub
Figure 11 shows the exponential deviation bands centered on a 20-bar simple moving average on a chart of Apple Inc. (AAPL) during 2012.

FIGURE 11: TRADERSSTUDIO. Here are exponential deviation bands centered on a 20-bar simple moving average on a chart of Apple Inc. (AAPL).
—Richard Denning
info@TradersEdgeSystems.com
for TradersStudio
BACK TO LIST

THINKORSWIM: JULY 2019
We have put together a study for thinkorswim based on the article “Exponential Deviation Bands” by Vitali Apirine in this issue. We built the study by using our proprietary scripting language, thinkScript. To ease the loading process, simply click on https://tos.mx/l9qPdW or enter it into setup—open shared item from within thinkorswim, then choose view thinkScript study and name it exponentialdevbands. This can then be added to your chart from the edit study and strategies menu within thinkorswim.
In Figure 12, the study can be seen on a one-year daily chart set of NYA. See Apirine’s article in this issue for more details on how to interpret the study. Please note that we used a different method for our code than described in the original code (prefetch vs. initialization) in order to more reliably generate values as well as for performance. We also added the ability to adjust the average types as well as the band multipliers for the study.

FIGURE 12: THINKORSWIM. The study is shown on a one-year daily chart set of NYA.
—thinkorswim
A division of TD Ameritrade, Inc.
www.thinkorswim.com
BACK TO LIST
Originally published in the July 2019 issue of
Technical Analysis of STOCKS & COMMODITIES magazine.
All rights reserved. © Copyright 2019, Technical Analysis, Inc.


