TRADERS’ TIPS
August 2019

For this month’s Traders’ Tips, the focus is John F. Ehlers’ article
in this issue, “A Peek Into The Future.” Here, we present the
August 2019 Traders’ Tips code with possible implementations in various
software.
You can right-click on any chart to open it in a new tab or window
and view it at it’s originally supplied size, often much larger than
the version printed in the magazine.
The Traders’ Tips section is provided to help the reader implement
a selected technique from an article in this issue or another recent issue.
The entries here are contributed by software developers or programmers for
software that is capable of customization.

TRADESTATION: AUGUST 2019
In “A Peek Into The Future” in this issue, author John Ehlers
describes the calculation of a new filter that could help signal cyclical turning
points in markets. As described by the author, the filter has a negative group
delay and while an indicator based on it cannot actually see into the future,
it may provide the trader with signals in advance of other indicators.
Here, we are providing the TradeStation EasyLanguage code for an indicator
and strategy based on Ehlers’ concepts. The code for the indicator provided
by Ehlers in his article can be downloaded by visiting our TradeStation and
EasyLanguage support forum at the link provided.
Indicator: Voss Filter

// A Peek Into the Future
// John F. Ehlers
// TASC Aug 2019

inputs:
	Period( 20 ),
	Predict( 3 ) ;

variables:
	Order( 0 ),
	F1( 0 ),
	G1( 0 ),
	S1( 0 ),
	Bandwidth( 0 ),
	Count( 0 ),
	SumC( 0 ),
	Filt( 0 ),
	Voss( 0 ) ;

once
begin
	Bandwidth = .25 ;
	Order = 3 * Predict ;
	F1 = Cosine( 360 / Period ) ;
	G1 = Cosine( Bandwidth * 360 / Period ) ;
	S1 = 1/ G1 - Squareroot( 1 / ( G1 * G1 ) - 1 ) ;
end ;

if CurrentBar > 5 then
	Filt = .5 * ( 1 - S1 ) * ( Close - Close[2] ) +
		F1 * ( 1 + S1 ) * Filt[1] - S1 * Filt[2]
else
	Filt = 0 ;

SumC = 0 ;
for Count = 0 to Order -1
begin
	Sumc = SumC + ( ( Count + 1 ) / Order ) *
		Voss[Order - Count] ;
end ;

Voss = ( ( 3 + Order ) / 2 ) * Filt - SumC ;

Plot1( Filt, "BPF" ) ;
Plot2( Voss, "Voss" ) ;

Strategy: Voss Filter

// A Peek Into the Furure
// John F. Ehlers
// TASC Aug 2019

inputs:
	Period( 20 ),
	Predict( 3 ) ;

variables:
	Order( 0 ),
	F1( 0 ),
	G1( 0 ),
	S1( 0 ),
	Bandwidth( 0 ),
	Count( 0 ),
	SumC( 0 ),
	Filt( 0 ),
	Voss( 0 ) ;

once
begin
	Bandwidth = .25 ;
	Order = 3 * Predict ;
	F1 = Cosine( 360 / Period ) ;
	G1 = Cosine( Bandwidth * 360 / Period ) ;
	S1 = 1/ G1 - Squareroot( 1 / ( G1 * G1 ) - 1 ) ;
end ;

if CurrentBar > 5 then
	Filt = .5 * ( 1 - S1 ) * ( Close - Close[2] ) +
		F1 * ( 1 + S1 ) * Filt[1] - S1 * Filt[2]
else
	Filt = 0 ;

SumC = 0 ;
for Count = 0 to Order -1
begin
	Sumc = SumC + ( ( Count + 1 ) / Order ) *
		Voss[Order - Count] ;
end ;

Voss = ( ( 3 + Order ) / 2 ) * Filt - SumC ;

if Voss crosses above Filt then
	Buy next bar at Market
else if Voss crosses below Filt then
	Sell next bar at Market ;
To download the EasyLanguage code, please visit our TradeStation and EasyLanguage
support forum. The files for this article can be found here: https://community.tradestation.com/Discussions/Topic.aspx?Topic_ID=156727.
The filename is “TASC_AUG2019.ZIP.” For more information about
EasyLanguage in general, please see https://www.tradestation.com/EL-FAQ.
A sample chart is shown in Figure 1.

FIGURE 1: TRADESTATION. This shows
a daily chart of SPY with the Voss filter indicator and strategy applied.
This article is for informational purposes. No type of trading or investment
recommendation, advice, or strategy is being made, given, or in any manner
provided by TradeStation Securities or its affiliates.
—Doug McCrary
TradeStation Securities, Inc.
www.TradeStation.com
BACK TO LIST

THINKORSWIM: AUGUST 2019
We have put together a study based on the article “A Peek Into The Future” in
this issue by John Ehlers. The referenced study has been built by using our
proprietary scripting language, thinkScript. To load it, simply click on https://tos.mx/u5Tpzy and
then choose view thinkScript study and name it “Voss Predictive
Filter.” This can then be added to your chart from the edit study
and strategies menu within thinkorswim.
The study can be seen in Figure 2, a chart of the SPY. See John Ehlers’ article
in this issue for more details on how to interpret the study.

FIGURE 2: THINKORSWIM. Here, the
VossPredictiveFilter study (bottom panel) is shown on a chart of the SPY.
—thinkorswim
A division of TD Ameritrade, Inc.
www.thinkorswim.com
BACK TO LIST

QUANTACULA: AUGUST 2019
The BandPass and VossPredictor indicators based on John Ehlers’ article
in this issue, “A Peek Into The Future,” have been added to Quantacula
Studio and Quantacula.com so you can use them in charts and backtests as of
the latest version update.
We thought that the predictive nature of the VossPredictor would be a good
candidate to use for one of our current favorite areas of exploration, self-tuning
indicators. We coded a trading model that buys when the VossPredictor hits
a 200-bar low, and then sells when it crosses above zero. The intention is
to capture relatively quick swing trades on leveraged ETFs. We ran the model
on the triple-leveraged TQQQ and was pleased to see it had a 79% success rate
with an average profit per trade of 8.35%. It would be worth exploring this
technique with other liquid ETFs and volatile stocks.
Figure 3 displays a sample Quantacula chart showing some of the trading signals.
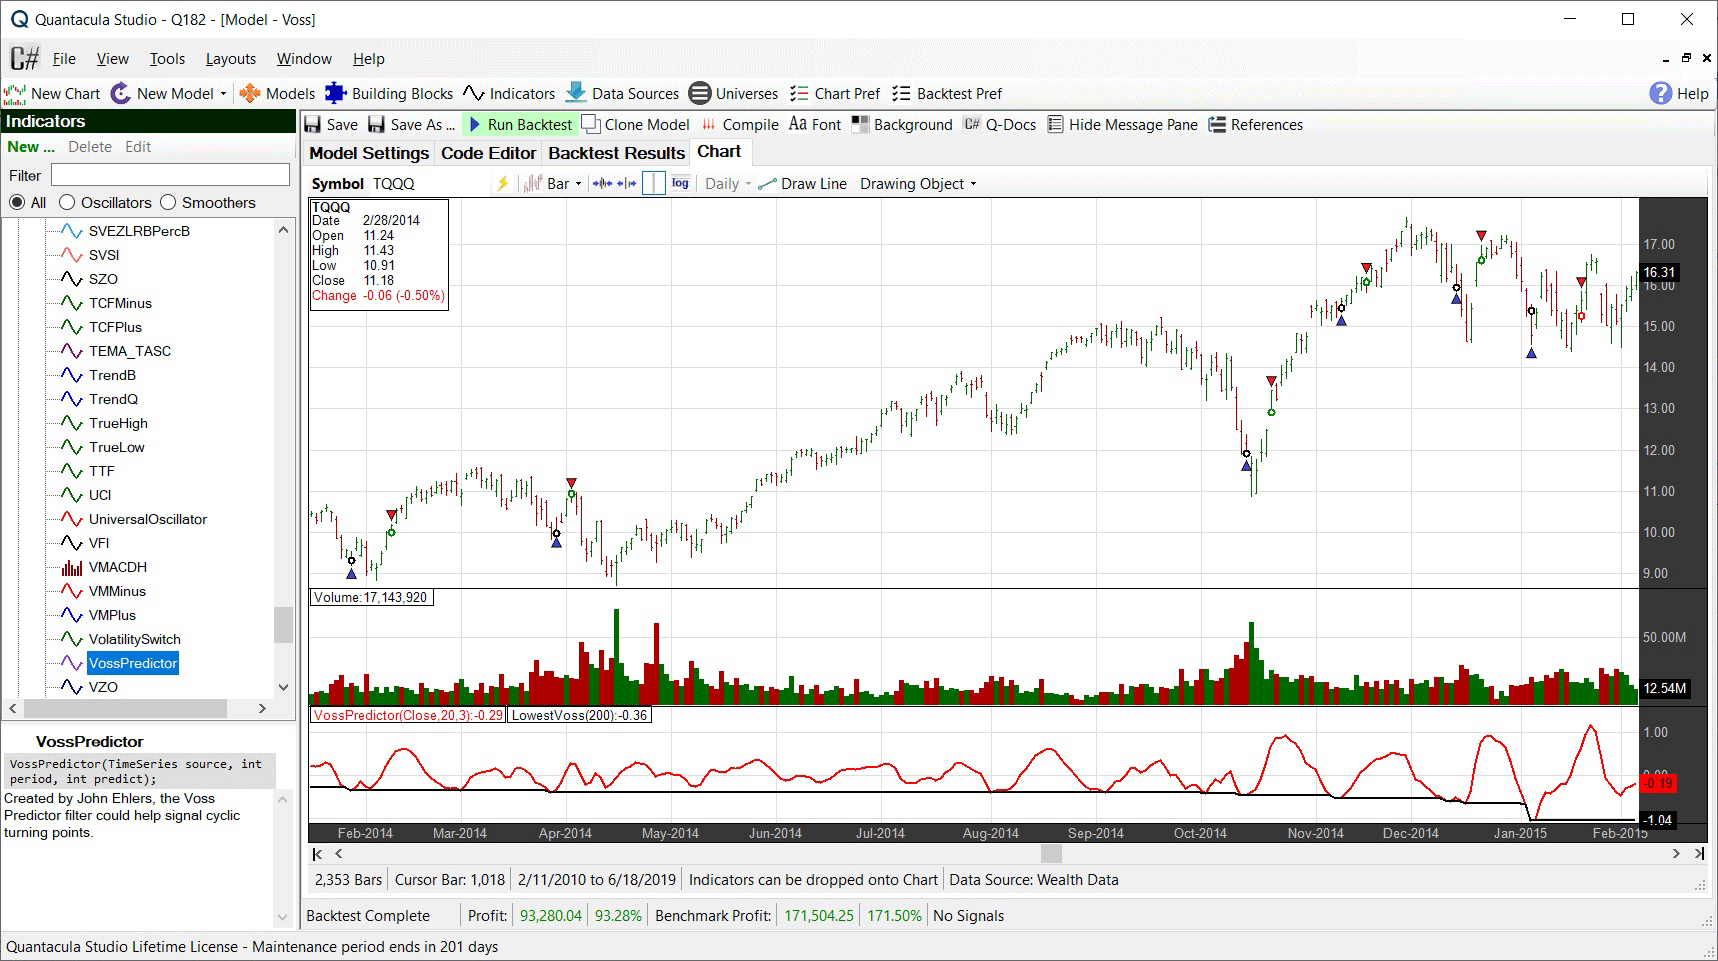
FIGURE 3: QUANTACULA STUDIO. This
sample chart shows some of the trades in TQQQ, showing a run of five winning
trades followed by a roughly breakeven trade.
Here is the Quantacula C# code for the trading model:
using QuantaculaBacktest;
using QuantaculaCore;
using QuantaculaIndicators;
using System.Drawing;
using TASCIndicators;

namespace Quantacula
{
    public class MyModel : UserModelBase
    {
        //create indicators and other objects here
        public override void Initialize(BarHistory bars)
        {
            voss = new VossPredictor(bars.Close, 20, 3);
            PlotIndicator(voss, Color.Red);
            lowestVoss200 = new Lowest(voss, 200);
            PlotTimeSeries(lowestVoss200, "LowestVoss(200)", voss.PaneTag, Color.Black);
        }

        //execute the strategy rules here
        public override void Execute(BarHistory bars, int idx)
        {
            if (!HasOpenPosition(bars, PositionType.Long))
            {
                if (voss[idx] == lowestVoss200[idx])
                    PlaceTrade(bars, TransactionType.Buy, OrderType.Limit, bars.Close[idx]);
            }
            else
            {
                if (voss[idx] > 0)
                    PlaceTrade(bars, TransactionType.Sell, OrderType.Market);
            }
        }

        //declare private variables below
        VossPredictor voss;
        TimeSeries lowestVoss200;
    }
}
—Dion Kurczek, Quantacula LLC
info@quantacula.com
www.quantacula.com
BACK TO LIST

eSIGNAL: AUGUST 2019
For this month’s Traders’ Tip, we’ve provided the study Voss
predictive filter.efs based on the article in this issue by John Ehlers, “A
Peek Into The Future.” This study can be used to help identify cyclical
turning points.
The study contains formula parameters that may be configured through the edit
chart window (right-click on the chart and select “edit chart”).
A sample chart is shown in Figure 4.

FIGURE 4: eSIGNAL. Here is an example
of the study plotted on a daily chart of $SPY.
To discuss this study or download a complete copy of the formula code, please
visit the EFS library discussion board forum under the forums link
from the support menu at www.esignal.com or
visit our EFS KnowledgeBase at https://www.esignal.com/support/kb/efs/.
The eSignal formula script (EFS) is also available for copying & pasting
here:
/**********************************
Provided By:
Copyright 2019 Intercontinental Exchange, Inc. All Rights Reserved.
eSignal is a service mark and/or a registered service mark of Intercontinental Exchange, Inc.
in the United States and/or other countries. This sample eSignal Formula Script (EFS)
is for educational purposes only.
Intercontinental Exchange, Inc. reserves the right to modify and overwrite this EFS file with each new release.

Description:
   Peaks And Valleys. A Peek Into The Future
   by John F. Ehlers


Version:            1.00  06/11/2019

Formula Parameters:                     Default:
Periods                                 20
Predict                                 3

Notes:
The related article is copyrighted material. If you are not a subscriber
of Stocks & Commodities, please visit www.traders.com.

**********************************/


var fpArray = new Array();

function preMain(){
    setPriceStudy(false);
    setStudyTitle("Voss Predictive Filter");
    setCursorLabelName("Filter", 0);
    setCursorLabelName("Voss", 1);
    setPlotType(PLOTTYPE_LINE);
    setDefaultBarFgColor(Color.RGB(0x00,0x94,0xFF),1);
    setDefaultBarFgColor(Color.RGB(0xFE,0x69,0x00),0);

    var x = 0;
    fpArray[x] = new FunctionParameter("Periods", FunctionParameter.NUMBER);
	with(fpArray[x++]){
        setName("Periods");
        setLowerLimit(1);
        setDefault(20);
        }
    fpArray[x] = new FunctionParameter("Predict", FunctionParameter.NUMBER);
	with(fpArray[x++]){
        setName("Predict");
        setLowerLimit(1);
        setDefault(3);
        }
}

var bInit = false;
var bVersion = null;
var xClose = null;
var vOrder = null;
var F1 = null;
var G1 = null;
var S1 = null;
var Bandwidth = null;
var count = null;
var SumC = null;
var Filt = null;
var Filt_1 = null;
var Filt_2 = null;
var Voss = [];


function main(Periods, Predict){
    if (bVersion == null) bVersion = verify();
    if (bVersion == false) return;

    if (getBarState() == BARSTATE_ALLBARS){
        bInit = false;
    }
   if (getCurrentBarCount() < Periods || getCurrentBarCount() < (3 * Predict)) {
        Voss.unshift(0);
        return;
    }
    if (!bInit){
        xClose = close();
        Bandwidth = 0.25;
        Order = 3 * Predict;
        F1 = Math.cos(2 * Math.PI / Periods);
        G1 = Math.cos( Bandwidth * 2 * Math.PI / Periods);
        S1 = 1 / G1 - Math.sqrt( 1 / (G1*G1) - 1);
        Filt_2 = 0;
        Filt_1 = 0;
        Filt = 0;

        bInit = true;
    }

    if (getBarState() == BARSTATE_NEWBAR)   {
        Filt_2 = Filt_1;
        Filt_1 = Filt;
        Filt = 0;
    }
    else Voss.shift();

    if (getCurrentBarCount() <= 5) {
        Filt = 0;
    }
    else {
        Filt  =  0.5 * (1  -  S1)*(xClose.getValue(0)  -  xClose.getValue(-2))  +  F1 * (1  +  S1) * Filt_1  - S1 * Filt_2;
    }

    SumC = 0;
    for (var i = 0; i < Order; i++) {
        SumC = SumC + ((i + 1) / Order) * Voss[Order - i - 1];
    }
    Voss.unshift(((3 + Order) / 2) * Filt - SumC);

    return [Filt, Voss[0]];
}


function verify(){
    var b = false;
    if (getBuildNumber() < 779){

        drawTextAbsolute(5, 35, "This study requires version 10.6 or later.",
            Color.white, Color.blue, Text.RELATIVETOBOTTOM|Text.RELATIVETOLEFT|Text.BOLD|Text.LEFT,
            null, 13, "error");
        drawTextAbsolute(5, 20, "Click HERE to upgrade.@URL=https://www.esignal.com/download/default.asp",
            Color.white, Color.blue, Text.RELATIVETOBOTTOM|Text.RELATIVETOLEFT|Text.BOLD|Text.LEFT,
            null, 13, "upgrade");
        return b;
    }
    else
        b = true;

    return b;
}
—Eric Lippert
eSignal, an Interactive Data company
800 779-6555, www.eSignal.com
BACK TO LIST

WEALTH-LAB: AUGUST 2019
In his article in this issue (“A Peek Into The Future”), author
John Ehlers presents an indicator that could help signal cyclic turning points—the
Voss predictor filter. Noticing that the indicator accurately tracks the market’s
peaks and valleys, Ehlers suggests that simple crossovers of the forward-looking
Voss predictor with the two-pole band-pass filter may become the basis of a
trading system.
Those who follow us might have figured out that our motto is “Avoid
coding whenever possible.” In contrast with the filter concept’s
complexity, this time we’re lucky to again not have to bother our readers
with code. Here’s how:
Step 1: Install (or update) the TASCIndicators library
to its most-recent version from our website using the built-in extension manager.
Step 2: Add entry and exit blocks, then drag and
drop indicator crosses above (below) indicator from general indicators under
the conditions tab on top of each one (respectively).
Step 3: For each entry and exit, choose the “peeking” VossPredictor
as Indicator1 and a “lagging” BandPass as Indicator2 where
prompted. (See Figure 5.)
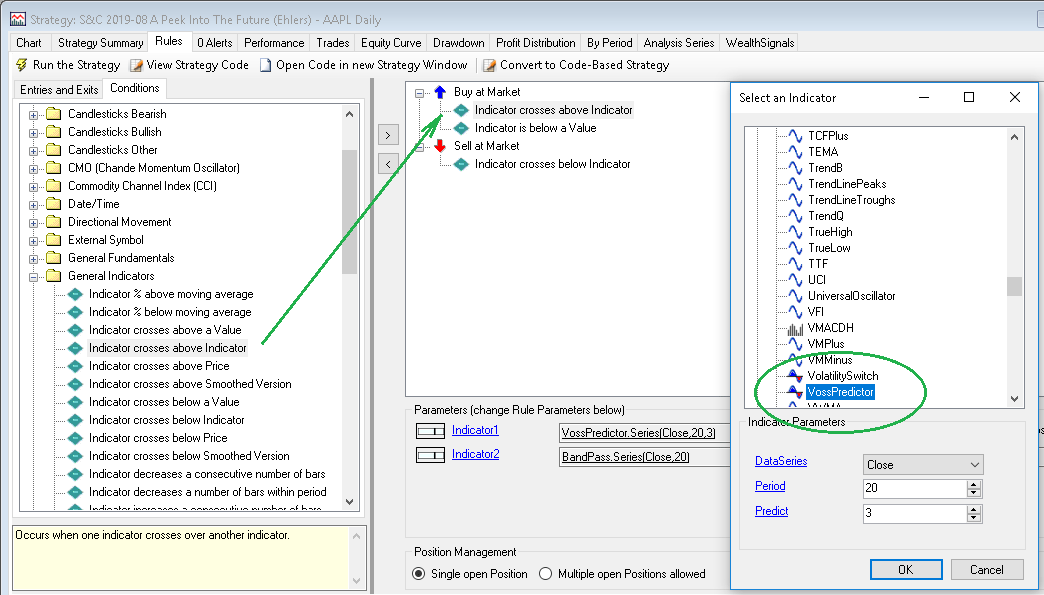
FIGURE 5 WEALTH-LAB. Here’s
an example of how to create a rule-based strategy with the Voss predictor
in Wealth-Lab.
As soon as the cycle signal starts to fail once a strong trend emerges, we
can choose to stay on the sidelines when the trend gains strength with this
simple rule:
Step 4: Drag and drop the condition called indicator
is below a value (from general indicators) onto your entry,
choose ADX as the indicator, and set 25-30 as its threshold. This
ensures our simple system from being caught on the wrong side as the market
starts to trend in any direction. (See Figure 6.)
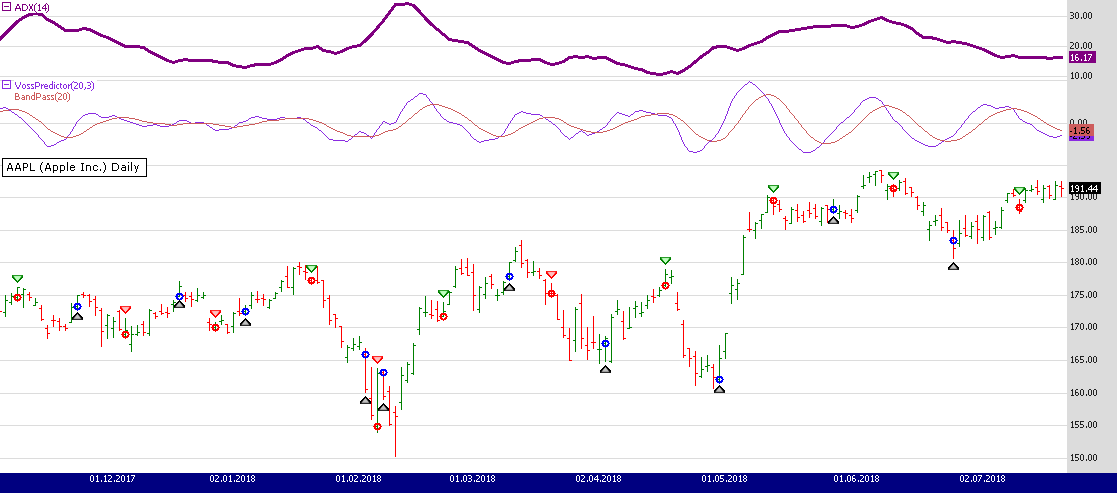
FIGURE 6: WEALTH-LAB. Here, the
example trading system is applied to a daily chart of AAPL
Whether you’ve prototyped the trading system code as outlined here or
downloaded it from Wealth-Lab (hit Ctrl-O and choose download...),
to peek into the code behind it, simply click Open code in new strategy
window. We will also show the code here for your convenience:
using System;
using System.Collections.Generic;
using System.Text;
using System.Drawing;
using WealthLab;
using WealthLab.Indicators;
using TASCIndicators;

namespace WealthLab.Strategies
{
	public class MyStrategy : WealthScript
	{
		protected override void Execute()
		{
			var voss = VossPredictor.Series( Close, 20,3 );
			var bandpass = BandPass.Series( Close, 20 );
			var adx = ADX.Series( Bars, 14 );

			for(int bar = GetTradingLoopStartBar( 21 ); bar < Bars.Count; bar++)
			{
				if (IsLastPositionActive)
				{
					Position p = LastPosition;
					if (CrossUnder(bar, voss, bandpass))
						SellAtMarket( bar + 1, p);
				}
				else
				{
					if (CrossOver(bar, voss, bandpass))
						if (adx[bar] < 30)
							BuyAtMarket( bar + 1);
				}
			}

			ChartPane pane1 = CreatePane( 25,true,true );
			PlotSeries( pane1,voss,Color.BlueViolet,LineStyle.Solid,1);
			PlotSeries( pane1,bandpass,Color.IndianRed,LineStyle.Solid,1);
			ChartPane pane2 = CreatePane( 25,true,true );
			PlotSeries( pane2,adx,Color.Purple,LineStyle.Solid,3);

		}
	}
}
—Eugene (Gene) Geren,
Wealth-Lab team MS123, LLC
www.wealth-lab.com
BACK TO LIST

NEUROSHELL TRADER: AUGUST 2019
The wide bandpass and Voss predictive filters presented in John Ehlers’ article
in this issue, “A Peek Into The Future,” can be easily implemented
in NeuroShell Trader using NeuroShell Trader’s ability to call external
dynamic linked libraries. Dynamic linked libraries can be written in C, C++,
and Power Basic.
After moving the EasyLanguage code given in the article to your preferred
compiler and creating a DLL, you can insert the resulting indicators as follows:
- Select “New indicator ...” from the insert menu.
- Choose the external program & library calls category.
- Select the appropriate external DLL call indicator.
- Set up the parameters to match your DLL.
- Select the finished button.
Users of NeuroShell Trader can go to the Stocks & Commodities section
of the NeuroShell Trader free technical support website to download a copy
of this or any previous Traders’ Tips.
A sample chart is shown in Figure 7.

FIGURE 7: NEUROSHELL TRADER. This
sample NeuroShell Trader chart shows the wide bandpass and Voss predictive
filters on SPY.
—Marge Sherald, Ward Systems Group, Inc.
301 662-7950, sales@wardsystems.com
www.neuroshell.com
BACK TO LIST

NINJATRADER: AUGUST 2019
The Voss predictive filter indicator, as discussed in John Ehlers’ article
in this issue, “A Peek Into The Future,” is available for download
at the following links for NinjaTrader 8 and for NinjaTrader 7:
Once the file is downloaded, you can import the indicator into NinjaTader
8 from within the control center by selecting Tools → Import → NinjaScript
Add-On and then selecting the downloaded file for NinjaTrader 8. To import
into NinjaTrader 7, from within the control center window, select the menu
File → Utilities → Import NinjaScript and select the downloaded file.
You can review the indicator’s source code in NinjaTrader 8 by selecting
the menu New → NinjaScript Editor → Indicators from within the control
center window and selecting the VPF (Voss predictive filter) file. You can
review the indicator’s source code in NinjaTrader 7 by selecting the
menu Tools → Edit NinjaScript → Indicator from within the control
center window and selecting the VPF (Voss predictive filter) file.
NinjaScript uses compiled DLLs that run native, not interpreted, to provide
you with the highest performance possible.
A sample chart implementing the strategy is shown in Figure 8.
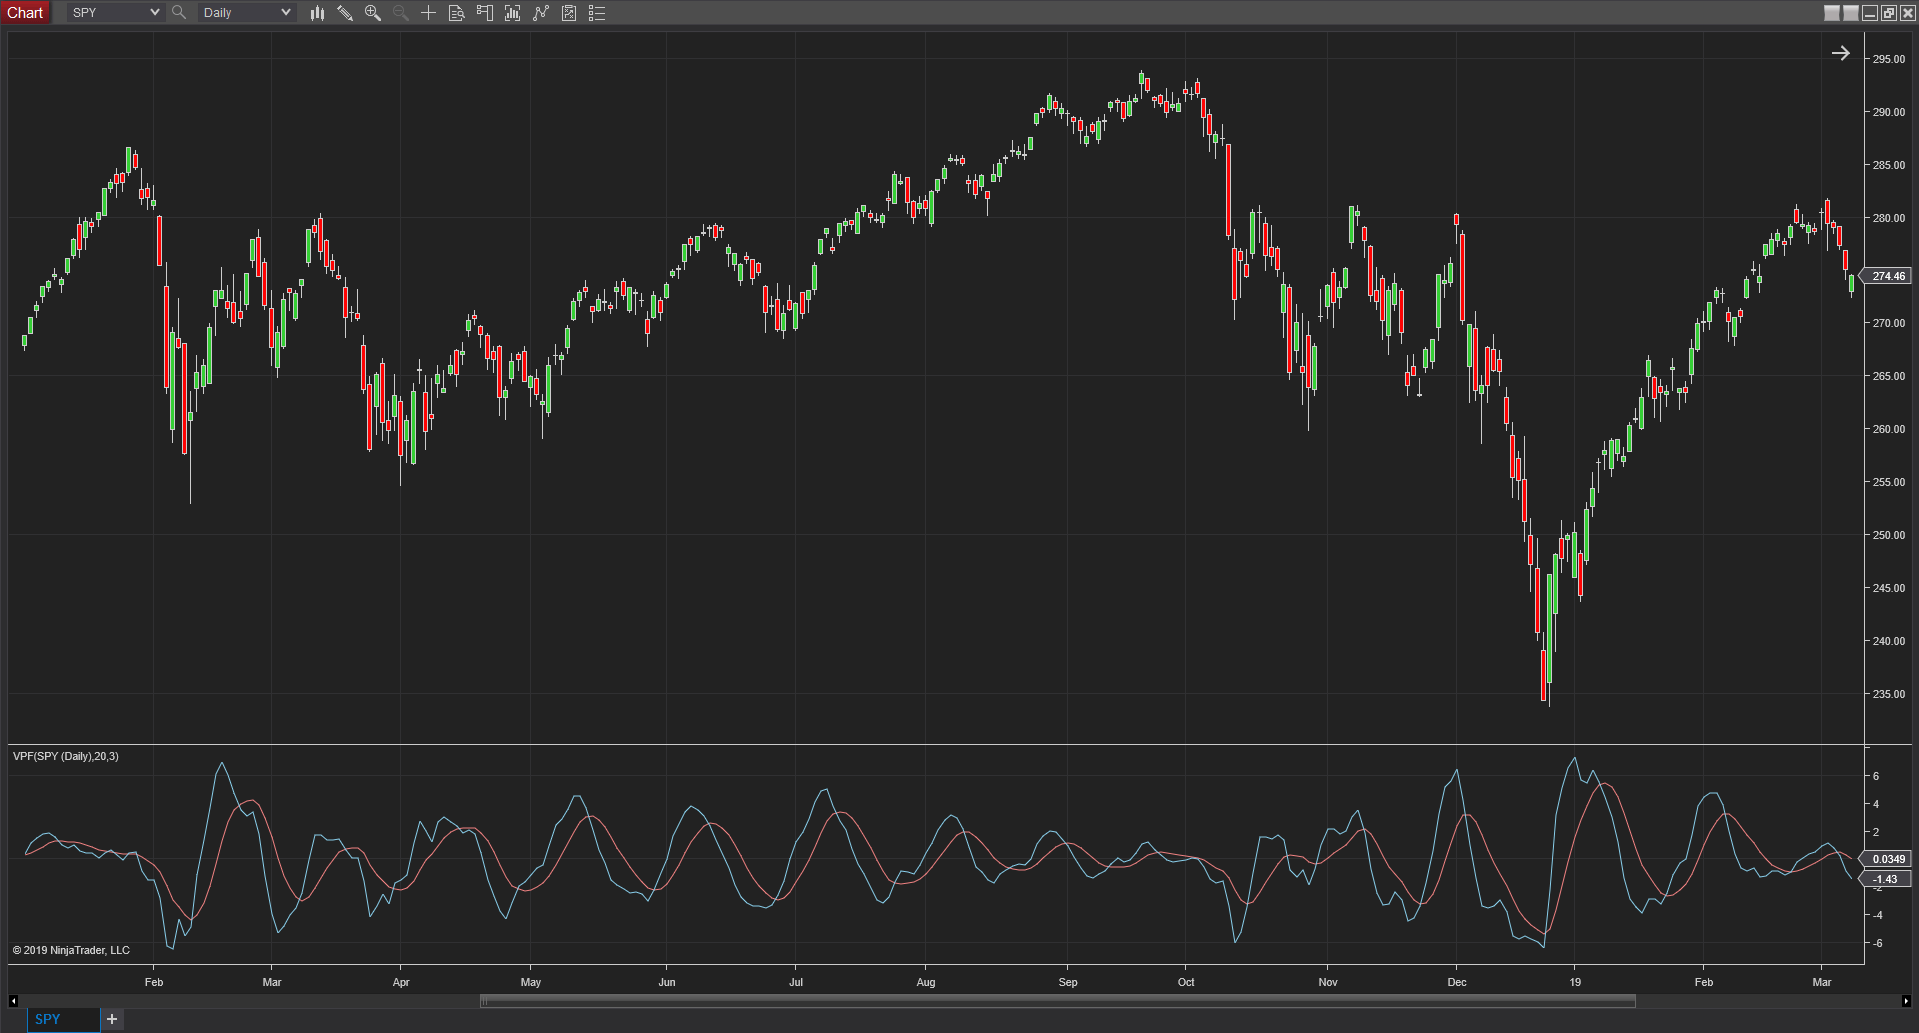
FIGURE 8: NINJATRADER. The Voss
predictive filter indicator is displayed on a one-day SPY chart from February
2018 to March 2019.
—Raymond Deux & Chris Lauber
NinjaTrader, LLC
www.ninjatrader.com
BACK TO LIST
MICROSOFT EXCEL: AUGUST 2019
John Ehlers’ mining of the digital signal processing literature space
in his article in this issue, “A Peek Into The Future,” brings
us another interesting tool for seeing a bit below the noise surrounding price
series to better locate turning points.
Having looked at the paper by Henning Voss, I personally appreciate Ehlers’ ability
to reduce the calculus of the Voss presentation to six simple lines of code.
To better explore this oscillator, I shifted the bandwidth setting from being
a constant in the example code to a user control.
Playing with the three variables that influence this oscillator construct
from “price to filter” to the final Voss indicator value is informative.
Changing the bandwidth altered the shapes, but the time shift of the extremes
of peak or valley was subtle. Changes to the “period” and “predict” specs
have a larger impact.
As noted by Ehlers in his article, you would want at least one additional
indicator in any system built around the Voss oscillator.
The spreadsheet is shown in Figure 9.
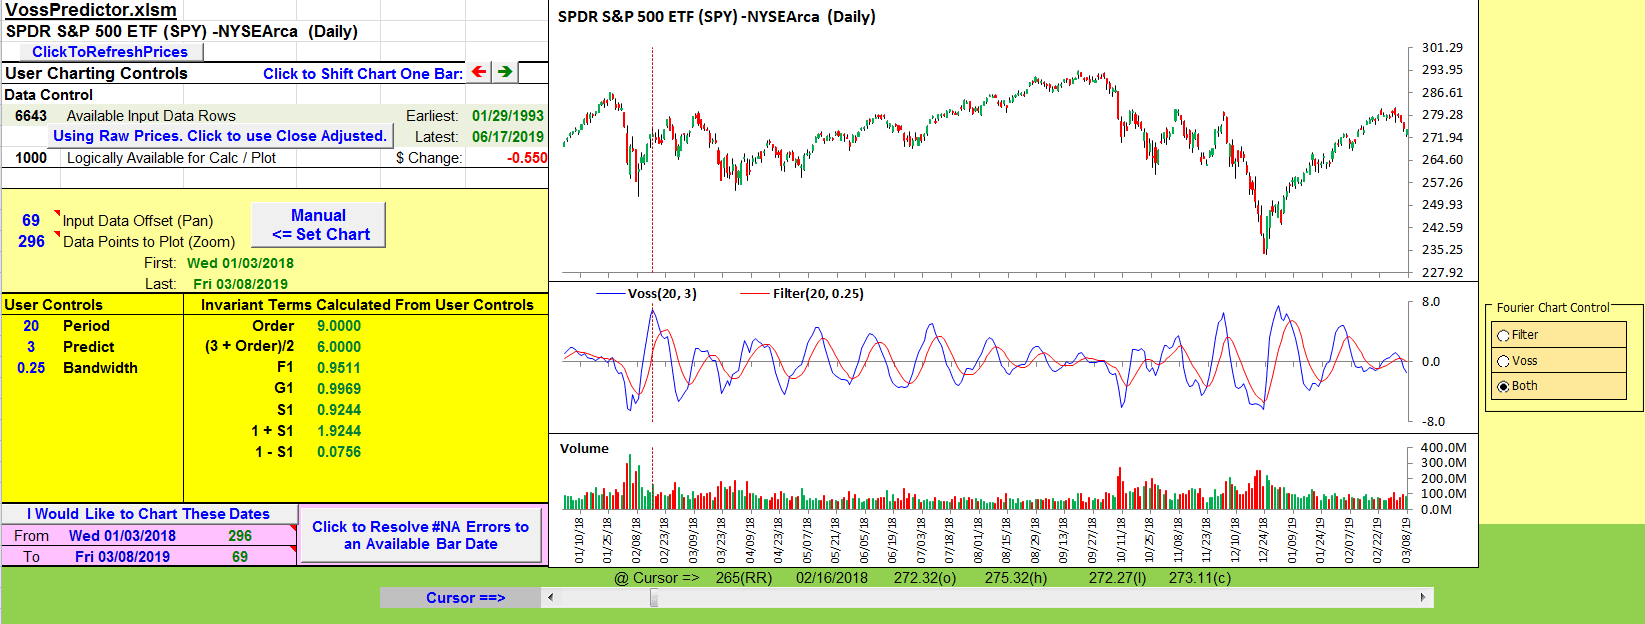
FIGURE 9: EXCEL. The Voss predictive
filter
The spreadsheet file for this Traders’ Tip can be downloaded here.
To successfully download it, follow these steps:
- Right-click on the Excel
file link, then
- Select “save as” (or “save target as”) to place
a copy of the spreadsheet file on your hard drive.
—Ron McAllister
Excel and VBA programmer
rpmac_xltt@sprynet.com
EXCEL ADDENDUM: A BUG FIX FOR DATA REFRESH FAILURE
(applies to all past Traders’ Tips spreadsheets)
On or about Saturday, June 8, 2019, Yahoo Finance introduced web page changes
that removed the “crumb store” from the HTML text of all pages
retrieved when using a Windows Internet Explorer 11 “User-Agent” string.
By trial and error, I determined that requests using a Windows Chrome “User-Agent” string
will retrieve pages whose HTML text does contain the expected crumb store and
crumb value.
As an “oh by the way,” I found one additional crumb store with
a different crumb value whose usage I have not explored.
Using a Windows Chrome User Agent string can get my recent spreadsheets back
on the air, at least temporarily.
I say “temporarily,” because I would not be surprised if the folks
at Yahoo Finance propagate similar changes to all of the supported browser
types over time.
The following bug fix instructions are applicable to spreadsheets going as
far back as the September 2018 Traders’ Tip spreadsheet file named “WeeklyDailyStochastics.xlsm,” where
I first introduced the “DataViaWinHTTP” module.
For spreadsheets older than September 2018, replacing the User-Agent string may turn
out to be helpful. I have tried this successfully with a few of the earlier
2018 spreadsheets (but I make no guarantees).
In these older spreadsheets you will most likely only find one instance of
the User-Agent spec, located in a different module, instead of the four instances
described below.
How to apply this bug fix to your copy of these older spreadsheets
You will need to get into the VBA editor (Alt-F11) and then open a FIND (Ctrl-F)
dialog box.
Make sure the “current project” radio button is selected in the
search box.
What you want to find: .SetRequestHeader statements
with the “User-Agent” specification.
There should be four occurrences, all in the module “DataViaWinHTTP.”
Replace each of these user-agent statements with the one provided below:
.SetRequestHeader _
       "User-Agent", _
             "Mozilla/5.0 (Windows NT 10.0; Win64; x64) " & _
              "AppleWebKit/537.36 (KHTML, like Gecko) " & _
	               "Chrome/60.0.3112.90 Safari/537.36"
—Ron McAllister
Excel and VBA programmer
rpmac_xltt@sprynet.com
BACK TO LIST

TRADERSSTUDIO: AUGUST 2019
The importable TradersStudio code file based on John Ehlers’ article
in this issue, “A Peek Into The Future,” can be obtained on request
via email to info@TradersEdgeSystems.com.
The code is also shown below:
'A Peek Into The Future
'Author: John Ehlers, TASC Aug 2019
'Coded by: Richard Denning, 6/14/19
'www.TradersEdgeSystems.com

'FUNCTION TO COMPUTE VOSS PREDICTIVE FILTER
Function VOSS(Period, Predict) As BarArray
    'Period = 20
    'Predict = 3
    Dim Order As BarArray
    Dim F1 As BarArray
    Dim G1 As BarArray
    Dim S1 As BarArray
    Dim Bandwidth As BarArray
    Dim count As BarArray
    Dim SumC As BarArray
    Dim theFilt As BarArray
    Dim theVoss As BarArray

    Bandwidth = .25
    Order = 3*Predict
    F1 = TStation_Cosine(360 / Period)
    G1 = TStation_Cosine(Bandwidth*360 / Period)
    S1 = 1 / G1 - Sqr(1 / (G1*G1) - 1)

    theFilt = .5*(1 - S1)*(Close - Close[2]) + F1*(1 + S1)*theFilt[1] - S1*theFilt[2]
    SumC = 0
    For count = 0 To Order - 1
        SumC = SumC + ((count + 1) / Order)*theVoss[Order - count]
    Next
    theVoss = ((3 + Order) / 2)*theFilt - SumC
    VOSS = theVoss
End Function
'--------------------------------------------------------------------------------------
'FUNCTION TO COMPUTE BANDPASS FILTER (FILT)
Function FILT(Period, Predict) As BarArray
    'Period = 20
    'Predict = 3
    Dim Order As BarArray
    Dim F1 As BarArray
    Dim G1 As BarArray
    Dim S1 As BarArray
    Dim Bandwidth As BarArray
    Dim count As BarArray
    Dim SumC As BarArray
    Dim theFilt As BarArray
    Dim theVoss As BarArray

    Bandwidth = .25
    Order = 3*Predict
    F1 = TStation_Cosine(360 / Period)
    G1 = TStation_Cosine(Bandwidth*360 / Period)
    S1 = 1 / G1 - Sqr(1 / (G1*G1) - 1)

    theFilt = .5*(1 - S1)*(Close - Close[2]) + F1*(1 + S1)*theFilt[1] - S1*theFilt[2]

    SumC = 0
    For count = 0 To Order - 1
        SumC = SumC + ((count + 1) / Order)*theVoss[Order - count]
    Next
    theVoss = ((3 + Order) / 2)*theFilt - SumC
    FILT = theFilt
End Function
'-------------------------------------------------------------------------------------
'INDICATOR PLOT FOR VOSS AND FILT
Sub VOSS_IND(Period, Predict)
    'Period = 20
    'Predict = 3
    Dim theFILT As BarArray
    Dim theVOSS As BarArray

    theFILT = FILT(Period,Predict)
    theVOSS = VOSS(Period,Predict)
    plot1(theFILT)
    plot2(theVOSS)
End Sub
'--------------------------------------------------------------------------------------
Figure 10 shows the FILT and VOSS indicators on a chart of Apple Inc. (AAPL)
during 2011.

FIGURE 10: TRADERSSTUDIO. The FILT
and VOSS indicators are shown on a chart of Apple Inc. (AAPL).
—Richard Denning
info@TradersEdgeSystems.com
for TradersStudio
BACK TO LIST
Originally published in the August 2019 issue of
Technical Analysis of STOCKS & COMMODITIES magazine.
All rights reserved. © Copyright 2019, Technical Analysis, Inc.


