TRADERS’ TIPS
September 2019

For this month’s Traders’ Tips, the focus is Perry J. Kayfman’s
article in this issue, “A Simple Way To Trade Seasonality.” Here,
we present the September 2019 Traders’ Tips code with possible implementations
in various software.
You can right-click on any chart to open it in a new tab or window
and view it at it’s originally supplied size, often much larger than
the version printed in the magazine.
The Traders’ Tips section is provided to help the reader implement
a selected technique from an article in this issue or another recent issue.
The entries here are contributed by software developers or programmers for
software that is capable of customization.

TRADESTATION: SEPTEMBER 2019
In “A Simple Way To Trade Seasonality” in this issue, author Perry
Kaufman describes methods he uses for measuring the seasonality in markets
and approaches he uses for trading these patterns.
We have created EasyLanguage code that can be used in the TradeStation platform
to help visualize market seasonality. The code presented here should be applied
to a chart with a monthly interval with sufficient history to encompass the
range of dates of interest.
Indicator: Monthly Seasonality

using elsystem ;
using elsystem.collections ;
using elsystem.windows.forms ;
using elsystem.drawing ;
using tsdata.common ;

variables:
	Dictionary DataDic( NULL ),
	Dictionary ResultsDic( NULL ),
	TokenList Months( NULL ),
	Form MainForm( NULL ),
	Chart TestChart( NULL ),
	ChartArea Area( NULL ),
	ChartSeries Series( NULL ),
	DataPoint Pt( NULL ),
	string MonthList( "JAN,FEB,MAR,APR,MAY,JUN,"
		+ "JUL,AUG,SEP,OCT,NOV,DEC" ) ;

method void Init()
begin
	Months = TokenList.Create( MonthList ) ;
	DataDic = new Dictionary ;
	ResultsDic = new Dictionary ;
	for value1 = 0 to Months.Count -1
	begin
		DataDic.Add( Months[value1], vector.Create() ) ;
		ResultsDic.Add( Months[value1], 0 ) ;
	end ;
end ;

method void CheckBarInterval()
begin
	if  bartype <> 4 then
		throw Exception.Create( "Chart Interval Must Be Monthly" ) ;
end ;

method void AddData()
begin
	( DataDic.Items[Months[Month( Date ) -1]]
		astype vector ).insert( 0, Close - Open ) ;
end ;

method void AnalyzeData( string Mon)
variables: int VCount, int UpCount, int DnCount, int Idx ;
begin
	VCount = ( DataDic.Items[Mon] astype vector ).Count ;
	for Idx = 0 to VCount - 1
	begin
		if ((( DataDic.Items[Mon] astype vector )[Idx]
			astype double ) > 0 ) then
			UpCount += 1
		else
			DnCount += 1 ;
	end  ;
	if VCount > 0 then
		begin
			ResultsDic.items[Mon] = UpCount/VCount
				astype double ;
		end ;
end ;

method void PrintResults()
variables: int Idx ;
begin
Print( Description ) ;
Print( "  " );
Print( "  " );
Print( "Month" + Spaces( 4 ) + "% Up" ) ;
Print( "---------------" ) ;

for Idx = 0 to Months.Count -1
	begin
		if ResultsDic.Contains( Months[Idx] ) then
			Print( Months[Idx] + Spaces( 4 ),
				ResultsDic.Items[Months[Idx]]
					astype double ) ;
	end ;
end ;

method void CreateChart()
begin
	MainForm = Form.Create("Seasonality", 200, 300) ;
	MainForm.Dock = DockStyle.Bottom ;
	TestChart = Chart.Create(200, 200) ;
	TestChart.Dock = DockStyle.fill ;
	TestChart.BackColor = color.FromArgb( 12,14,16 ) ;
	Area = new ChartArea("") ;
	Area.BackColor = Color.FromArgb( 12,14,16 ) ;
	Area.AxisY.Title = Symbol + Spaces( 2 )
		+ "% of Months Up" ;
	Area.AxisY.TitleFont =
		font.Create( "Courier", 10 ) ;
	Area.AxisY.LabelForeColor = Color.AntiqueWhite ;
	Area.AxisY.Maximum = 1.0 ;
	Area.AxisY.MajorGridEnabled = true ;
	Area.AxisY.MajorGridLineColor =
		Color.fromargb( 65,65,65) ;
	Area.AxisX.LabelForeColor = color.AntiqueWhite ;
	Area.AxisX.LineColor = color.DarkGray ;
	Area.AxisY.Linecolor = color.DarkGray ;
	TestChart.ChartAreas.Add( Area ) ;
	Series = new ChartSeries("") ;
	Series.ChartType = SeriesChartType.Column ;
	TestChart.ChartSeries.Add( Series ) ;
	for Value1 = 0 to Months.Count -1
	begin
		Pt = DataPoint.Create( 0,
			ResultsDic.Items[Months[Value1]] astype double ) ;
		Pt.Color = Color.FromArgb( 0,100,150) ;
		Pt.AxisLabel = Months[Value1] ;
		Series.Points.Add( Pt ) ;
	end;
	MainForm.AddControl( TestChart ) ;
	MainForm.Show() ;
end;

once
begin
	ClearPrintlog ;
	CheckBarInterval() ;
	Init() ;
end ;

if BarStatus( 1 ) = 2 then
	AddData() ;

once ( LastBarOnChartEx )
begin
	for value1 = 0 to Months.Count -1
	begin
		AnalyzeData( Months[value1] ) ;
	end ;
	PrintResults() ;
	CreateChart() ;
end ;
To download the EasyLanguage code, please visit our TradeStation and EasyLanguage
support forum. The files for this article can be found here: https://community.tradestation.com/Discussions/Topic.aspx?Topic_ID=156727.
The filename is “TASC_SEP2019.ZIP.” For more information about
EasyLanguage in general, please see https://www.tradestation.com/EL-FAQ.
A sample chart is shown in Figure 1.

FIGURE 1: TRADESTATION. This shows
a monthly chart of the S&P 500 with the seasonality indicator applied.
This article is for informational purposes. No type of trading or investment
recommendation, advice, or strategy is being made, given, or in any manner
provided by TradeStation Securities or its affiliates.
—Doug McCrary
TradeStation Securities, Inc.
www.TradeStation.com
BACK TO LIST

THINKORSWIM: SEPTEMBER 2019
We have put together a study for thinkorswim based on the article in this
issue titled “A Simple Way To Trade Seasonality” by Perry Kaufman.
We built the strategy referenced by using our proprietary scripting language,
thinkscript. To ease the loading process, simply click on https://tos.mx/U699G4 or
enter the URL into setup—open shared item within thinkorswim. Then choose preview and OK and
rename the strategy “SeasonTrading” and click OK. You
can then add the strategy to your chart from the edit study and strategies menu
within thinkorswim. Please note that due to the algorithm used, this will only
work on monthly timeframe charts.
The strategy can be seen in Figure 2 on a 10-year monthly chart of corn futures
(/ZN). Entry and exit points are displayed on the chart based on the strategy
itself as well as the profit/loss generated by the strategy for each entry
and exit. See Perry Kaufman’s article in this issue for more details
on the strategy.

FIGURE 2: THINKORSWIM. The strategy
is shown on a 10-year monthly chart of corn futures (/ZN).
—thinkorswim
A division of TD Ameritrade, Inc.
www.thinkorswim.com
BACK TO LIST

WEALTH-LAB: SEPTEMBER 2019
To my taste. it’s pleasant when a trading method makes sense to the
extent that it can be explained in layman’s terms. In his article in
this issue, “A Simple Way To Trade Seasonality,” author Perry Kaufman
presents exactly such a technique that is simple and applicable to any instrument
that demonstrates seasonal patterns. Wealth-Lab allows traders implement this
seasonal trading system with additional visualization logic.
You can examine the strategy code in C# shown below, which implements the
trading system based on the frequency of positive returns. To make its output
more visual, let’s also plot the frequency of positive returns by month.
We’ll plot it as a histogram on-the-fly using the power provided by .NET
framework. Its charting engine extends Wealth-Lab’s potential of plotting
various objects, images, and text.
using System;
using System.Collections.Generic;
using System.Text;
using System.Drawing;
using WealthLab;
using WealthLab.Indicators;
using System.Linq;	//Click "References...", check "System.Core", click OK
using System.IO;
using System.Globalization;
using System.Windows.Forms.DataVisualization.Charting;
//1. Click "References...", then "Other Assemblies..." > "Add a reference"
//2. In "C:\Windows\Microsoft.NET\Framework64\v4.0.30319\" (or "Framework" on 32-bit systems),
//choose and okay "System.Windows.Forms.DataVisualization.dll"

namespace WealthLab.Strategies
{
	public class SC_2019_09_KaufmanSeasonality : WealthScript
	{
		private StrategyParameter paramYears;
		private StrategyParameter paramPrice;
		private StrategyParameter paramThresholdHigh;
		private StrategyParameter paramThresholdLow;

		public SC_2019_09_KaufmanSeasonality()
		{
			paramYears = CreateParameter("Average, Years", 4, 2, 100, 1);
			paramPrice = CreateParameter("Use (H+L)/2 or Close", 0, 0, 1, 1);
			paramThresholdHigh = CreateParameter("High freq >", 75, 50, 90, 5);
			paramThresholdLow = CreateParameter("Low freq <", 25, 5, 50, 5);
		}

		protected override void Execute()
		{
			if (Bars.Scale != BarScale.Monthly)
			{
				DrawLabel( PricePane, "Please switch to Monthly scale");
				Abort();
			}

			var howManyYearsToAverage = paramYears.ValueInt;
			var firstYearWithValidData = Date[0].Year + howManyYearsToAverage;
			var startBar = DateTimeToBar(new DateTime( firstYearWithValidData, 12, 31), false);

			//3. Only trade if the high frequency is 75 % or greater and the low frequency is 25 % or lower.
			var thresholdHigh = paramThresholdHigh.ValueInt / 100d;
			var thresholdLow = paramThresholdLow.ValueInt / 100d;

			//Average annual price
			DataSeries avgYearlyPrice = AveragePrice.Series(BarScaleConverter.ToYearly(Bars));

			//Average monthly prices (take AveragePrice or simply Close)
			SetScaleMonthly();
			DataSeries avgMonthlyPrice = paramPrice.ValueInt == 0 ? AveragePrice.Series(Bars) : Close;
			RestoreScale();

			avgMonthlyPrice = Synchronize( avgMonthlyPrice);
			avgYearlyPrice = Synchronize( avgYearlyPrice);

			HideVolume();

			//Collect monthly average price
			var lstMonths = new List<MonthData>();
			for (int bar = 1; bar < Bars.Count; bar++)
			{
				if (Date[bar].Month != Date[bar - 1].Month) //New month
				{
					lstMonths.Add(new MonthData(Date[bar].Month, Date[bar].Year, avgMonthlyPrice[bar]));
				}
			}

			//Calculations
			for (int bar = GetTradingLoopStartBar( startBar); bar < Bars.Count; bar++)
			{
				if (bar <= 0)
					continue;

				int yearTo = Date[bar].Year;
				int yearFrom = yearTo - 1 - howManyYearsToAverage;

				//Average price by year
				var yearlyAverages = lstMonths.GroupBy(i => i.Year)
					.Where(i => i.Key < yearTo & i.Key >= yearFrom)
					.Select(g => new { Year = g.Key, Average = g.Average(a => a.AvgPrice) });

				var lstFreqUp = new Dictionary<int, double>();
				var lstBreakdown = new Dictionary<int, Tuple<double, double>>();

				//Calculate Monthly Adjusted Returns, Up Months and Frequency of Positive Returns
				for (int month = 1; month <= 12; month++)
				{
					int monthCount = 0, upMonths = 0;
					double freqUp = 0d, monthlyAdjReturn = 0d;

					foreach (var _m in lstMonths)
					{
						//Ensure this year's data is excluded from processing and trading
						if (_m.Month == month && _m.Year < yearTo && _m.Year >= yearFrom)
						{
							monthCount++;

							var givenYearAverage = yearlyAverages.GroupBy(i => i.Year).
								Where(i => i.Key == _m.Year).First().ToList();

							var _adjReturn = _m.AvgPrice / givenYearAverage[0].Average - 1;
							if (_adjReturn > 0)
								upMonths++;

							monthlyAdjReturn += _adjReturn;
						}
					}

					if (monthCount > 0)
					{
						freqUp = upMonths / (double)monthCount;
						monthlyAdjReturn /= monthCount;
					}

					//1. Average the monthly frequency of the past N years.
					lstFreqUp.Add(month, freqUp);
					lstBreakdown.Add(month, new Tuple<double, double>(freqUp, monthlyAdjReturn));
				}

				//Plot actual chart of Frequency of Positive Returns (for last N years)
				if(bar == Bars.Count-1)
				{
					Chart chart = new Chart();							//Histogram chart
					chart.BackColor = Color.Transparent;
					chart.Width = 500;
					string name = "Bins";
					chart.ChartAreas.Add(name);
					chart.ChartAreas[0].AxisX.MajorGrid.Enabled = chart.ChartAreas[0].AxisY.MajorGrid.Enabled = false;
					chart.ChartAreas[0].AxisX.Title = "Month";		//Custom axis titles
					chart.ChartAreas[0].AxisY.Title = "Frequency of Positive Returns";
					chart.ChartAreas[0].BackColor = Color.Transparent;
					chart.ChartAreas[0].AxisY.Minimum = 0; chart.ChartAreas[0].AxisY.Maximum = 100;
					chart.Series.Add(name);
					chart.Series[name].ChartType = SeriesChartType.Column;

					foreach (var f in lstFreqUp)
					{
						chart.Series[name].Points.AddXY(
							CultureInfo.GetCultureInfo("en-US").DateTimeFormat.GetMonthName(f.Key), f.Value * 100d);
					}

					using (MemoryStream memStream = new MemoryStream()) {
						chart.SaveImage(memStream, ChartImageFormat.Png);
						Image img = Image.FromStream(memStream);
						DrawImage( PricePane, img, Bars.Count-50, Close[Bars.Count-50], false );
					}
				}

				//Trading
				if( IsLastPositionActive)
				{
					int monthToExit = (int)LastPosition.Tag;
					if (Date[bar].Month == monthToExit)
						ExitAtClose(bar, LastPosition, monthToExit.ToString());
				}
				else
				{
					//Month numbers with frequency higher (lower) than a threshold
					var highFreqMonths = lstFreqUp.Where(p => p.Value > thresholdHigh);
					var lowFreqMonths = lstFreqUp.Where(p => p.Value < thresholdLow);
					var resultsAreValid = (highFreqMonths.Count() > 0 && lowFreqMonths.Count() > 0);

					if (resultsAreValid)
					{
						//2. Find the last occurrences of the highest (lowest) frequency
						int lastHighestFrequencyMonth = 0, lastLowestFrequencyMonth = 0;
						lastHighestFrequencyMonth = highFreqMonths.LastOrDefault().Key;
						lastLowestFrequencyMonth = lowFreqMonths.LastOrDefault().Key;

						//4.If the high frequency comes first, sell short at the end of the month with the high frequency.
						if (lastHighestFrequencyMonth < lastLowestFrequencyMonth)
						{
							if (Date[bar].Month == lastHighestFrequencyMonth)
								if( ShortAtClose(bar, lastHighestFrequencyMonth.ToString()) != null)
									//Cover the short at the end of the month with the low frequency.
									LastPosition.Tag = (object)lastLowestFrequencyMonth;
						}
							//5. If the low frequency comes first, buy at the end of the month with the low frequency.
						else
						{
							if (Date[bar].Month == lastLowestFrequencyMonth)
								if( BuyAtClose(bar, lastLowestFrequencyMonth.ToString()) != null)
									//Sell to exit at the end of the month with the high frequency.
									LastPosition.Tag = (object)lastHighestFrequencyMonth;
						}
					}
				}
			}
		}
	}

	public class MonthData
	{
		public MonthData() { }
		public MonthData(int month, int year, double avgPrice)
		{
			Month = month; Year = year; AvgPrice = avgPrice;
		}

		private int _month;

		public int Month
		{
			get { return _month; }
			set { _month = value; }
		}

		private int _year;

		public int Year
		{
			get { return _year; }
			set { _year = value; }
		}

		private double _avgPrice;

		public double AvgPrice
		{
			get { return _avgPrice; }
			set { _avgPrice = value; }
		}
	}
}
The oil ETF shown in Figure 3 is a good example, as it clearly demonstrates
a recent (rolling four-year) seasonality pattern of increasing frequency of
positive returns from May to July, and the opposite in November. There are
many factors contributing to its seasonality, so let’s mention just some
of them: vehicle sales tend to drop in the winter (and demand for gasoline
with them); oil is known to rise during the heating season; summer’s
air conditioning spurs power generation which again uses oil, and so on.

FIGURE 3: WEALTH-LAB. The histogram
that overlays the chart of USO (US Oil Fund ETF) shows the frequency of positive
returns by month.
Since it has some prerequisites, it’s preferred that you simply download
this code in Wealth-Lab rather than copying and pasting the code into Wealth-Lab.
To download it, from within Wealth-Lab, press ctrl-O and choose download.
—Eugene (Gene) Geren, Wealth-Lab team
MS123, LLC
www.wealth-lab.com
BACK TO LIST

NEUROSHELL TRADER: SEPTEMBER 2019
The seasonality trading system described by Perry Kaufman in his article in
this issue, “A Simple Way To Trade Seasonality,” can be easily
implemented in NeuroShell Trader.
To calculate the monthly return frequency of the past four years, select new
indicator from the insert menu and use the indicator wizard
to set up the following indicator:
MonthlyFreq:
CategoryAverage( A>B(%Change(Close,1),0), Month of Year(Date), 84)
To set up the seasonality trading system, select new trading strategy from
the insert menu and enter the following in the appropriate locations
of the Trading Strategy Wizard:
BUY LONG CONDITIONS: [all of which must be true]
A=B(MonthlyFreq, SelectiveMin(MonthlyFreq, LastBusinessDayOfMonthFlag(Date), 12)))
LastBusinessDayOfMonthFlag (Date)

SELL SHORT CONDITIONS: [all of which must be true]
A=B(MonthlyFreq, SelectiveMax(MonthlyFreq, LastBusinessDayOfMonthFlag (Date), 12)))
LastBusinessDayOfMonthFlag (Date)
After entering the system conditions, you can also choose whether the parameters
should be optimized. After backtesting the trading strategy, use the detailed
analysis button to view the backtest and trade-by-trade statistics for
the system.
Users of NeuroShell Trader can go to the Stocks & Commodities section
of the NeuroShell Trader free technical support website to download a copy
of this or any previous Traders’ Tips.
A sample chart is shown in Figure 4.

FIGURE 4: NEUROSHELL TRADER. This
NeuroShell Trader chart shows the seasonality system applied across eight
seasonal stocks.
—Marge Sherald,
Ward Systems Group, Inc.
301 662-7950, sales@wardsystems.com
www.neuroshell.com
BACK TO LIST

NINJATRADER: SEPTEMBER 2019
The seasonal trading strategy discussed by Perry Kaufman in his article in
this issue, “A Simple Way To Trade Seasonality,” is available for
download at the following links for NinjaTrader 8 and for NinjaTrader 7:
Once the file is downloaded, you can import the strategy into NinjaTader 8
from within the Control Center by selecting Tools → Import → NinjaScript
Add-On and then selecting the downloaded file for NinjaTrader 8. To import
in NinjaTrader 7 from within the Control Center window, select the menu File → Utilities → Import
NinjaScript and select the downloaded file.
You can review the strategy’s source code in NinjaTrader 8 by selecting
the menu New → NinjaScript Editor → Strategies from within the Control
Center window and selecting the SeasonalTradingStrategy file. You can review
the indicator’s source code in NinjaTrader 7 by selecting the menu Tools → Edit
NinjaScript → Strategy from within the Control Center window and selecting
the SeasonalTradingStrategy file.
NinjaScript uses compiled DLLs that run native, not interpreted, which provides
you with the highest performance possible.
A sample chart implementing the strategy is shown in Figure 5.

FIGURE 5: NINJATRADER. The seasonal
trading strategy is displayed on a one-month ZC 09-19 chart from January
2010 to July 2019.
—Raymond Deux & Chris Lauber
NinjaTrader, LLC
www.ninjatrader.com
BACK TO LIST

AIQ: SEPTEMBER 2019
The importable AIQ EDS file and Excel spreadsheet for Perry Kaufman’s
article in this issue, “A Simple Way To Trade Seasonality,” can
be obtained on request via email to info@TradersEdgeSystems.com.
The code is also shown here.
!A Simple Way to Trade Seasonality
!Author: Perry Kaufman, TASC September 2019
!Coded by: Richard Denning, 07/21/2019
!www.TradersEdgeSystem.com

C is [close].
year is 2019.
len is 4000.
OSD is offsettodate(month(),day(),year()).
FirstDate is firstdatadate().

EOM1 if Month()=2 and valresult(month(),1)=1 and year()=year.
EOMos1 is scanany(EOM1,len) then OSD+1.
EOMc1 is valresult(C,^EOMos1).
EOM2 if Month()=3 and valresult(month(),1)=2 and year()=year.
EOMos2 is scanany(EOM2,len) then OSD+1.
EOMc2 is valresult(C,^EOMos2).
EOM3 if Month()=4 and valresult(month(),1)=3 and year()=year.
EOMos3 is scanany(EOM3,len) then OSD+1.
EOMc3 is valresult(C,^EOMos3).
EOM4 if Month()=5 and valresult(month(),1)=4 and year()=year.
EOMos4 is scanany(EOM4,len) then OSD+1.
EOMc4 is valresult(C,^EOMos4).
EOM5 if Month()=6 and valresult(month(),1)=5 and year()=year.
EOMos5 is scanany(EOM5,len) then OSD+1.
EOMc5 is valresult(C,^EOMos5).
EOM6 if Month()=7 and valresult(month(),1)=6 and year()=year.
EOMos6 is scanany(EOM6,len) then OSD+1.
EOMc6 is valresult(C,^EOMos6).
EOM7 if Month()=8 and valresult(month(),1)=7 and year()=year.
EOMos7 is scanany(EOM7,len) then OSD+1.
EOMc7 is valresult(C,^EOMos7).
EOM8 if Month()=9 and valresult(month(),1)=8 and year()=year.
EOMos8 is scanany(EOM8,len) then OSD+1.
EOMc8 is valresult(C,^EOMos8).
EOM9 if Month()=10 and valresult(month(),1)=9 and year()=year.
EOMos9 is scanany(EOM9,len) then OSD+1.
EOMc9 is valresult(C,^EOMos9).
EOM10 if Month()=11 and valresult(month(),1)=10 and year()=year.
EOMos10 is scanany(EOM10,len) then OSD+1.
EOMc10 is valresult(C,^EOMos10).
EOM11 if Month()=12 and valresult(month(),1)=11 and year()=year.
EOMos11 is scanany(EOM11,len) then OSD+1.
EOMc11 is valresult(C,^EOMos11).
EOM12 if Month()=1 and valresult(month(),1)=12 and valresult(year(),1)=year.
EOMos12 is scanany(EOM12,len) then OSD+1.
EOMc12 is valresult(C,^EOMos12).
YEARavg is (EOMc1+EOMc2+EOMc3+EOMc4+EOMc5+EOMc6+EOMc7+EOMc8+EOMc9+EOMc10+EOMc11+EOMc12)/12.

AR1 is (EOMc1 / YEARavg-1)*100.
AR2 is (EOMc2 / YEARavg-1)*100.
AR3 is (EOMc3 / YEARavg-1)*100.
AR4 is (EOMc4 / YEARavg-1)*100.
AR5 is (EOMc5 / YEARavg-1)*100.
AR6 is (EOMc6 / YEARavg-1)*100.
AR7 is (EOMc7 / YEARavg-1)*100.
AR8 is (EOMc8 / YEARavg-1)*100.
AR9 is (EOMc9 / YEARavg-1)*100.
AR10 is (EOMc10 / YEARavg-1)*100.
AR11 is (EOMc11 / YEARavg-1)*100.
AR12 is (EOMc12 / YEARavg-1)*100.

EOMc if firstdate < makedate(1,20,2019-20).
AR if EOMc.
The EDS code is not a trading system but a way to get the data needed into
an Excel spreadsheet to enable you to make the seasonal calculations. The EDS
file should be run on a date after the end of the year being calculated. Each
year for which data is needed must be run separately by setting the “year” variable.
Multiple symbols can be run at the same time by using a list of the desired
symbols. Each time a year is run, the “AR” report must be saved
as a “.csv” file. Once all the years needed have been run and saved
to separate “.csv” files, they all should be cut and pasted to
a single Excel sheet. They then can be sorted by symbol and each symbol can
be copied and pasted to a tab for that symbol.
Figure 6 shows the rolling four-year frequency for the S&P 500 ETF (SPY)
and Figure 7 shows the annual trades resulting from applying the seasonal rules
to the frequency data.

FIGURE 6: AIQ. Shown here is the
rolling four-year frequency for the SPY.

FIGURE 7: AIQ. Shown here are the
annual trades resulting from applying the seasonal rules to the frequency
data for SPY.
—Richard Denning
info@TradersEdgeSystems.com
for AIQ Systems
BACK TO LIST

TRADERSSTUDIO: SEPTEMBER 2019
The importable TradersStudio code file and Excel sheet based on Perry Kaufman’s
article in this issue, “A Simple Way To Trade Seasonality,” can
be obtained on request via email to info@TradersEdgeSystems.com.
The code is also shown here.
'A Simple Way to Trade Seasonality
'Author: Perry Kaufman, TASC September 2019
'Coded by: Richard Denning, 07/21/2019
'www.TradersEdgeSystem.com

Sub SEASONAL(startYear)
Dim i As Integer
Dim theYear As Integer
Dim avgMonC
Dim arJan,arFeb,arMar,arApr,arMay,arJun
Dim arJul,arAug,arSep,arOct,arNov,arDec

  If Month(Date) = 12 and year(date)>= startYear Then
    avgMonC = Average(C,12)
    arJan = C[11]/avgMonC - 1
    arFeb = C[10]/avgMonC - 1
    arMar = C[9]/avgMonC - 1
    arApr = C[8]/avgMonC - 1
    arMay = C[7]/avgMonC - 1
    arJun = C[6]/avgMonC - 1
    arJul = C[5]/avgMonC - 1
    arAug = C[4]/avgMonC - 1
    arSep = C[3]/avgMonC - 1
    arOct = C[2]/avgMonC - 1
    arNov = C[1]/avgMonC - 1
    arDec = C[0]/avgMonC - 1

    Print Year(Date)," ",arJan," ",arFeb," ",arMar," ",arApr," ",arMay," ",arJun," ",arJul," ",arAug," ",arSep," ",arOct," ",arNov," ",arDec
  EndIf
End Sub
The code supplied is not a system for trading the seasonal. It should be set
up in a session with a single symbol with data compressed to monthly. When
the session is run, it will create a terminal window with the adjusted return
data by month for each year in the selected period. You then right-click inside
the terminal window and copy the data to the clipboard. Open a blank Excel
sheet and paste the data from the clipboard. You may need to choose the “text
to columns” function in Excel to get it to format correctly. Alternatively,
you can save the terminal data as an .csv sheet and then open it in Excel.
You can then use this data to determine the frequency for any period of years
of your choosing.
Figure 8 shows the adjusted return data for Apple, Inc. (AAPL) and Figure
9 shows the frequency data for rolling four-year periods starting with 1987–1990.
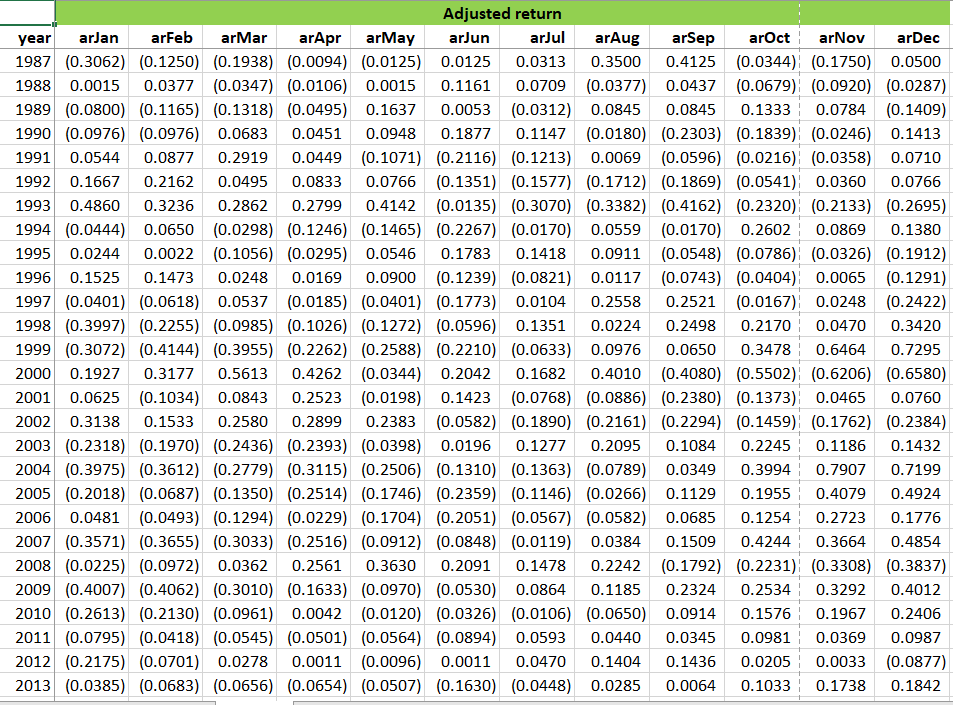
FIGURE 8: TRADERSSTUDIO. This Excel
sheet shows the adjusted return data for Apple Inc. (AAPL).
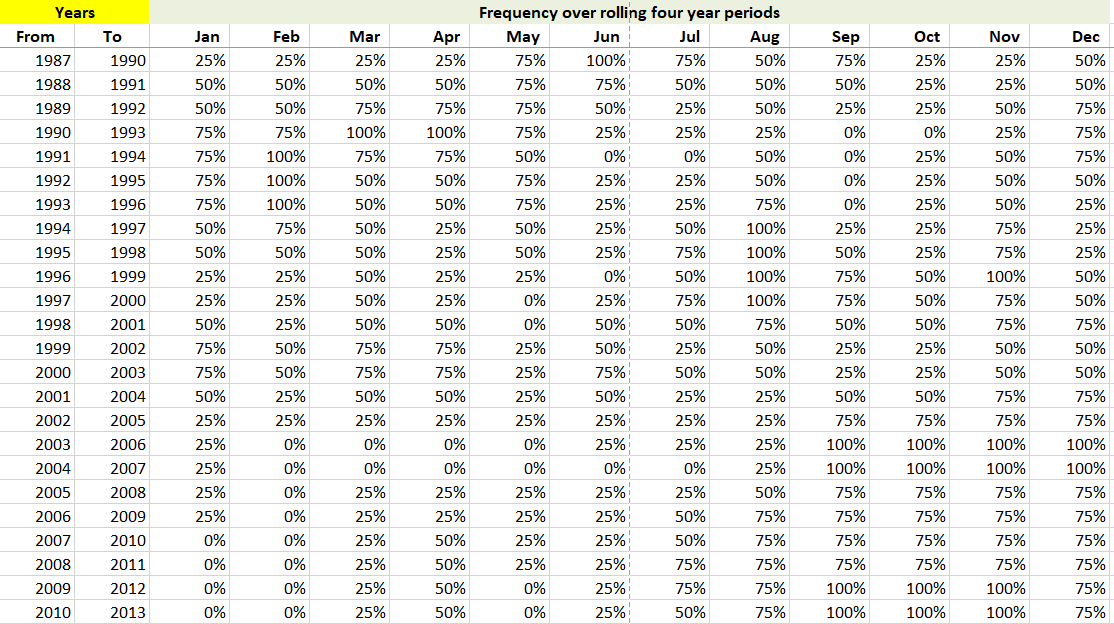
FIGURE 9: TRADERSSTUDIO. This Excel
sheet shows the rolling four-year frequency for Apple Inc. (AAPL).
—Richard Denning
info@TradersEdgeSystems.com
for TradersStudio
BACK TO LIST
MICROSOFT EXCEL: SEPTEMBER 2019
In his article in this issue, “A Simple Way To Trade Seasonality,” author
Perry Kaufman presents a fun way to look at seasonality that is straightforward
and easy to compute on a spreadsheet.
In this spreadsheet, I have retained the ComputationsAndCharts tab to allow
the user to look at the daily price action, but this tab does not directly
participate in the seasonality computations. All of the necessary seasonality
and backtesting computations take place on the SeasonalityTables tab.
Left to right across this tab, there are four computational stages that replicate
the steps presented by Kaufman to evaluate the seasonality behavior of an equity.
I will follow this with a fifth stage that performs a long and short backtest
as chosen by the seasonality of a given year.
The upper portion of Figure 10 graphically summarizes results found farther
to the right on this tab (see Figure 13). The middle area deals with some basic
statistics for the current symbol of interest.
Figure 11 shows price expressed as a percentage of the annual average.
Figure 13 shows the final seasonality calculations derived from the numbers
in Figure 12 (monthly averages). On the left, we have the percentage of instances
that a given month was up relative to its annual average for each of its lookback
years. The background is color-coded to show what amounts to a heatmap (similar
in concept to what we saw in Figure 10) of where the percentages fall within
Kaufman’s suggested thresholds.
On the right we have the calculation of the lowest low month and the highest
high month for each of our years. Per Kaufman’s rules, for duplicates,
choose the higher month.
At the far right, using the relationship of the month numbers for a given
year determines if we should trade long or short for that year.
The backtest computation (Figure 14) is fairly straightforward in concept.
Use the number representation of the low and high month for a given year to
project month-end trading dates into the next trading year. Look up the corresponding
actual month-end date and price on the InputPriceData tab and compute the backtest
transaction for that year.
In this example, we only have data through 7/19/2019. So we can resolve a
last trading date for June of 2019. However, we cannot resolve a last trading
date or pricing for November of 2019. This results in the incomplete transaction
on the first line of the long side of the backtest.

FIGURE 10: EXCEL, FIRST STAGE OF
COMPUTATIONS. This shows a table of month-end prices by year.

FIGURE 11: EXCEL, SECOND STAGE.
Here, price is expressed as a percentage of annual average.

FIGURE 12: EXCEL, THIRD STAGE.
Shown here are the monthly averages over the lookback period. This is informational
only and not used directly in the computations.
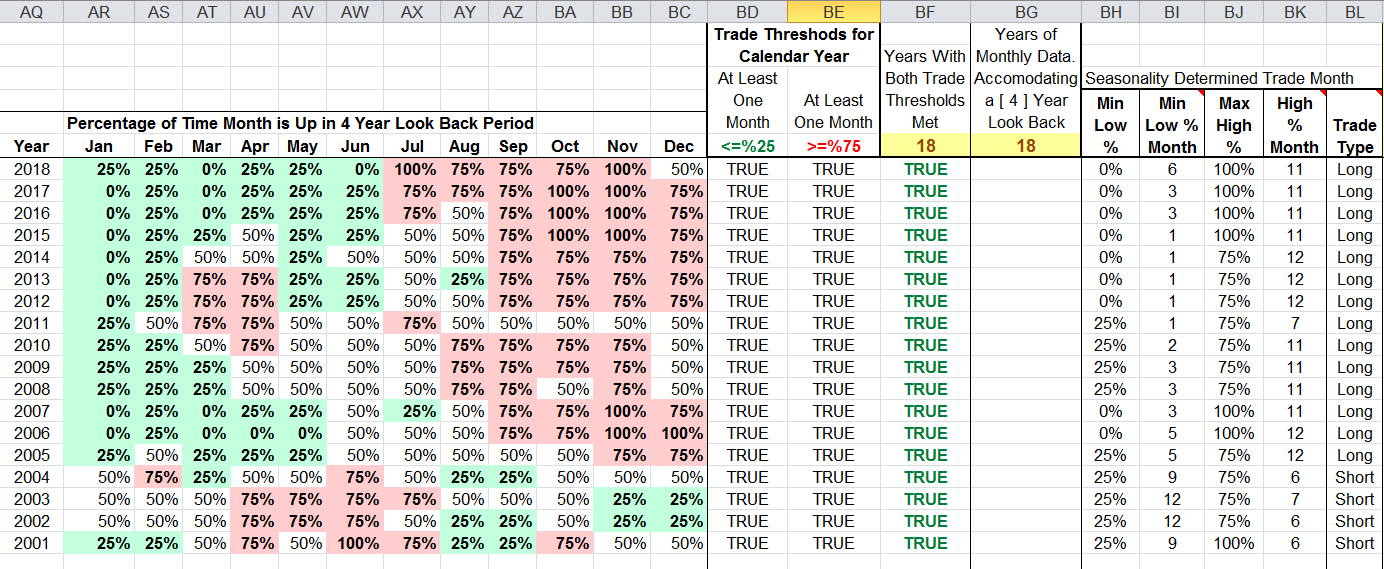
FIGURE 13: EXCEL, FOURTH STAGE.
Shown here is a seasonality summary.
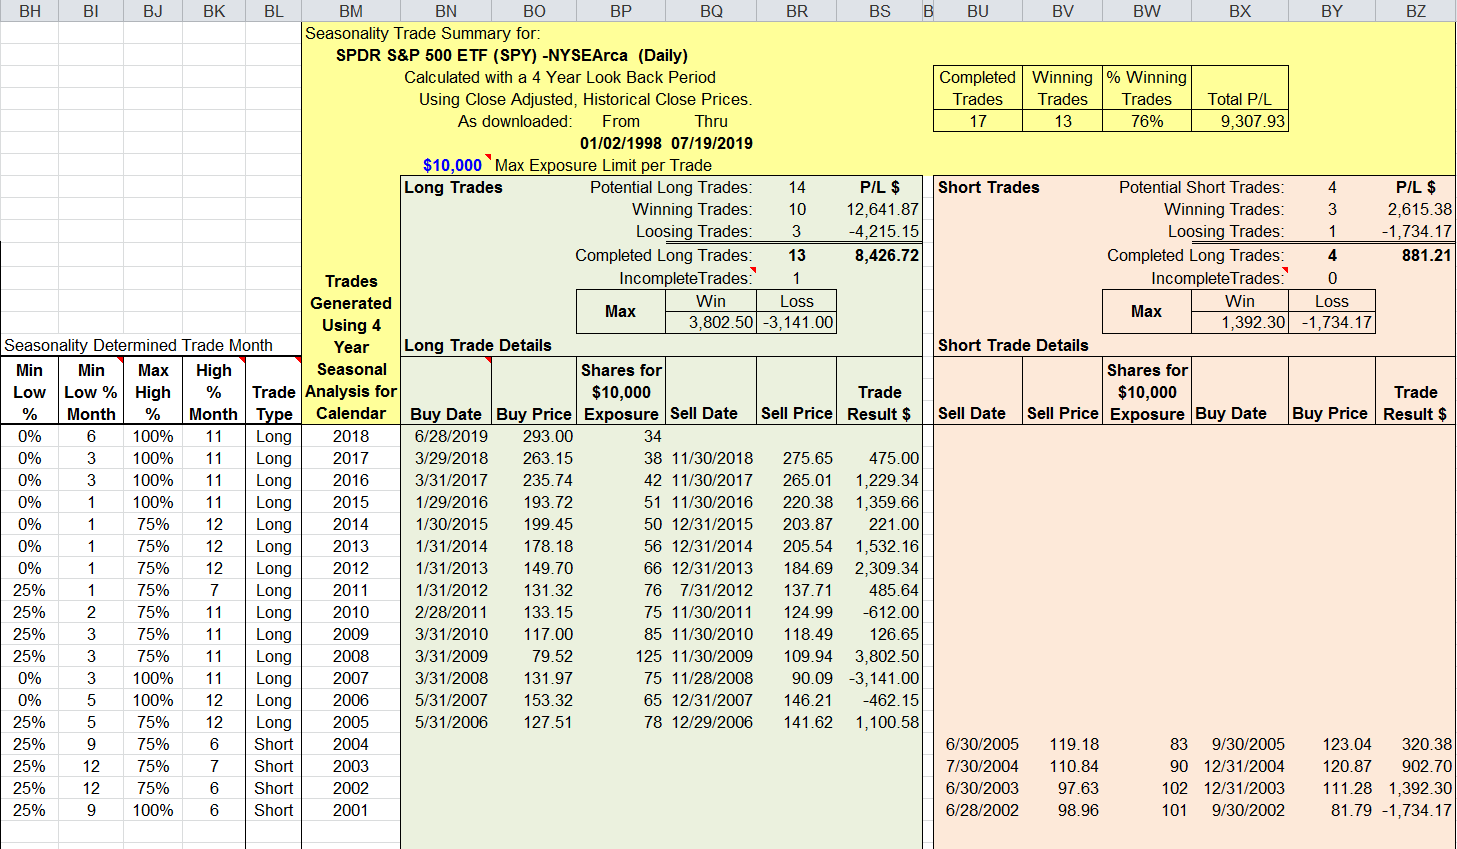
FIGURE 14: EXCEL, BACKTEST. Here,
the seasonality results are used for a simple backtest.
So here’s a thought: annual wrap around! A year-end wraparound
is a potential extension of our seasonality backtest.
In Figure 14, we have a string of consecutive years that all want to trade
as long. We could easily add a short transaction wrapping around year-end
using the high month and price of the current year and projecting the low month
of the current year into the next year for pricing.
Similarly, we could wrap a year-end long transaction onto the years preferring
short trading.
The spreadsheet file for this Traders’ Tip can be downloaded here.
To successfully download it, follow these steps:
- Right-click on the Excel
file link, then
- Select “save as” (or “save target as”) to place
a copy of the spreadsheet file on your hard drive.
—Ron McAllister
Excel and VBA programmer
rpmac_xltt@sprynet.com
BACK TO LIST
Originally published in the September 2019 issue of
Technical Analysis of STOCKS & COMMODITIES magazine.
All rights reserved. © Copyright 2019, Technical Analysis, Inc.


