TRADERS’ TIPS
October 2019

For this month’s Traders’ Tips, the focus is awel Kosinski’s article in this issue, “Combining Bollinger Bands With Candlesticks.” Here, we present the October 2019 Traders’ Tips code with possible implementations in various software.
You can right-click on any chart to open it in a new tab or window and view it at it’s originally supplied size, often much larger than the version printed in the magazine.
The Traders’ Tips section is provided to help the reader implement a selected technique from an article in this issue or another recent issue. The entries here are contributed by software developers or programmers for software that is capable of customization.

TRADESTATION: OCTOBER 2019
In “Combining Bollinger Bands With Candlesticks” in this issue, author Pawel Kosinski introduces us to a trading strategy that combines standard Bollinger Bands with the bullish engulfing candlestick pattern. Along the way we get a glimpse into the author’s process for trading strategy design and testing. Here, we are providing the TradeStation EasyLanguage code for a strategy and PaintBar based on the author’s concepts.
PaintBar Indicator: BB with Candlesticks

inputs:
	Length( 14 ),
	NumDevs( 1 ),
	Price( close ) ;

variables:
	Sdev( 0 ),
	BBUpper( 0 ),
	BBMid( 0 ),
	BBLower( 0 ) ;

method bool IsBullEngulfing()
begin
	return ( Close > Open )
			and ( Close[1] < Open[1] )
			and ( Close > Open[1] )
			and ( Open < Close[1] ) ;
end ;

method bool BollingerBandTrigger()
begin
	return ( Close[1] < BBLower[1] )
			and ( Close > BBLower )
			and ( Low < BBLower ) ;
end ;

BBMid = Average( Price, Length ) ;
SDev = StandardDev( Price, Length, 1 ) ;
BBUpper = BBMid + NumDevs * SDev ;
BBLower = BBMid - NumDevs * SDev ;


if IsBullEngulfing() and BollingerBandTrigger() then
begin
	PlotPB( High, Low, "Trade Signal" ) ;
	Alert( "Trade Signal Long" ) ;
end ;
Strategy: BB with Candlesticks

inputs:
	Length( 20 ),
	NumDevs( 2 ),
	Price( close ) ;

variables:
	Sdev( 0 ),
	BBUpper( 0 ),
	BBMid( 0 ),
	BBLower( 0 ) ;

method bool IsBullEngulfing()
begin
	return ( Close > Open )
			and ( Close[1] < Open[1] )
			and ( Close > Open[1] )
			and ( Open < Close[1] ) ;
end ;

method bool BollingerBandTrigger()
begin
	return ( Close[1] < BBLower[1] )
			and ( Close > BBLower )
			and ( Low < BBLower ) ;
end ;

BBMid = Average( Price, Length ) ;
SDev = StandardDev( Price, Length, 1 ) ;
BBUpper = BBMid + NumDevs * SDev ;
BBLower = BBMid - NumDevs * SDev ;


if IsBullEngulfing() then
	Plot1( High ) ;

if BollingerBandTrigger() then
	PLot2( Low ) ;

Plot3( BBUpper ) ;
Plot4( BBLower ) ;
To download the EasyLanguage code, please visit our TradeStation and EasyLanguage support forum. The files for this article can be found here: https://community.tradestation.com/Discussions/Topic.aspx?Topic_ID=156727. The filename is “TASC_OCT2019.ZIP.”
For more information about EasyLanguage in general. see www.tradestation.com/EL-FAQ.
A sample chart is shown in Figure 1.

FIGURE 1: TRADESTATION. Seen here is a daily chart of AAPL with the Bollinger Bands candlestick indicator and strategy applied.
This article is for informational purposes. No type of trading or investment recommendation, advice, or strategy is being made, given, or in any manner provided by TradeStation Securities or its affiliates.
—Doug McCrary
TradeStation Securities, Inc.
www.TradeStation.com
BACK TO LIST

THINKORSWIM: OCTOBER 2019
We have put together a strategy for thinkorswim based on the article “Combining Bollinger Bands With Candlesticks” by Pawel Kosinski in this issue. We built the strategy referenced by using our proprietary scripting language, thinkScript. To ease the loading process, simply click on https://tos.mx/qSjB5v or enter it into setup—open shared item from within thinkorswim, then choose “view thinkScript strategy” and name it “bollingerbansdswithbulls” or something you can easily recognize. This can then be added to your chart from the edit study and strategies menu within thinkorswim.
In Figure 2, the strategy can be seen on a chart of SPY. In the screenshot, the bullish engulfing is painted as point at close, with the stop-loss level as red points at the stop price. See Pawel Kosinki’s article for more details on how to interpret the strategy.

FIGURE 2: THINKORSWIM. The strategy can be seen on a chart of SPY.
—thinkorswim
A division of TD Ameritrade, Inc.
www.thinkorswim.com
BACK TO LIST

METASTOCK: OCTOBER 2019
Pawel Kosinski’s article in this issue, “Combining Bollinger Bands with Candlesticks,” explains how to construct a trading system based on the analysis tools named in the article’s title. The strategy uses 20-period Bollinger Bands set at 2.2 standard deviations from the center average and four times a 14-period average true range for a maximum loss stop. The entry and exit formulas for that system are shown below for MetaStock:
Buy Order tab:
Formula:
stop:= Ref(C, -1) - (4 * ATR(14));
RR:= (BBandTop(C, 20, S, 2.2)-H)/ (H-RR);
el:= C > Ref(H, -1) AND Ref( EngulfingBull(), -1) AND
Ref( Alert( L < BBandBot(C, 20, S, 2.2), 2), -1) AND RR > 1.0;
xl:= H > BBandTop(C, 20, S, 2.2);
trade:= If( PREV<=0, If(el, stop, 0),
If( L<= PREV, -1, If( xl, -2, PREV)));
trade > 0 AND Ref(trade <= 0, -1)

Sell Order tab:
Formula:
stop:= Ref(C, -1) - (4 * ATR(14));
RR:= (BBandTop(C, 20, S, 2.2)-H)/ (H-RR);
el:= C > Ref(H, -1) AND Ref( EngulfingBull(), -1) AND
Ref( Alert( L < BBandBot(C, 20, S, 2.2), 2), -1) AND RR > 1.0;
xl:= H > BBandTop(C, 20, S, 2.2);
trade:= If( PREV<=0, If(el, stop, 0),
If( L<= PREV, -1, If( xl, -2, PREV)));
trade < 0

Order Type: Stop Limit
Stop or Limit Price:
stop:= Ref(C, -1) - (4 * ATR(14));
RR:= (BBandTop(C, 20, S, 2.2)-H)/ (H-RR);
el:= C > Ref(H, -1) AND Ref( EngulfingBull(), -1) AND
Ref( Alert( L < BBandBot(C, 20, S, 2.2), 2), -1) AND RR > 1.0;
xl:= H > BBandTop(C, 20, S, 2.2);
trade:= If( PREV<=0, If(el, stop, 0),
If( L<= PREV, -1, If( xl, -2, PREV)));
If( trade = -1, Ref(trade, -1), C)
—William Golson
MetaStock Technical Support
www.metastock.com
BACK TO LIST

eSIGNAL: OCTOBER 2019
For this month’s Traders’ Tip, we’re providing the study BollingerBandsandCandlestickStrategy.efs based on the article in this issue by Pawel Kosinski, “Combining Bollinger Bands With Candlesticks.” This strategy combines the Bollinger Bands study with candlesticks.
The studies contain formula parameters that may be configured through the edit chart window (right-click on the chart and select “edit chart”). A sample chart is shown in Figure 3.

FIGURE 3: eSIGNAL. Here is an example of the studies plotted on a daily chart of MFST.
To discuss this study or download a complete copy of the formula code, please visit the EFS Library Discussion Board forum under the forums link from the support menu at www.esignal.com, or visit our EFS KnowledgeBase at www.esignal.com/support/kb/efs/. The eSignal formula script (EFS) is also available for copying & pasting below.
    /**********************************
Provided By:
Copyright 2019 Intercontinental Exchange, Inc. All Rights Reserved.
eSignal is a service mark and/or a registered service mark of Intercontinental Exchange, Inc.
in the United States and/or other countries. This sample eSignal Formula Script (EFS)
is for educational purposes only.
Intercontinental Exchange, Inc. reserves the right to modify and overwrite this EFS file with each new release.

Description:
   Combining Bollinger Bands With Candlesticks
   by Pawel Kosinski


Version:            1.00  08/13/2019

Notes:
The related article is copyrighted material. If you are not a subscriber
of Stocks & Commodities, please visit www.traders.com.

**********************************/


var fpArray = new Array();

function preMain(){
    setPriceStudy(true);
    setStudyTitle("Combining Bollinger Bands With Candlesticks");
    setCursorLabelName("Bollinger and Japanese candlesticks", 0);
    setPlotType(PLOTTYPE_LINE);
    setDefaultBarFgColor(Color.RGB(0x00,0x94,0xFF),0);

    var x = 0;
    fpArray[x] = new FunctionParameter("LowerClose", FunctionParameter.NUMBER);
	with(fpArray[x++]){
        setName("Lower Close");
        setLowerLimit(0);
        setDefault(5);

    }

    fpArray[x] = new FunctionParameter("UpperClose", FunctionParameter.NUMBER);
	with(fpArray[x++]){
        setName("Upper Close");
        setLowerLimit(0);
        setDefault(500);

    }


}

var bInit = false;
var bVersion = null;
var xClose = null;
var ishares = 100;
var xVolume = null;
var xLow = null;
var xOpen = null;
var xHigh = null;
var xUpperBB = null;
var xMiddleBB = null;
var xLowerBB = null;
var fLong = null;
var vRawTime = null;

function main(LowerClose, UpperClose) {
    if (bVersion == null) bVersion = verify();
    if (bVersion == false) return;

    if (getBarState() == BARSTATE_ALLBARS){
        bInit = false;
    }

    if (!bInit){

        xClose = close();
        xVolume = volume();
        xLow = low();
        xOpen = open();
        xHigh = high();
        xUpperBB = upperBB(20,2);
        xMiddleBB = middleBB(20,2);
        xLowerBB = lowerBB(20,2);
        fLong = false;

        bInit = true;
    }

    if (getCurrentBarCount() <=500) {
        drawTextAbsolute(0, 35, "This indicator requires more then 500 bars", Color.red, Color.white,  Text.RELATIVETOBOTTOM|Text.RELATIVETOLEFT|Text.BOLD|Text.LEFT, null, 10, "error");
        return;
    }
    else removeText("error");

    vRawTime = rawtime(0);
    if (vRawTime >  1535846399) return;
    if (vRawTime <  946684800) return;
    if (xClose.getValue(0) <= LowerClose ||  xClose.getValue(0) >= UpperClose) return;
    if (xVolume.getValue(0) <=100000) return;

    if (xClose.getValue(-1) > xLowerBB.getValue(-1) && fLong == false &&
        ((xLow.getValue(-1) < xLowerBB.getValue(-1)) || xLow.getValue(-2) < xLowerBB.getValue(-2)) &&
        (xClose.getValue(-2) < xOpen.getValue(-2) && xClose.getValue(-1) > xOpen.getValue(-1)) &&
        (xOpen.getValue(-1) < xClose.getValue(-2) && xClose.getValue(-1) > xOpen.getValue(-2)) &&
        ((xClose.getValue(-1) - xOpen.getValue(-1)) >  20 * getMinTick() && xClose.getValue(0) > xHigh.getValue(-1))) {

            ishares = parseInt(1000 / xClose.getValue(0));
            drawTextRelative( 0, xHigh.getValue(0) + 10, "Buy Long " + ishares + " shares" , Color.white, Color.green,  Text.ONTOP | Text.CENTER,null, 7, "buylong" + getCurrentBarCount()  );
            addLineTool(LineTool.VERT,  getCurrentBarIndex(), 3, Color.green, "buylongline" + getCurrentBarCount());
            fLong = true;
    }

    if (fLong == true) {
        if (xHigh.getValue(0) > xUpperBB.getValue(0)) {
            drawTextRelative( 0, xLow.getValue(0) - 10, "Exit Long" , Color.white, Color.red,  Text.ONTOP | Text.CENTER,null, 7, "selllong" + getCurrentBarCount()  );
            addLineTool(LineTool.VERT,  getCurrentBarIndex(), 3, Color.red, "selllongline" + getCurrentBarCount() );
            fLong = false;
        }
    }

    return;
}


function verify(){
    var b = false;
    if (getBuildNumber() < 779){

        drawTextAbsolute(5, 35, "This study requires version 10.6 or later.",
            Color.white, Color.blue, Text.RELATIVETOBOTTOM|Text.RELATIVETOLEFT|Text.BOLD|Text.LEFT,
            null, 13, "error");
        drawTextAbsolute(5, 20, "Click HERE to upgrade.@URL=https://www.esignal.com/download/default.asp",
            Color.white, Color.blue, Text.RELATIVETOBOTTOM|Text.RELATIVETOLEFT|Text.BOLD|Text.LEFT,
            null, 13, "upgrade");
        return b;
    }
    else
        b = true;

    return b;
}
—Eric Lippert
eSignal, an Interactive Data company
800 779-6555, www.eSignal.com
BACK TO LIST

QUANTACULA STUDIO: OCTOBER 2019
Quantacula Studio’s candlesticks extension can automatically flag all common candlestick patterns. We used the extension to create a model based on Pawel Kosinski’s concepts described in his article in this issue. Our model buys after the price touches the lower Bollinger Band, and a Bullish Engulfing candlestick pattern has also occurred. Performing a quick backtest on the Nasdaq 100 yielded modest profits of 21.7% over a 10-year period.
We decided to tweak the entry based on a simple technique we like to use. Instead of buying the next day at market open, we buy using a limit order set to the closing price of the signal bar. Most of the time, when prices gap up, they eventually retest the previous day’s close during the trading day. This technique does cause some trades to “get away from you” when they never retest, but overall the value proposition is positive. Applying this simple change doubled the net profit to 42% in our backtest.
Here is the Quantacula Studio C# code for the model.
using QuantaculaBacktest;
using QuantaculaCore;
using QuantaculaIndicators;
using System.Drawing;
using Candlesticks;
namespace Quantacula
{
    public class MyModel1 : UserModelBase
    {
        //create indicators and other objects here
        public override void Initialize(BarHistory bars)
        {
            lowerBand = new BBLower(bars.Close, 20, 2.0);
            upperBand = new BBUpper(bars.Close, 20, 2.0);
            PlotIndicator(lowerBand, Color.Navy, PlotStyles.Bands);
        }

        //execute the strategy rules here
        public override void Execute(BarHistory bars, int idx)
        {
            //no open positions?
            if (!HasOpenPosition(bars, PositionType.Long))
            {
                //detect bullish engulfing pattern
                if (CandleGeneDecoder.DetectPattern(bars, idx, "Bullish Engulfing", this))
                {
                    //see if we touched lower bband
                    if (bars.Low[idx] <= lowerBand[idx] && bars.Close[idx] > lowerBand[idx])
                    {
                        PlaceTrade(bars, TransactionType.Buy, OrderType.Limit, bars.Close[idx]);
                    }
                }
            }
            else
            {
                //exit when we touch the upper bband
                PlaceTrade(bars, TransactionType.Sell, OrderType.Limit, upperBand[idx]);
            }
        }

        //declare private variables below
        private BBLower lowerBand;
        private BBUpper upperBand;
    }
}
A sample chart in Figure 4 demonstrates how Quantacula Studio detects and annotates candlestick patterns.
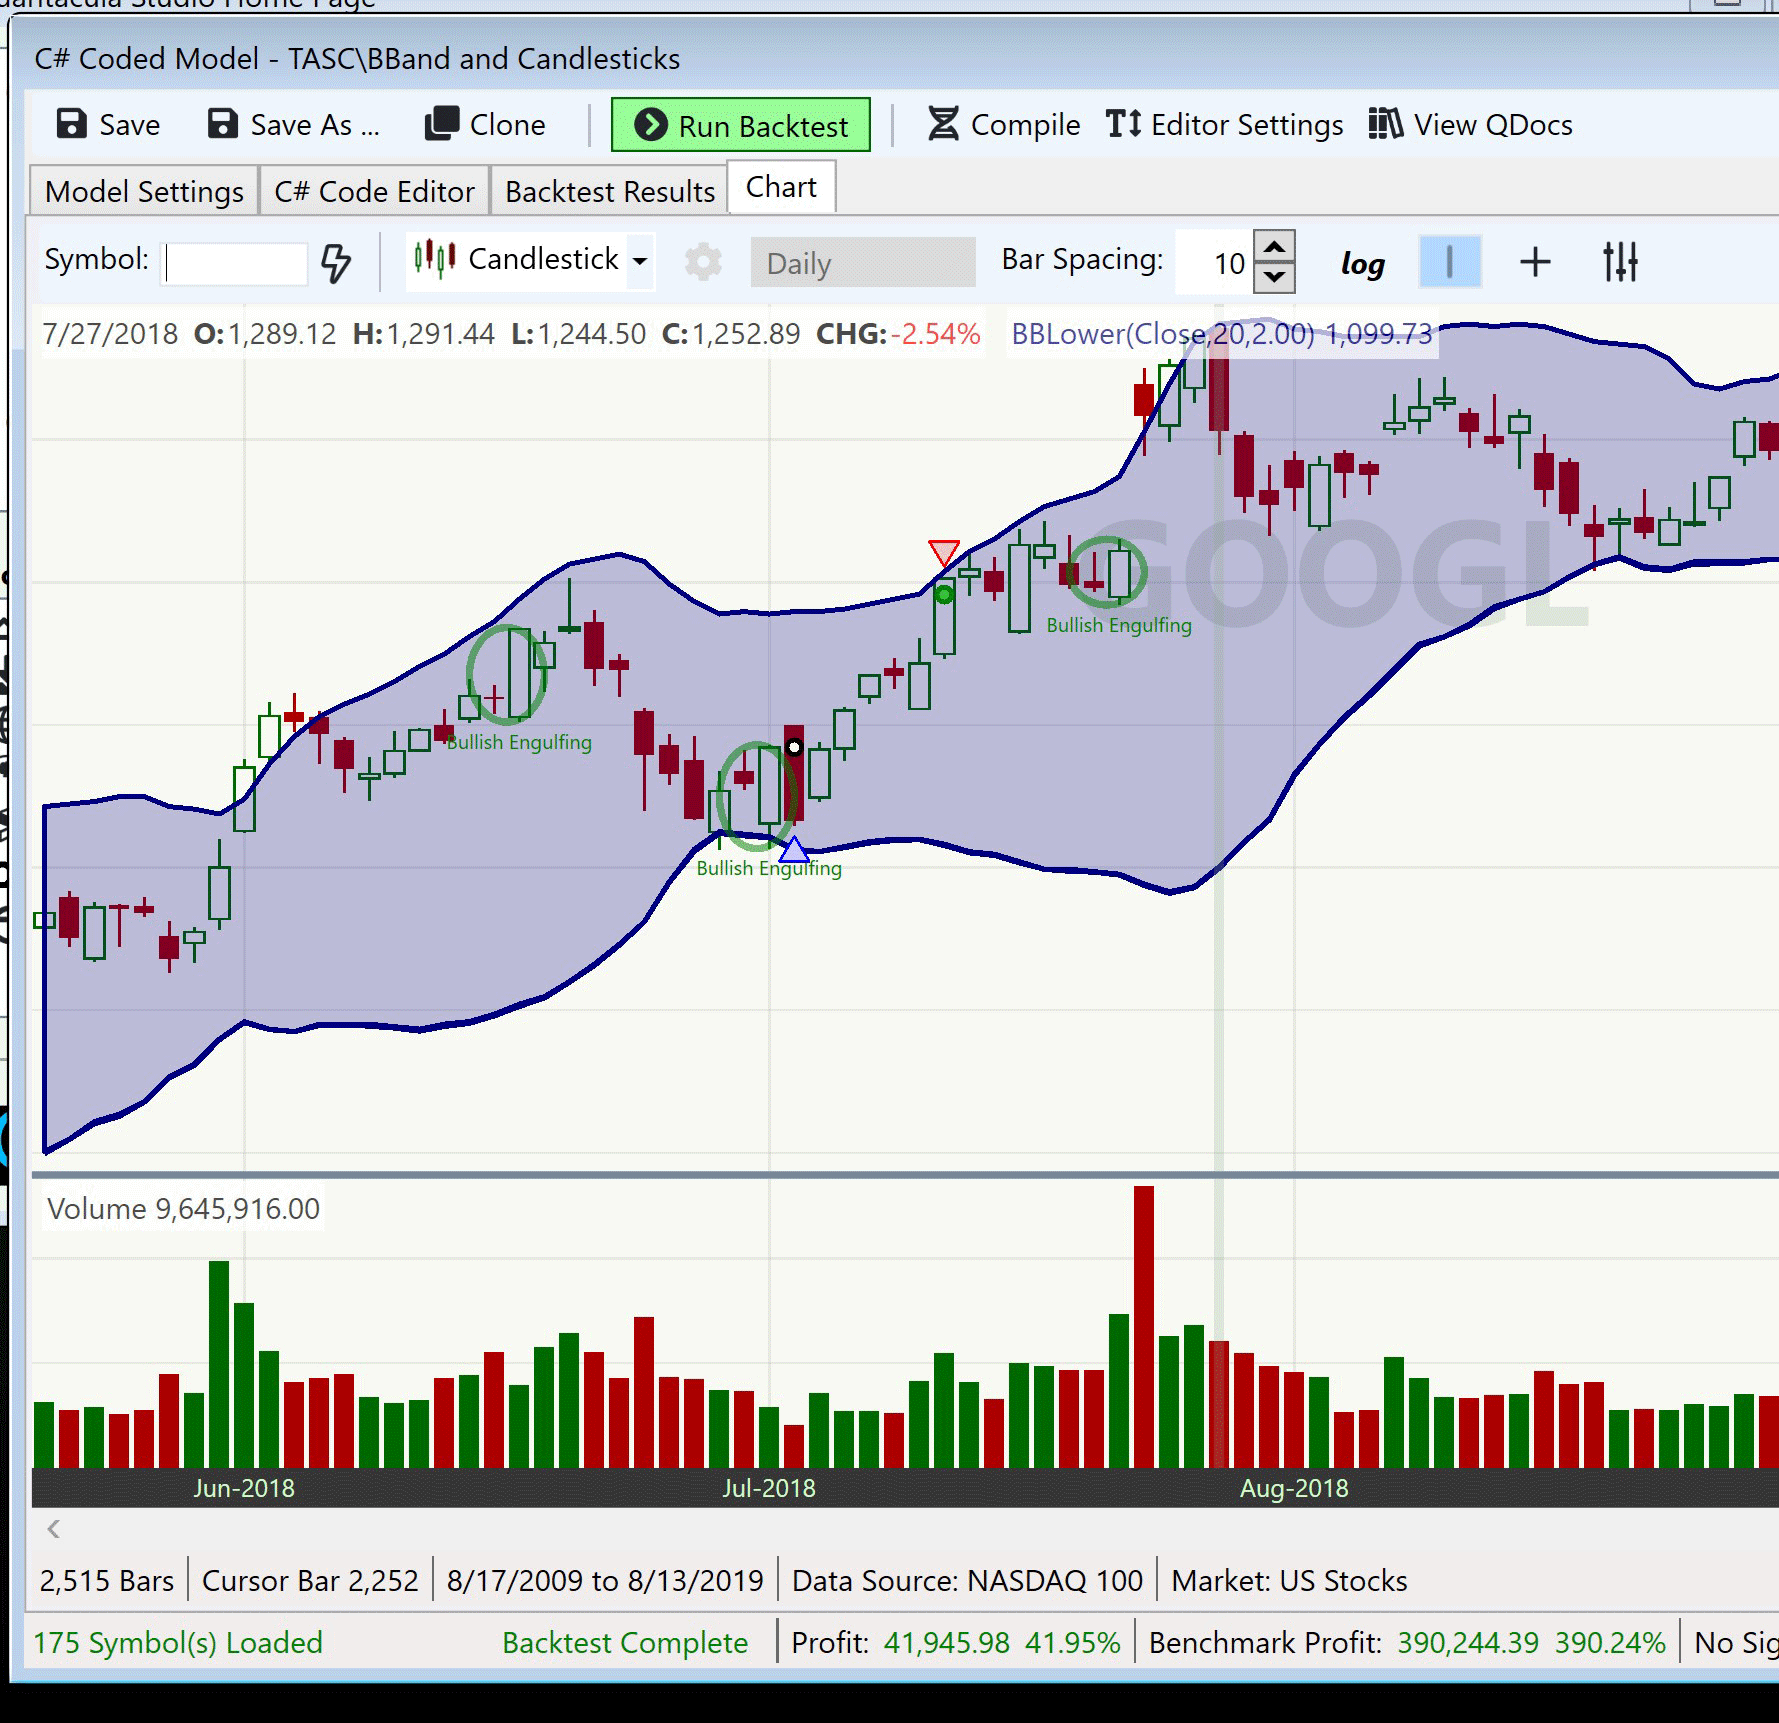
FIGURE 4: QUANTACULA STUDIO. In this sample chart, note how Quantacula Studio automatically detects and annotates the desired candlestick patterns.
—Dion Kurczek, Quantacula LLC
info@quantacula.com
www.quantacula.com
BACK TO LIST

WEALTH-LAB: OCTOBER 2019
The trading strategy described in the article by Pawel Kosinski in this issue, “Combining Bollinger Bands With Candlesticks,” features an approach that combines multiple unrelated techniques to make an entry, that is trading bands based on a sound statistical theory with candlestick pattern recognition. It’s believed that when several signals are in line confirming each other, a strategy has a better chance. An example of the strategy implemented on a chart of Verizon is shown in Figure 5.
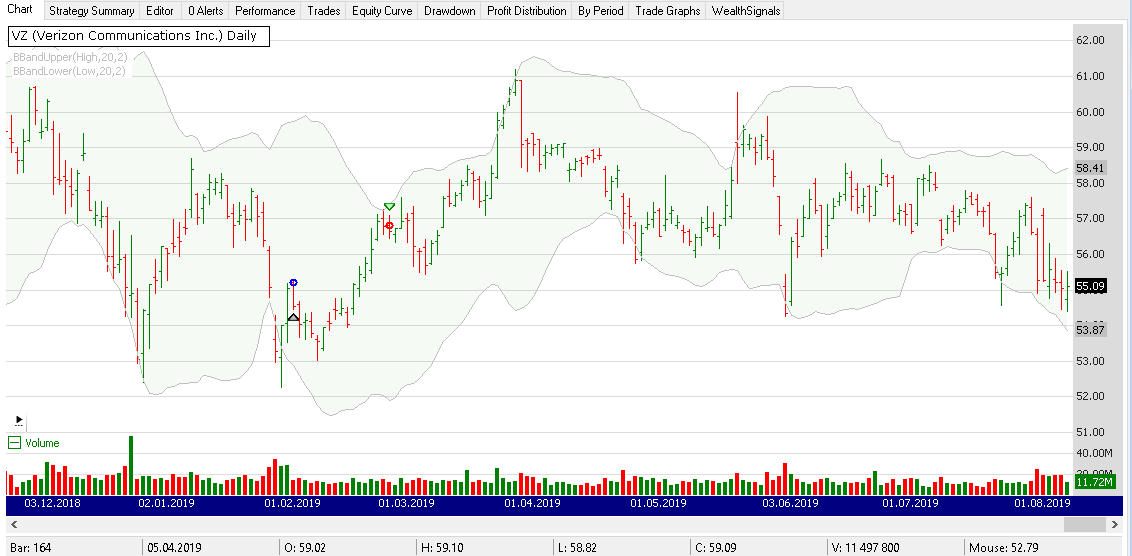
FIGURE 5: WEALTH-LAB. Here is a sample trade on the chart of VZ (Verizon). (Data provided by Yahoo Finance.)
The trading strategy could be assembled in Wealth-Lab in a drag-and-drop fashion from the building blocks known as rules. In Figure 6 we show a way to achieve better flexibility through the “multi-condition group” feature. In essence, it triggers the entry signal when the engulfing and one of the Bollinger Bands conditions occurred not on the same day exactly but close enough to each other, such as within a few days.
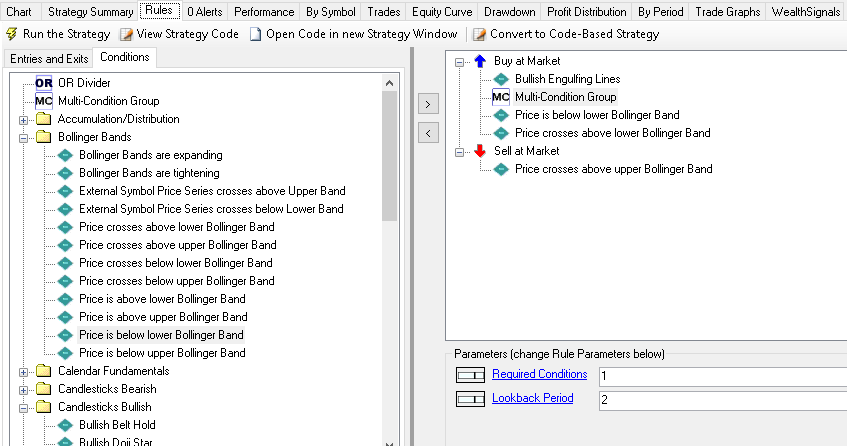
FIGURE 6: WEALTH-LAB. All conditions required to assemble the trading system are in place.
For those who like to have finer control, we’re showing the code here translated from the code given in the article. This code is downloadable within Wealth-Lab (hit ctrl-O and choose download).
using System;
using System.Collections.Generic;
using System.Text;
using System.Drawing;
using WealthLab;
using WealthLab.Indicators;

namespace WealthLab.Strategies
{
	public class TradersTipsOct2019 : WealthScript
	{
		private StrategyParameter paramPeriod;
		private StrategyParameter paramDev;

		public TradersTipsOct2019()
		{
			paramPeriod = CreateParameter("Bands Period", 20, 5, 50, 5);
			paramDev = CreateParameter("Bands Dev.", 2.0, 0.5, 5.0, 0.5);
		}

		protected override void Execute()
		{
			int period = paramPeriod.ValueInt;
			var bbU = BBandUpper.Series( High, period, paramDev.Value);
			var bbL = BBandLower.Series( Low, period, paramDev.Value);
			PlotSeriesFillBand(PricePane, bbU, bbL, Color.Silver, Color.FromArgb(10,Color.Green), LineStyle.Solid, 1);

			for(int bar = GetTradingLoopStartBar(period); bar < Bars.Count; bar++)
			{
				if ( IsLastPositionActive )
				{
					if( High[ bar] > bbU[bar])
						ExitAtMarket( bar+1, LastPosition);
				}
				else
				{
					if(
						//touches the lower band
						( Close[ bar-1] > bbL[bar-1]) && (( Low[ bar-1] < bbL[bar-1]) || ( Low[ bar-2] < bbL[bar-2]))
						//engulfing:
						&& ( Close[ bar-2] < Open[ bar-2]) && ( Close[ bar-1] > Open[ bar-1]) &&
						( Open[ bar-1] < Close[ bar-2]) && ( Close[ bar-1] > Open[ bar-2]) &&
						(( Close[ bar-1] - Open[ bar-1]) > 20 * Bars.SymbolInfo.Tick) &&
						( Close[ bar] > High[ bar-1] )
						)
							BuyAtMarket( bar+1);
				}
			}
		}
	}
}
—Eugene (Gene Geren), Wealth-Lab team
MS123, LLC
www.wealth-lab.com
BACK TO LIST

NEUROSHELL TRADER: OCTOBER 2019
The Bollinger Bands and candlestick trading strategy described by Pawel Kosinski in his article in this issue can be easily implemented in NeuroShell Trader by combining a few of NeuroShell Trader’s 800+ indicators. To recreate the trading strategy, select new trading strategy from the insert menu and enter the following in the appropriate locations of the trading strategy wizard:
BUY LONG CONDITIONS: [All of which must be true]
     A=B(Lag(CrossAbove(Close,BB Low(Close,20,2)),1),1)
     A=B(Lag(Engulfing Pattern (bullish)(Open,High,Low,Close),1),1)
     A>B(Close,Lag(High,1))

LONG TRAILING STOP PRICES:
     TrailPriceATR(Trading Strategy,14,2)

SELL LONG CONDITIONS: [All of which must be true]
     A>B(High,BB Low(Close,20,2))
After entering the system conditions, you can also choose whether the parameters should be optimized. After backtesting the trading strategy, use the detailed analysis button to view the backtest and trade-by-trade statistics for the system. Users of NeuroShell Trader can go to the Stocks & Commodities section of the NeuroShell Trader free technical support website to download a copy of this or any previous Traders’ Tips.
A sample chart is shown in Figure 7.

FIGURE 7: NEUROSHELL TRADER. This NeuroShell Trader chart shows a sample trade for the Bollinger Bands and candlestick trading strategy.
—Marge Sherald, Ward Systems Group, Inc.
301 662-7950, sales@wardsystems.com
www.neuroshell.com
BACK TO LIST

AIQ: OCTOBER 2019
The importable AIQ EDS file based on Pawel Kosinski’s article in this issue, “Combining Bollinger Bands With Candlesticks,” can be obtained on request via email to info@TradersEdgeSystems.com. The code is also shown here.
! COMBINING BOLLINGER BANDS WITH CANDLESTICKS
! Author: Pawel Kosinski, TASC October 2019
! Coded by: Richard Denning, 8/16/19
! www.TradersEdgeSystems.com

! ABBREVIATIONS:
C is [close].
C1 is valresult(C,1).
C2 is valresult(C,2).
L is [low].
L1 is valresult(L,1).
L2 is valresult(L,2).
O is [open].
O1 is valresult(O,1).
O2 is valresult(O,2).
H is [high].
H1 is valresult(H,1).
SPYc is TickerUDF("SPY",C).

! INPUTS:
BBlen is 20.!Default is 20
Mult1 is 2.  !Default is 2.
Mult2 is 2.  !Default is 2
TickSize is 0.01.
BodyMult is 20.

! BOLLINGER BANDS:
Variance is Variance(C,BBlen).
StdDev is Sqrt(Variance).
SMA is simpleavg(C,BBlen).
UBB is SMA + StdDev *  Mult1.
LBB is SMA - StdDev *  Mult2.
LBB1 is valresult(LBB,1).
LBB2 is valresult(LBB,2).

! PRICE FILTER:
PriceVolOK if C > 5 and C < 500 and simpleavg([volume],50) > 1000. !volume in 100s

! TOUCHES LOWER BB:
TouchesLowerBB if (C1 > LBB1 and L1 < LBB1)  or (L2 < LBB2) .

! ENGULFING:
Engulfing if (C2 < O2) and (C1 > O1) and (O1 < C2) and (C1 > O2) and (C1-O1) > BodyMult*TickSize and C > H1 .

! MARKET TIMING:
BullMkt if hasdatafor(450)>=400 and simpleavg(SPYc,100) > simpleavg(SPYc,400).

! TRADING RULES:
Buy if BullMkt and TouchesLowerBB and Engulfing and PriceVolOK.
Sell if H > UBB.

! TRADE RANKING INDICATORS:
ROC100 is (C/valresult(C,100)-1)*100.
ROC400 is (C/valresult(C,400)-1)*100.
ROCcombo is 0.4*ROC100 + 0.6*ROC400.
I coded the simple system described by the author without the stop-loss. I then backtested using the S&P 500 list of stocks using the AIQ Portfolio Manager, which does a trading simulation including capitalization and compounding. Figure 8 shows the statistics, among others, of an annualized return of 10.38% with a maximum drawdown of 22.67% from 8/29/2018 to 8/15/2019 (the end of the test). Figure 9 shows the equity curve compared to the S&P 500 index. We can see that the system is currently in a sharp drawdown that started a year ago.
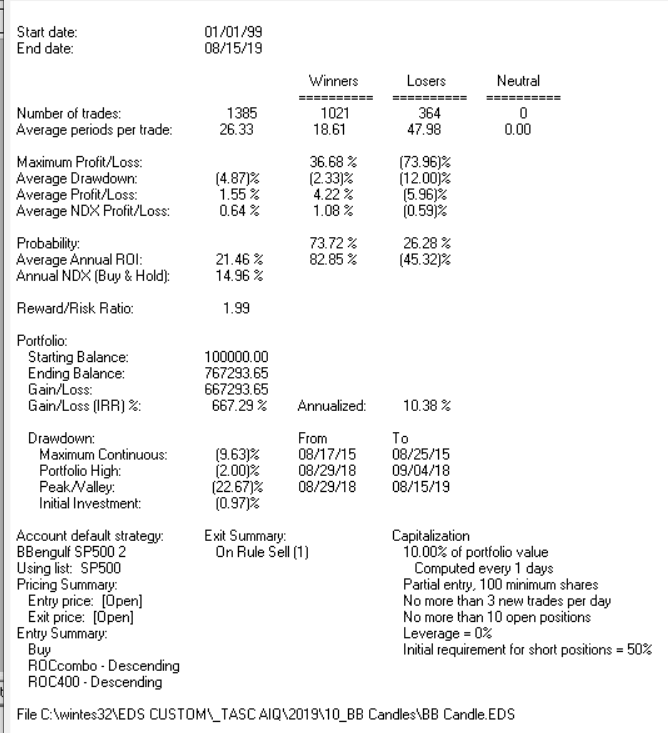
FIGURE 8: AIQ. Here are sample statistics for the simple system without a stop-loss from 1/1/1999 to 8/15/2019.

FIGURE 9: AIQ. Here is a sample equity curve for the simple system without stop-loss from 1/1/1999 to 8/15/2019 trading the S&P 500 list of stocks.
—Richard Denning
info@TradersEdgeSystems.com
for AIQ Systems
BACK TO LIST

TRADERSSTUDIO: OCTOBER 2019
The importable TradersStudio code file baesd on Pawel Kosinski’s article in this issue, “Combining Bollinger Bands With Candlesticks,” can be obtained on request via email to info@TradersEdgeSystems.com. The code is also available on this magazine’s website at Traders.com, and is also shown here. I coded the simple system described by the author without the stop-loss.
' COMBINING BOLLINGER BANDS WITH CANDLESTICKS
' Author: Pawel Kosinski, TASC October 2019
' Coded by: Richard Denning, 8/16/19
' www.TradersEdgeSystems.com

Sub BB_CAN(BBlen,BBmult,BodyMult,TickSize)
Dim PVok
Dim BullMkt
Dim SPYc As BarArray
Dim TLBB As BarArray
Dim ENGULFING As BarArray
TLBB = TOUCH_LBB(BBlen,BBmult)
ENGULFING = ENGULF(BodyMult,TickSize)
SPYc = C Of independent1
PVok = C > 5 And C < 500 And Average(V,50) > 100000
BullMkt = Average(SPYc,100) > Average(SPYc,400)
If BullMkt And TLBB=1 And ENGULFING=1 And PVok Then
    Buy("LE",1,0,Market,Day)
End If
If H > UpperBolBand(C,BBlen,BBmult,0) Then
    ExitLong("LX","",1,0,Market,Day)
End If
End Sub
'------------------------------------------------------
Function TOUCH_LBB(BBlen, BBmult)
Dim LBB As BarArray
LBB = LowerBolBand(C,BBlen,BBmult,0)
If (C[1]>LBB[1] And L[1]<LBB[1])  Or (L[2]<LBB[2]) Then
    TOUCH_LBB = 1
    Else TOUCH_LBB = 0
End If
End Function
'-------------------------------------------------------
unction ENGULF(BodyMult,TickSize)
 If C[2]<O[2] And C[1]>O[1] And O[1]<C[2] And C[1]>O[2] And C[1]-O[1] > BodyMult*TickSize And C>H[1] Then
    ENGULF = 1
    Else ENGULF = 0
 End If
End Function
—Richard Denning
info@TradersEdgeSystems.com
for TradersStudio
BACK TO LIST

NINJATRADER: OCTOBER 2019
We’ve put together a strategy named “BollingerArticle” that is based on Pawel Kosinski’s article in this issue, “Combining Bollinger Bands With Candlesticks,” and it is available for download at the following links for NinjaTrader 8 and for NinjaTrader 7:
Once the file is downloaded, you can import the indicator into NinjaTader 8 from within the control center by selecting Tools → Import → NinjaScript Add-On and then selecting the downloaded file for NinjaTrader 8. To import in NinjaTrader 7, from within the control center window, select the menu File → Utilities → Import NinjaScript and select the downloaded file.
You can review the indicator’s source code in NinjaTrader 8 by selecting the menu New → NinjaScript Editor → Indicators from within the control center window and selecting the BollingerArticle file. You can review the indicator’s source code in NinjaTrader 7 by selecting the menu Tools → Edit NinjaScript → Indicator from within the control center window and selecting the BollingerArticle file.
NinjaScript uses compiled DLLs that run native, not interpreted, to provide you with the highest performance possible.
A sample chart implementing the strategy is shown in Figure 10.

FIGURE 10: NINJATRADER. Here is a example of the BollingerArticle strategy taking a long trade on an SPY daily chart in September 2011.
—Raymond Deux
NinjaTrader, LLC
www.ninjatrader.com
BACK TO LIST

TRADENAVIGATOR: OCTOBER 2019
We’re making available a file for download within the Trade Navigator library to make it easy for users to implement the strategy discussed in Pawel Kosinski’s article in this issue, “Combining Bollinger Bands With Candlesticks.” The filename is “SC201910.” To download it, click on Trade Navigator’s blue telephone button, select download special file, and replace the word “upgrade” with “SC201910” (without the quotes). Then click the start button. When prompted to upgrade, click the yes button. If prompted to close all software, click on the continue button. Your library will now download.
This library contains a strategy and search criteria. Once installed, you can recalculate the search criteria, “SC 1019 Search Criteria” (Figure 11). Click on “file.” In the dropdown, click on “recalculate filter criteria.” You will then see a list of the symbols that match in the symbol grid.
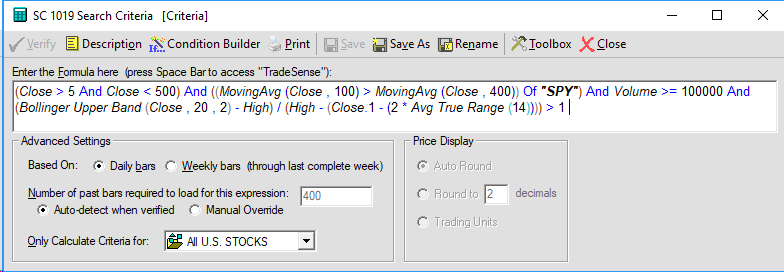
FIGURE 11: TRADE NAVIGATOR. After you download the library, you can recalculate the search criteria.
You will find the new strategy, “Backtesting with Bollinger Bands,” in your Trader’s Toolbox under the strategies tab (Figure 12).
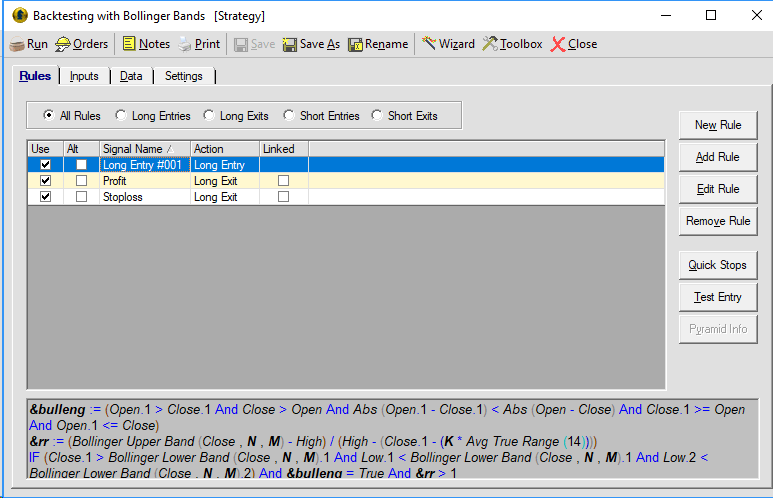
FIGURE 12: TRADE NAVIGATOR. Shown here is an example of setting up a backtest of the strategy.
If you have any difficulty recalculating criteria or working with the strategy, our technical support staff is happy to help by phone or by live chat. Support hours are M–F 6 am–6 pm Mountain Time. Happy trading!
—Genesis Financial Technologies
Tech support 719 884-0245
www.TradeNavigator.com
BACK TO LIST
MICROSOFT EXCEL: OCTOBER 2019
In “Combining Bollinger Bands With Candlesticks” in this issue, author Pawel Kosinski demonstrates the steps a trader might use to construct and backtest a simple trading system. In this case, he uses Bollinger Bands, the bullish engulfing candle pattern, and suggests using an ATR-based stop-loss strategy.
In the article, he summarizes an automated backtest over a large list of stocks at each step toward the development of the system. However, note that the spreadsheet I am providing here can only deal with one symbol at a time.
To keep the spreadsheet file size to a reasonable download size, the backtest computations are limited to 1,000 bars—enough to demonstrate the concepts but not nearly enough to accommodate all of the available bars for some symbols (for example, there are more than 14,000 daily price bars for IBM available from Yahoo Finance).
In Figure 13 I show the basic Bollinger Band touch and engulfing candle system without any stop.

FIGURE 13: EXCEL. Seen here is a lower band touch with a bullish engulfing candle.
The numbers above the column headers in the gray area are how many of each situation can be found in the 1,000 bars currently shown on the chart. There are quite a few lower band touches. There are fewer bullish engulfing candles. And there are even fewer buy signals for this system, which requires both the touch and the candle on the same bar. Many high band touches, when we are long, signal the end of our transaction.
The green background shows the beginning and duration of the long transactions generated by this system with no stop-loss active. The first and the last transactions look to be money makers.
But that second does not look so good. It waits a long time for a high band touch to trigger an exit.
Figure 14 is a small summary of the transactions shown in Figure 13. This work area can be found by scrolling to the right of the price chart.

FIGURE 14: EXCEL. Shown here is a summary of the transactions shown in Figure 13.
Figure 15 is the same set of transactions with the ATR stop-loss active. Two of the transactions have had their durations dramatically reduced. Figure 16 tells the story.

FIGURE 15: EXCEL. The same transactions are shown with the “use stop-loss” box checked.
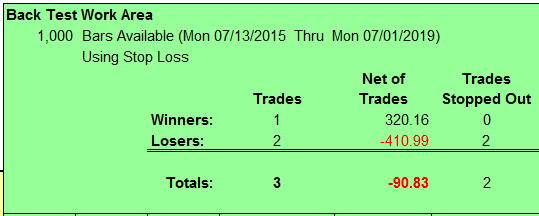
FIGURE 16: EXCEL. With the addition of the stop-loss employed, there is now one less winner and one more loser.
With the activation of the stop-loss, one transaction goes from winner to loser. But the net loss is reduced by two-thirds as we cut the former big loser down to a somewhat more manageable size.
Values in the user controls area can be adjusted to explore the behavior of this system.
To explore older price bars, the price chart window can be shifted into the past by way of what you specify in the input data offset field. I was stepping it up by 1,000 each time.
For the more adept Excel users, the number of computational rows may be extended to use more of the price bars from the InputPriceData tab in the backtest calculations.
The spreadsheet file for this Traders’ Tip can be downloaded here. To successfully download it, follow these steps:
- Right-click on the Excel file link, then
- Select “save as” (or “save target as”) to place a copy of the spreadsheet file on your hard drive.
—Ron McAllister
Excel and VBA programmer
rpmac_xltt@sprynet.com
BACK TO LIST
Originally published in the October 2019 issue of
Technical Analysis of STOCKS & COMMODITIES magazine.
All rights reserved. © Copyright 2019, Technical Analysis, Inc.


