TRADERS’ TIPS
November 2019

For this month’s Traders’ Tips, the focus is Vitali Apirine’s article in this issue, “The Stochastic MACD Oscillator.” Here, we present the November 2019 Traders’ Tips code with possible implementations in various software.
You can right-click on any chart to open it in a new tab or window and view it at it’s originally supplied size, often much larger than the version printed in the magazine.
The Traders’ Tips section is provided to help the reader implement a selected technique from an article in this issue or another recent issue. The entries here are contributed by software developers or programmers for software that is capable of customization.

TRADESTATION: NOVEMBER 2019
In “The Stochastic MACD Oscillator” in this issue, author Vitali Apirine introduces a new indicator created by combining the stochastic oscillator and the MACD. He describes the new indicator as a momentum oscillator and explains that it allows the trader to define overbought and oversold levels similar to the classic stochastic but based on the MACD.
We are providing TradeStation EasyLanguage code for an indicator based on Apirine’s concepts. The code for the indicator is shown below and can be downloaded by visiting our TradeStation and EasyLanguage support forum. To download the EasyLanguage code, go to: https://community.tradestation.com/Discussions/Topic.aspx?Topic_ID=156727. The filename is “TASC_NOV2019.ZIP.”
A sample chart is shown in Figure 1.

FIGURE 1: TRADESTATION. Shown here is a daily chart of the SPY with the stochastic MACD indicator applied.
Indicator: Stochastic MACD Oscillator

// TASC Nov 2019
// Stochastic MACD
// Vitali Apirine

inputs:
	Periods( 45 ),
	FastavgLength( 12 ),
	SlowAvgLength( 26 ),
	STMACDLength( 9 ),
	OverBought( 10 ),
	OverSold( -10 ) ;

variables:
	HHigh( 0 ),
	LLow( 0 ),
	FastAvgValue( 0 ),
	SlowAvgValue( 0 ),
	FastStoch( 0 ),
	SlowStoch( 0 ),
	STMACD( 0 ),
	STMACDAvg( 0 ) ;

HHigh = Highest( High, Periods ) ;
LLow = Lowest( Low, Periods ) ;

FastAvgValue = XAverage( Close, FastavgLength ) ;
SlowAvgValue = XAverage( Close, SlowAvgLength ) ;

if HHigh <> LLow then
begin
	FastStoch = ( FastAvgValue - LLow ) /
		( HHigh - LLow ) ;
	SlowStoch = ( SlowAvgValue - LLow ) /
		( HHigh - LLow ) ;
end ;

STMACD = ( FastStoch - SlowStoch ) * 100 ;
STMACDAvg = XAverage( STMACD, STMACDLength ) ;

Plot1( STMACD, "STMACD" ) ;
Plot2( STMACDAvg, "STMACD Avg" ) ;
Plot3( 0, "Zero Line" ) ;
Plot4( OverBought, "OverBought" ) ;
Plot5( Oversold, "OverSold" ) ;
This article is for informational purposes. No type of trading or investment recommendation, advice, or strategy is being made, given, or in any manner provided by TradeStation Securities or its affiliates.
—Doug McCrary
TradeStation Securities, Inc.
www.TradeStation.com
BACK TO LIST

TC2000: NOVEMBER 2019
The stochastic MACD oscillator described in Vitali Apirine’s article in this issue, “The Stochastic MACD Oscillator,” can be easily applied in TC2000 version 19 using a custom PCF indicator and the following formula:
100 * MACD12.26 / (MAXH45 - MINL45)
Apirine’s formula calls for three parameters: a short moving average of 12 periods, a long moving average of 26 periods, and a lookback period of 45 periods. If you would like to use different settings, you can edit the formula above accordingly.
Once you add the stochastic MACD to your chart, you can add a nine-period exponential moving average for the signal line. Click on the indicator label at the top of the pane, select “add plot here,” and then search for moving average–exponential.
The resulting plots look like the ones shown in Figure 2.
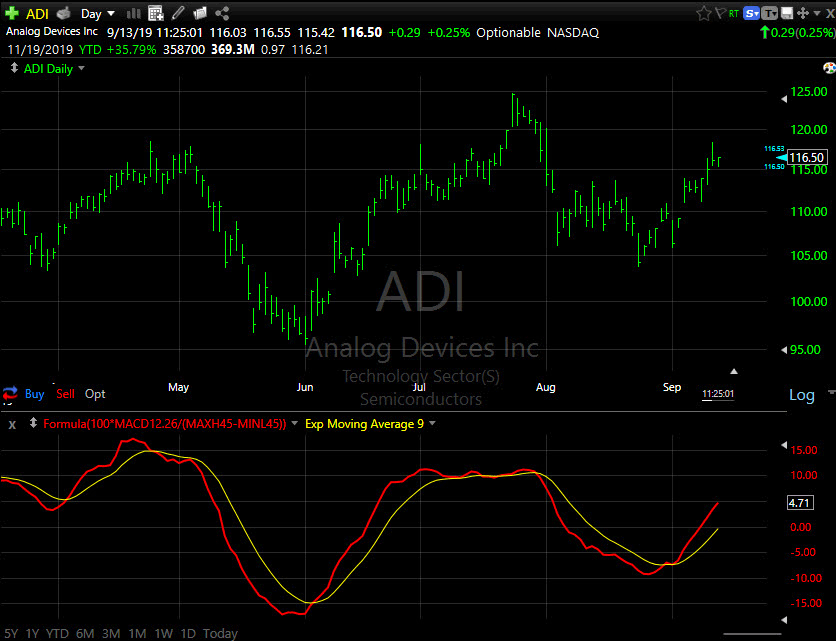
FIGURE 2: TC2000. An example of the stochastic MACD is plotted using a nine-period exponential moving average for the signal line.
For help creating custom formulas in TC2000, visit help.tc2000.com.
—Patrick Argo
Worden Brothers, Inc.
www.TC2000.com
BACK TO LIST

THINKORSWIM: NOVEMBER 2019
We have put together a study for thinkorswim based on the article by Vitali Apirine in this issue, “The Stochastic MACD Oscillator,” in which he presents the stochastic MACD, which combines the stochastic oscillator and MACD in order to define oversold/overbought MACD levels.
We built the study using our proprietary thinkscript language. To ease the loading process, simply click on https://tos.mx/68VmEGt or enter the URL into thinkorswim from the menu located under setup → open shared item within thinkorswim. Then choose view thinkscript study and name it “STMACD” to easily locate later. This can then be added to your chart from the edit study and strategies menu on the chart.
Figure 3 displays two MovAvgExponential studies, PriceChannel and MACDTwoLines to mimic the configuration from the article’s Figure 2 as well as the STMACD study referenced here. For more details on how to utilize the studies, please refer to Apirine’s article.

FIGURE 3: THINKORSWIM. Two MovAvgExponential studies are shown, PriceChannel and MACDTwoLines.
— thinkorswim
A division of TD Ameritrade, Inc.
www.thinkorswim.com
BACK TO LIST

eSIGNAL: NOVEMBER 2019
For this month’s Traders’ Tip, we’re providing the study “stochasticMACDoscillator.efs” based on the article in this issue by Vitali Apirine, “The Stochastic MACD Oscillator.” This study combines the MACD and stochastic indicators.
The study contains formula parameters that may be configured through the edit chart window (right-click on the chart and select “edit chart”). A sample chart is shown in Figure 4.

FIGURE 4: eSIGNAL. Here is an example of the study plotted on a daily chart of $SPX.
To discuss this study or download a complete copy of the formula code, please visit the EFS library discussion board forum under the forums link from the support menu at esignal.com or visit our EFS KnowledgeBase at esignal.com/support/kb/efs/. The eSignal formula script (EFS) is also available for copying & pasting here:
/**********************************
Provided By:
Copyright 2019 Intercontinental Exchange, Inc. All Rights Reserved.
eSignal is a service mark and/or a registered service mark of Intercontinental Exchange, Inc.
in the United States and/or other countries. This sample eSignal Formula Script (EFS)
is for educational purposes only.
Intercontinental Exchange, Inc. reserves the right to modify and overwrite this EFS file with each new release.

Description:
   The Stochastic MACD Oscillator
   by Vitali Apirine


Version:            1.00  09/16/2019

Formula Parameters:                     Default:
Periods                                 45

Notes:
The related article is copyrighted material. If you are not a subscriber
of Stocks & Commodities, please visit www.traders.com.

**********************************/
var fpArray = new Array();
var bInit = false;

function preMain() {
    setStudyTitle("Stochastic MACD Oscillator");
    setCursorLabelName("STMACD", 0);
    setCursorLabelName("Signal line", 1);
    setPriceStudy(false);
    setDefaultBarFgColor(Color.RGB(0x00,0x94,0xFF), 0);
    setDefaultBarFgColor(Color.RGB(0xFE,0x69,0x00), 1);

    addBand(0, PS_DASH, 1, Color.grey);
    addBand(10, PS_SOLID, 1, Color.blue);
    addBand(-10, PS_SOLID, 1, Color.red);

    var x=0;
    fpArray[x] = new FunctionParameter("Periods", FunctionParameter.NUMBER);
	with(fpArray[x++]){
        setLowerLimit(1);
        setDefault(45);
    }
}

var bVersion = null;
var HP = null;
var LP = null;

function main(Periods) {
    if (bVersion == null) bVersion = verify();
    if (bVersion == false) return;

    var nState = getBarState();

    if (nState == BARSTATE_ALLBARS) {
        if (Periods == null) Periods = 45;
    }

    if (getCurrentBarCount() <= 26 || getCurrentBarCount() < Periods ) return;

    if ( bInit == false ) {
        HP = hhv(Periods,high());
        LP = llv(Periods,low());
        xSTMACD = efsInternal("Calc_STMACD", HP, LP);
        bInit = true;
    }

    return [xSTMACD.getValue(0), ema(9,xSTMACD)];
}

var ret = null;
function Calc_STMACD(HP, LP)
{
    ret = (Calc_ST(HP, LP, 12) - Calc_ST(HP, LP, 26)) * 100;
   return ret;
}

var ST = null;
var emaN = null;
function Calc_ST(HP, LP, emaN)
{
    if ((HP.getValue(0) - LP.getValue(0)) == 0)  return;
    var MAemaN = ema(emaN, close(), 0);
    ST = (MAemaN - LP.getValue(0)) / (HP.getValue(0) - LP.getValue(0));
    return ST;
}

function verify(){
    var b = false;
    if (getBuildNumber() < 779){

        drawTextAbsolute(5, 35, "This study requires version 10.6 or later.",
            Color.white, Color.blue, Text.RELATIVETOBOTTOM|Text.RELATIVETOLEFT|Text.BOLD|Text.LEFT,
            null, 13, "error");
        drawTextAbsolute(5, 20, "Click HERE to upgrade.@URL=https://www.esignal.com/download/default.asp",
            Color.white, Color.blue, Text.RELATIVETOBOTTOM|Text.RELATIVETOLEFT|Text.BOLD|Text.LEFT,
            null, 13, "upgrade");
        return b;
    }
    else
        b = true;

    return b;
}
—Eric Lippert
eSignal, an Interactive Data company
800 779-6555, www.eSignal.com
BACK TO LIST

WEALTH-LAB: NOVEMBER 2019
In “The Stochastic MACD Oscillator” in this issue, author Vitali Apirine presents a way to combine the stochastic oscillator and MACD, letting you define oversold/overbought MACD levels. The STMACD reflects the convergence and divergence of two moving averages relative to the high–low range over a set number of periods.
We illustrate the application of STMACD with a short-only system that attempts to profit on divergence reversals. When price moves higher but the STMACD does not reflect that move, creating a lower top, the method looks to fade the move, as illustrated in Figure 5, and exits after a specified number of bars.

FIGURE 5: WEALTH-LAB. By viewing example trades such as on this chart of QQQ, you can see when the system has a winning streak. Data is from Yahoo Finance.
Granted, it’s not the kind of strategy you’d want to employ in the current prolonged bull market without any safety net. Motivated traders should protect it with a stop-loss and probably some trade filter.
After updating our TASCIndicators library to v2019.10 or later, the indicator appears under the TASC Magazine Indicators group. You can plot it on a chart or use it as an entry or exit condition in a rule-based strategy without having to program a single line of code. As usual, you can get the companion strategy’s C# code by downloading it right from Wealth-Lab’s open strategy dialog.
WealthScript Code (C#)

Courtesy Robert Sucher

using System;
using System.Collections.Generic;
using System.Text;
using System.Drawing;
using WealthLab;
using WealthLab.Indicators;
using TASCIndicators;

namespace WealthLab.Strategies
{
	public class TASCNov2019_Divergences : WealthScript
	{
		private StrategyParameter peakPctPrice;
		private StrategyParameter peakPctIndicator;
		private StrategyParameter exitBars;
		public TASCNov2019_Divergences()
		{
			peakPctPrice = CreateParameter("Price Peak%", 4, 2, 10, 1);
			peakPctIndicator = CreateParameter("Indctr Peak%", 20, 5, 30, 1);
			exitBars = CreateParameter("Exit bars", 20, 1, 30, 1);
			}

		private const int proxBars = 6;
		private int _barLastChecked = 0;
		protected override void Execute()
		{
			int pkPctPrice = peakPctPrice.ValueInt;
			int pkPctIndicator = peakPctIndicator.ValueInt;
			int barsToHold = exitBars.ValueInt;
			int lastDetectedBar = 0;
			_barLastChecked = 0;

			var s = STMACD.Series(Bars,45,12,26);
			var es = EMAModern.Series(s,9);

			var sp = CreatePane( 30,true,true);
			PlotSeries( sp, s, Color.Black, WealthLab.LineStyle.Solid, 1);
			PlotSeries( sp, es, Color.Red, WealthLab.LineStyle.Solid, 1);

			for(int bar = GetTradingLoopStartBar( 26); bar < Bars.Count; bar++)
			{
				if (IsLastPositionActive) {
					Position p = LastPosition;
					if (bar + 1 - p.EntryBar >= barsToHold)
						CoverAtMarket( bar + 1, p);
				}
				else if (PeakDivergence(bar, Close, pkPctPrice, s, pkPctIndicator, sp))
					if( ShortAtMarket( bar+1 ) != null )
						LastPosition.Priority = Close[bar];
			}
		}

		public bool PeakDivergence(int bar, DataSeries price, double pctRev1, DataSeries ind, double pctRev2, ChartPane indPane)
		{
			bool divergeDetected = false;
			PeakTroughMode mode = PeakTroughMode.Percent;
			int pb1 = (int)PeakBar.Value(bar, price, pctRev1, mode);
			if (pb1 > _barLastChecked)	{
				_barLastChecked = pb1;
				int pb2 = (int)PeakBar.Value(pb1, price, pctRev1, mode);
				if (pb2 > -1) {
					int testBar = Math.Min(bar, pb1 + proxBars);
					int ibar1 = (int)PeakBar.Value( testBar, ind, pctRev2, mode);
					// test peak proximity
					if (Math.Abs(pb1 - ibar1) > proxBars) ibar1 = pb1;
					int span = Math.Min(pb1 - pb2 - 1, proxBars);
					testBar = Math.Min(ibar1 - 1, pb2 + span);
					int ibar2 = (int)PeakBar.Value( testBar, ind, pctRev2, mode);
					if (ibar2 < 0) ibar2 = 0;
					if (Math.Abs(pb2 - ibar2) > proxBars) ibar2 = pb2;
					divergeDetected = Math.Sign(price[pb1] - price[pb2]) != Math.Sign(ind[ibar1] - ind[ibar2]);
					if (divergeDetected) {
						// Highlight bar detected
						SetPaneBackgroundColor( PricePane, bar, Color.FromArgb(40, Color.Blue));
						DrawLine( PricePane, pb1, price[pb1] * 1.01, pb2, price[pb2] * 1.01, Color.Blue, LineStyle.Solid, 2);
						DrawLine( indPane, ibar1, ind[ibar1] * 1.01, ibar2, ind[ibar2] * 1.01, Color.Red, LineStyle.Solid, 2);
						if (Math.Sign(price[pb1] - price[pb2]) == 1)
							for (int b = pb2; b <= pb1; b++)
								SetPaneBackgroundColor( indPane, b, Color.FromArgb(40, Color.Red));
					}
				}
			}
			return divergeDetected;
			}
	}
}
—Gene (Eugene) Geren, Wealth-Lab team
MS123, LLC
www.wealth-lab.com
BACK TO LIST

QUANTACULA STUDIO: NOVEMBER 2019
We added the STMACD indicator to Quantacula Studio and to our web-based backtesting on Quantacula.com, based on the concepts in Vitali Apirine’s article in this issue. In Quantacula Studio, you’ll find it under the TACSExtensions folder in the indicators page.
We mocked up a simple trading model that buys when the STMACD moves above its signal line. For a signal line, we experimented with several different smoothing indicators, and we settled on John Ehlers’ instantaneous trendline. The sell occurs when the STMACD moves below this signal line. All of this is quite simple to do using our drag-and-drop model builder.
In the chart of TQQQ in Figure 6, you can see two recent, consecutive, profitable trades using this simple trading model.
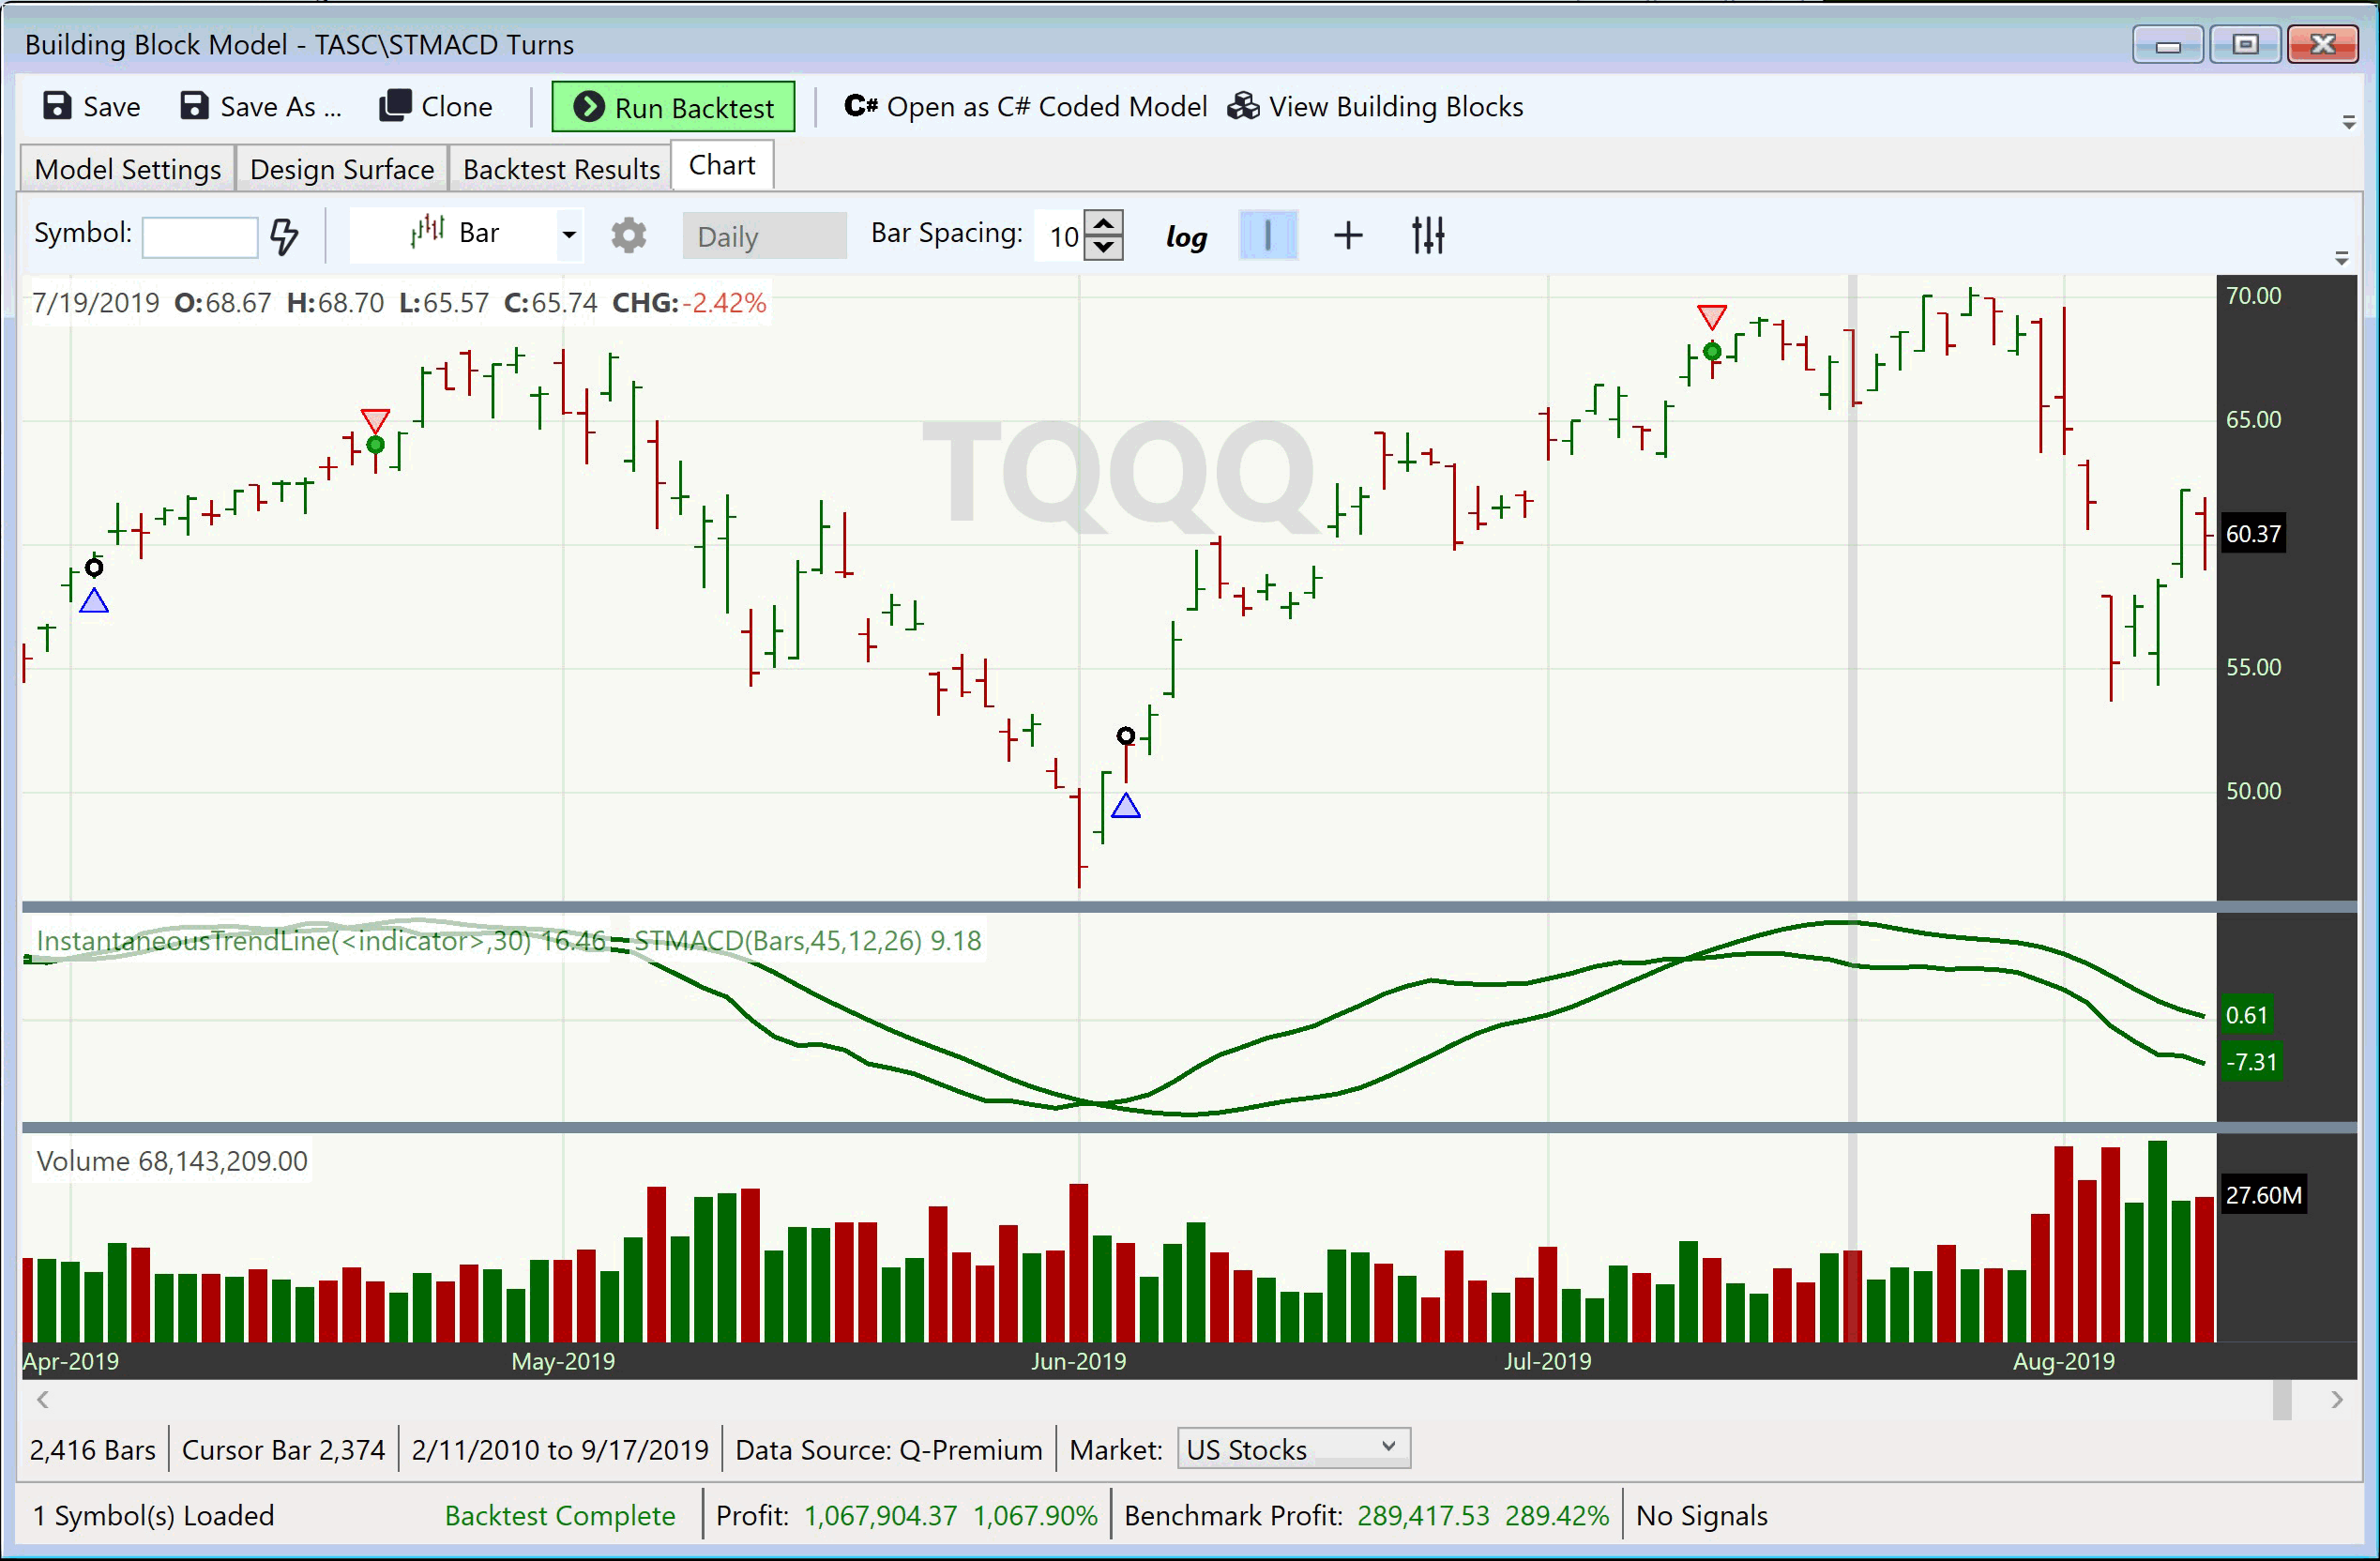
FIGURE 6: QUANTACULA. In this chart of TQQQ, you can see two recent, consecutive, profitable trades using this simple trading model.
In Figure 7 you can see how we implemented the trading model using Quantacula Studio’s Building Blocks.
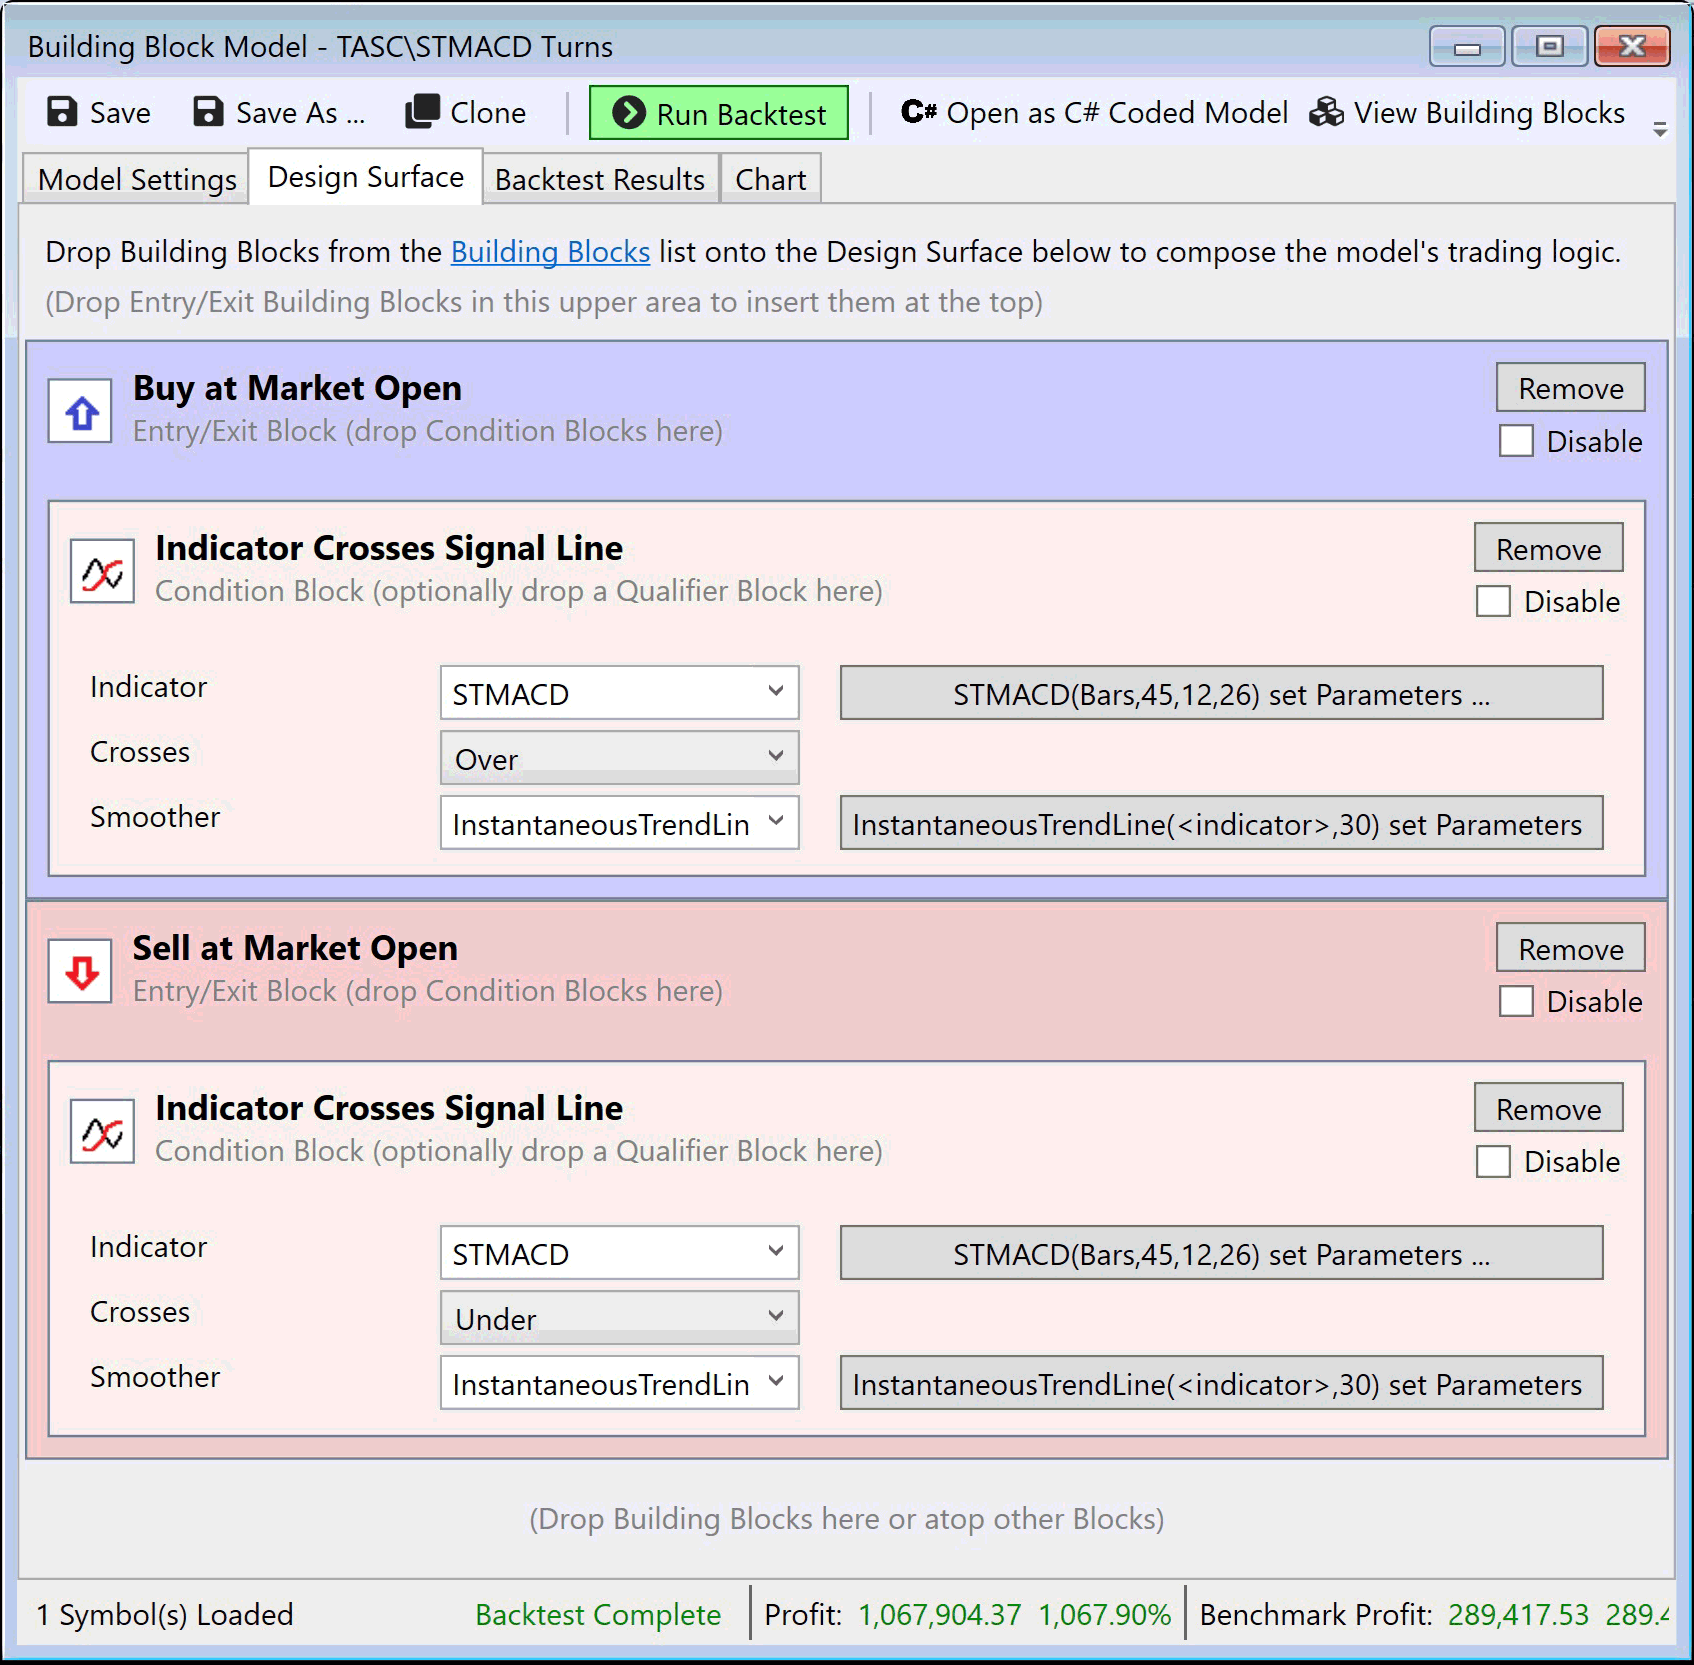
FIGURE 7: QUANTACULA. Here is how we implemented the trading model using Quantacula Studio’s Building Blocks.
—Dion Kurczek, Quantacula LLC
info@quantacula.com
www.quantacula.com
BACK TO LIST

NEUROSHELL TRADER: NOVEMBER 2019
The stochastic MACD oscillator described by Vitali Apirine in his article in this issue can be easily implemented in NeuroShell Trader by combining a few of NeuroShell Trader’s 800+ indicators. To implement the STMACD and its signal line, select new indicator from the insert menu and use the indicator wizard to set up the following indicators:
StochasticEMA12:   	Stoch%K( High, Low, ExpAvg(Close,12), 45)
StochasticEMA26:   	Stoch%K( High, Low, ExpAvg(Close,26), 45)
STMACD:	Mul2( Sub( StochasticEMA12,  StochasticEMA26), 100)
Signal Line:	ExpAvg( STMACD, 9)
Users of NeuroShell Trader can go to the Stocks & Commodities section of the NeuroShell Trader free technical support website to download a copy of this or any previous Traders’ Tips.
A sample chart is shown in Figure 8.

FIGURE 8: NEUROSHELL TRADER. This NeuroShell Trader chart displays a bullish divergence of SPY lower low, an STMACD double bottom, and an MACD lower low.
—Marge Sherald, Ward Systems Group, Inc.
301 662-7950, sales@wardsystems.com
www.neuroshell.com
BACK TO LIST

AIQ: NOVEMBER 2019
The importable AIQ EDS file based on Vitali Apirine’s article in this issue, “The Stochastic MACD Oscillator,” can be obtained on request via email to info@TradersEdgeSystems.com.
I coded the indicator described by Apirine in his article and also created two example systems to test the indicator. I then backtested these two systems using the Nasdaq 100 list of stocks and the EDS backtester.
Figure 9, for the system using the “buy” rule, shows the statistics, among others, of an average annual ROI of 13.2% with an average profit per trade of 0.62% from 9/18/2007 to 9/16/2019.

FIGURE 9: AIQ. Shown are the statistics for the “buy” rule system without a stop-loss from 9/18/2007 to 9/16/2019 using the Nasdaq 100 list of stocks.
Figure 10, for the system using the “BuyAlt” rule, shows an average annual ROI of 19.1% with an average profit per trade of 0.85%.

FIGURE 10: AIQ. Shown are the statistics for the “BuyAlt” rule system without a stop-loss from 9/18/2007 to 9/16/2019 using the Nasdaq 100 list of stocks.
The “buy” system uses just indicator crossovers to enter long. The “BuyAlt” uses the crossover together with buying only when both the stocks and Nasdaq index are in an uptrend and the StochMACD is below -8.
—Richard Denning
info@TradersEdgeSystems.com
for AIQ Systems
BACK TO LIST

TRADERSSTUDIO: NOVEMBER 2019
An importable TradersStudio code file based on Vitali Apirine’s article in this issue, “The Stochastic MACD Oscillator,” can be obtained on request via email to info@TradersEdgeSystems.com.
The code is also shown here:
'The Stochastic MACD Oscillator
'Author: Vitali Apirine, TASC Nov 2019
'Coded by: Richard Denning, 9/16/2019
'www.TradersEdgeSystems.com

Function STMACD(Periods,emaLen1,emaLen2)
'INPUTS:
'Periods =  45
'emaLen1 =  12
'emaLen2 =  26
'sigLen =  9

Dim HP As BarArray
Dim LP As BarArray
Dim EMA1 As BarArray
Dim EMA2 As BarArray
Dim Stoch1 As BarArray
Dim Stoch2 As BarArray

'INDICATOR CODE:
HP =  Highest(H,Periods)
LP =  Lowest(L,Periods)
EMA1 =  XAverage(C,emaLen1)
EMA2 =  XAverage(C,emaLen2)
Stoch1 =  (EMA1-LP)/(HP-LP)
Stoch2 =  (EMA2-LP)/(HP-LP)
STMACD =  (Stoch1-Stoch2)*100
End function
'---------------------------------------------
'INDICATOR PLOT FOR STMACD AND SIGNAL LINE
Sub STMACD_IND(Periods,emaLen1,emaLen2,sigLen)
Dim theSTMACD As BarArray
Dim sigSTMACD As BarArray
theSTMACD = STMACD(Periods,emaLen1,emaLen2)
sigSTMACD = XAverage(theSTMACD,sigLen)
plot1(theSTMACD)
plot2(sigSTMACD)
plot3(10)
plot4(-10)
End Sub
'-----------------------------------------------
Figure 11 shows an example of the STMACD with signal line on a chart of Apple Inc. (AAPL).

FIGURE 11: TRADERSSTUDIO. The STMACD with signal line is shown on a chart of Apple, Inc. (AAPL).
—Richard Denning
info@TradersEdgeSystems.com
for TradersStudio
BACK TO LIST

NINJATRADER: NOVEMBER 2019
The STMACD indicator, as discussed in the article in this issue by Vitali Apirine titled “The Stochastic MACD Oscillator,” is available for download at the following links for NinjaTrader 8 and for NinjaTrader 7:
Once the file is downloaded, you can import the indicator into NinjaTader 8 from within the control center by selecting Tools → Import → NinjaScript Add-On and then selecting the downloaded file for NinjaTrader 8. To import into NinjaTrader 7, from within the control center window, select the menu File → Utilities → Import NinjaScript and select the downloaded file.
You can review the indicator’s source code in NinjaTrader 8 by selecting the menu New → NinjaScript Editor → Indicators from within the control center window and selecting the STMACD file. You can review the indicator’s source code in NinjaTrader 7 by selecting the menu Tools → Edit NinjaScript → Indicator from within the control center window and selecting the STMACD file.
NinjaScript uses compiled DLLs that run native, not interpreted, which provides you with the highest performance possible.
A sample chart demonstrating the indicator is shown in Figure 12.

FIGURE 12: NINJATRADER. The STMACD indicator is displayed on the S&P 500 index between September 2018 and March 2019 using default settings.
—Raymond Deux & Jim Dooms
NinjaTrader, LLC
www.ninjatrader.com
BACK TO LIST

TRADE NAVIGATOR: NOVEMBER 2019
We’ve created a file to make it easy to download a library in Trade Navigator based on the article in this issue “The Stochastic MACD Oscillator” by Vitali Apirine.
The filename is SC201911. To download it, click on Trade Navigator’s blue telephone button, select download special file, and replace the word “upgrade” with “SC201911” (without the quotes). Then click the start button. When prompted to upgrade, click the yes button. If prompted to close all software, click on the continue button. Your library will now download.
This library contains two indicators named STMACD and STMACD EMA, plus a template named S&C The Stochastic MACD Oscillator.
You can insert these indicators onto a chart by opening the charting dropdown menu, selecting the add to chart command, then, on the indicators tab, find your named indicator, select it, and click on the add button. Repeat this procedure for additional indicators as well if you wish.
This library contains a template named S&C The Stochastic MACD Oscillator. This template can be inserted onto your chart by opening the charting dropdown menu, then selecting the templates command, then selecting the S&C The Stochastic MACD Oscillator template.
Sample charts demonstrating the indicators are shown in Figures 13 and 14.
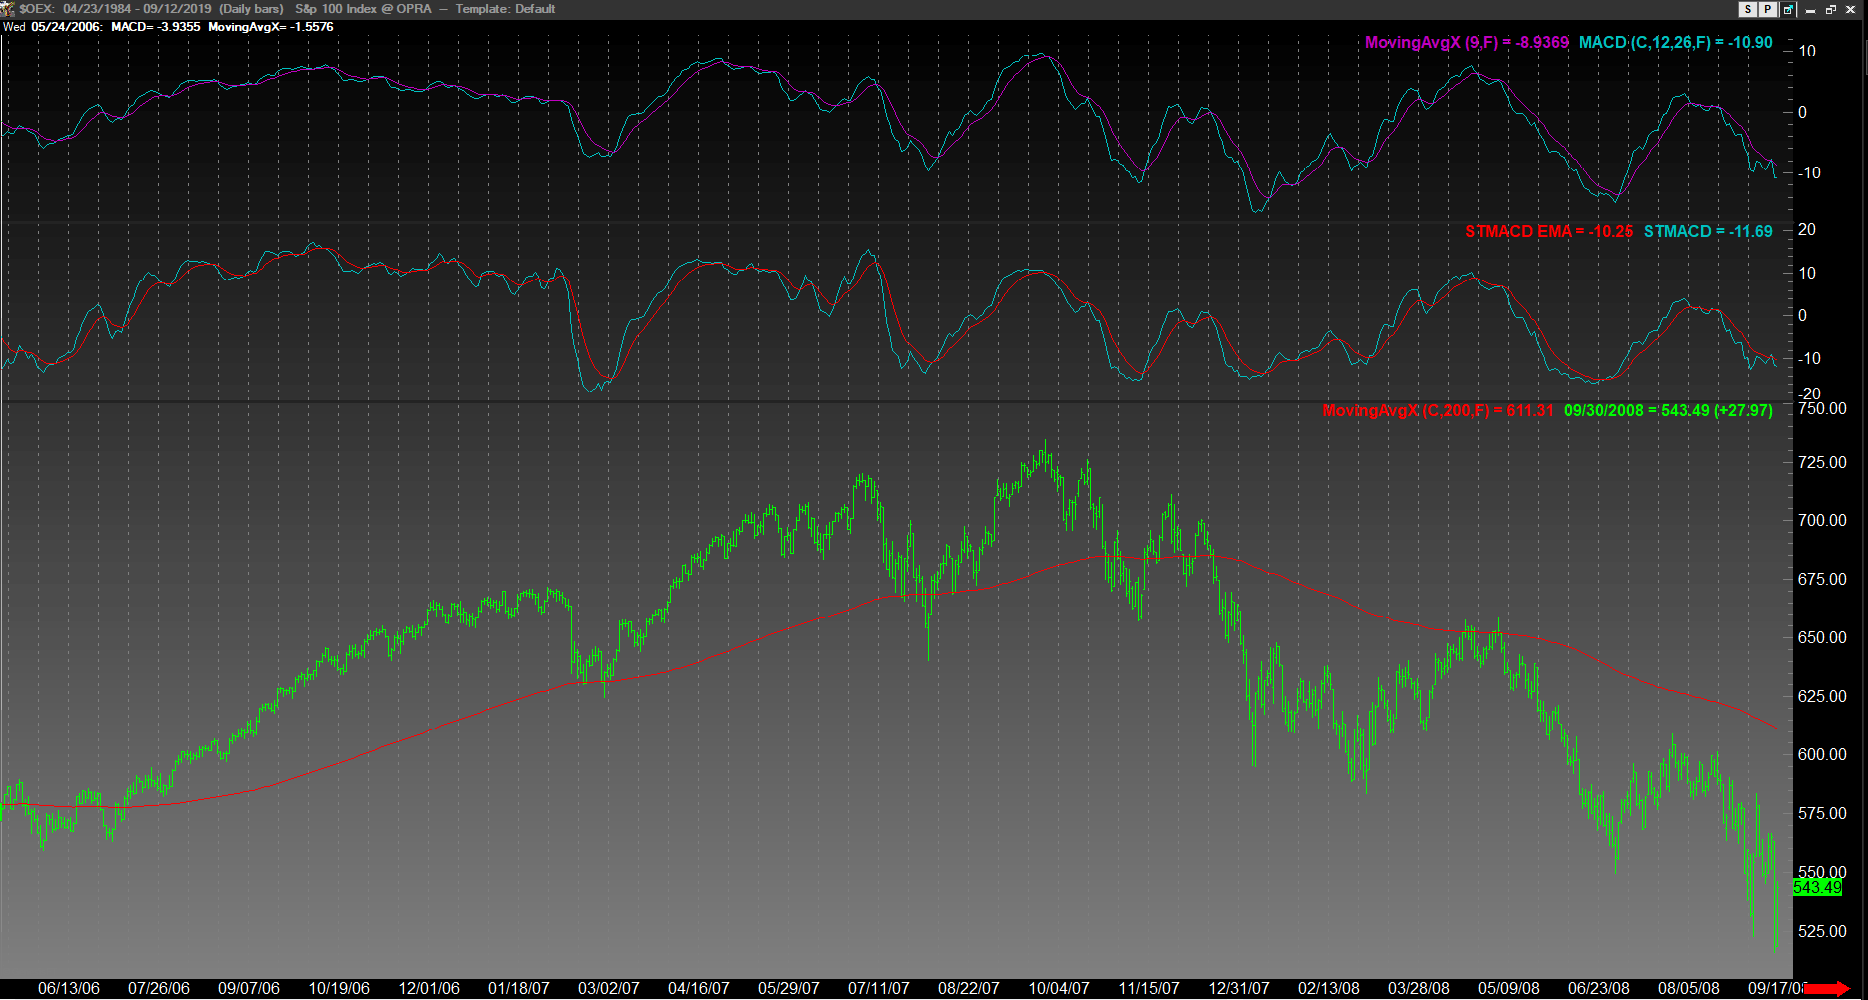
FIGURE 13: TRADE NAVIGATOR. This example chart illustrates the indicators on the OEX.
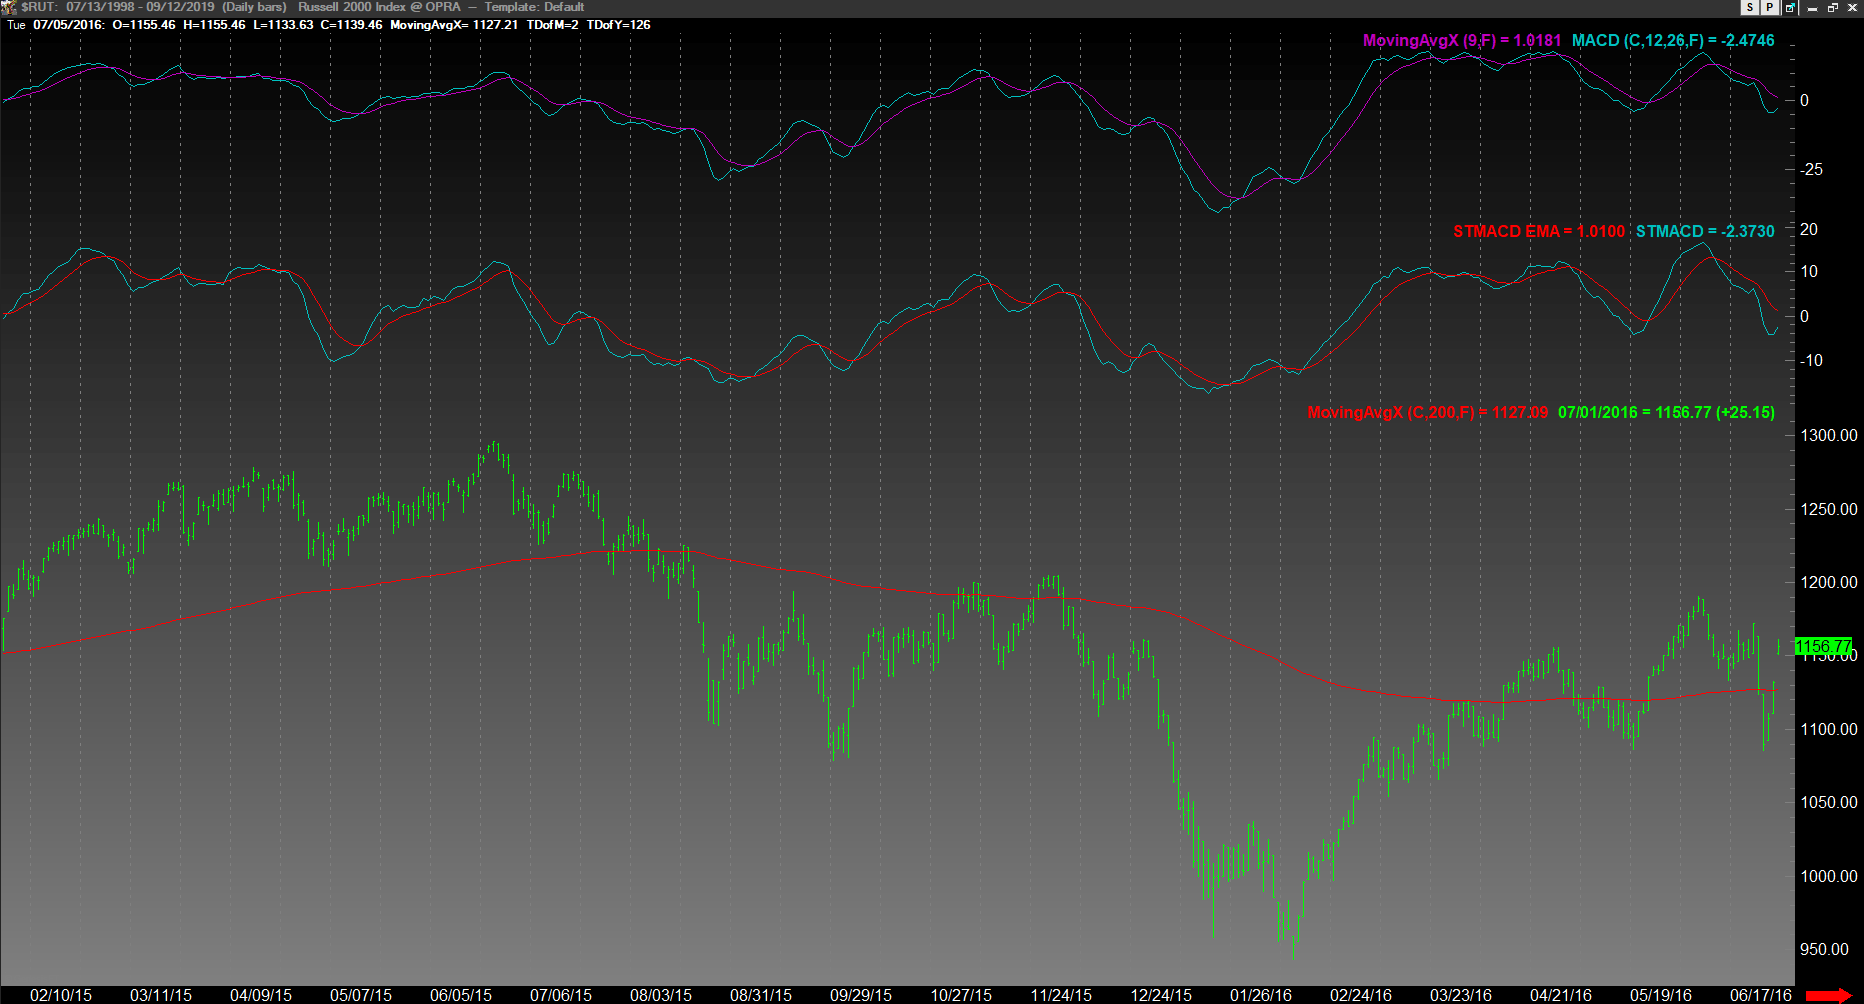
FIGURE 14: TRADE NAVIGATOR. This example chart illustrates the indicators on the RUT.
Users may contact our technical support staff by phone or by live chat if any assistance is needed in using the indicators or template.
—Genesis Financial Technologies
Tech support 719 884-0245
www.TradeNavigator.com
BACK TO LIST
MICROSOFT EXCEL: NOVEMBER 2019
In his article in this issue, author Vitali Apirine presents an interesting way to wrap stochastics around the longer and shorter legs used to create an MACD oscillator.
The resulting oscillator tends to be similar in shape but a bit more reactive when compared to the equivalent bare MACD.
Playing with the HH:LL lookback period only produces subtle visual changes in the shape of the STMACD. These changes in shape are accompanied by dramatic changes in the vertical scale, which can fall under the radar with the automatic “scale to fit” of the Excel charts.
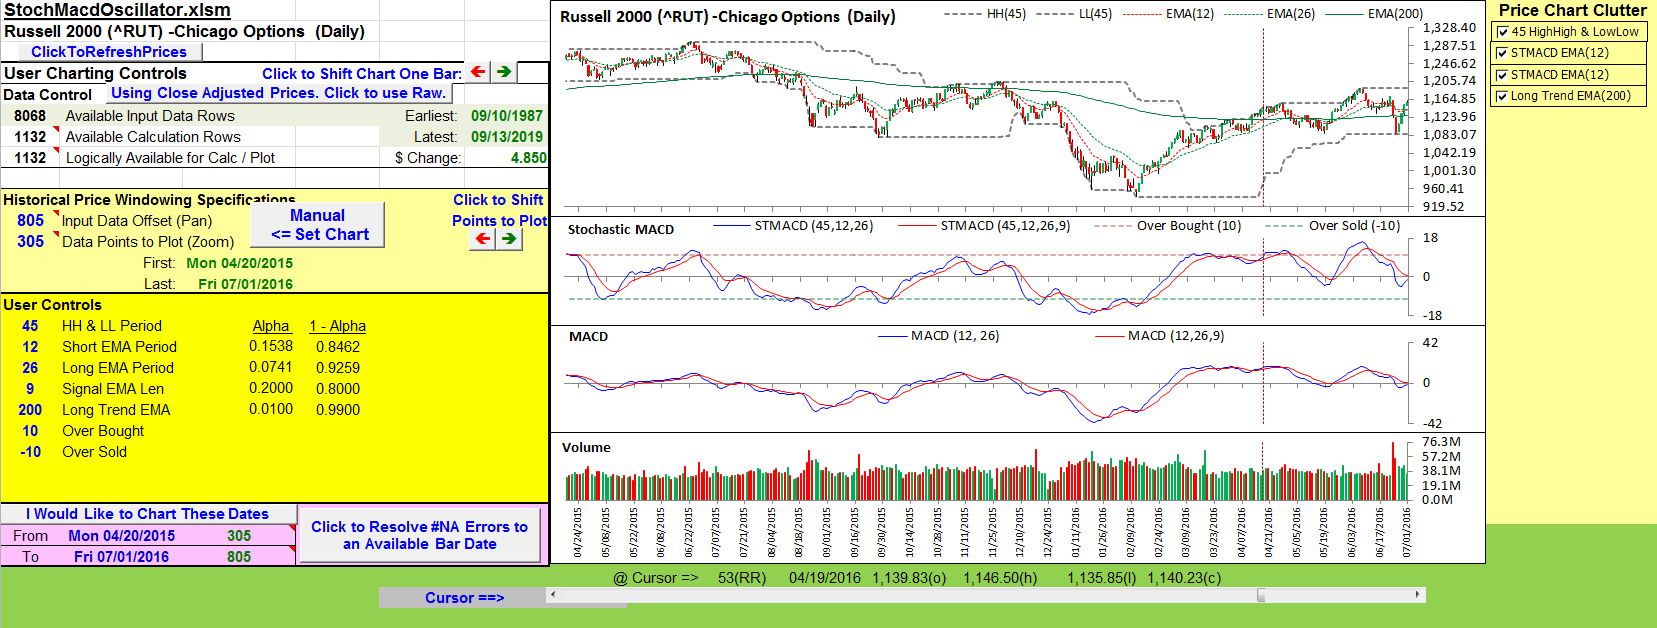
FIGURE 15: EXCEL. Here is an example of the STMACD oscillator with the author’s recommended settings.
Try 15 versus the recommended 45 as an example.
With that dramatic shift in vertical scale in mind, a plus/minus of 10 might be too small as overbought oversold levels if a lookback of 15 bars somehow becomes appropriate when designing a trading system around this oscillator.
Conversely, +/-10 might be too large if a lookback of 90 somehow becomes appropriate.
The user controls give you the ability to see the effects of any settings you might wish to explore.
The spreadsheet file for this Traders’ Tip can be downloaded here. To successfully download it, follow these steps:
- Right-click on the Excel file link, then
- Select “save as” (or “save target as”) to place a copy of the spreadsheet file on your hard drive.
—Ron McAllister
Excel and VBA programmer
rpmac_xltt@sprynet.com
BACK TO LIST
Originally published in the November 2019 issue of
Technical Analysis of STOCKS & COMMODITIES magazine.
All rights reserved. © Copyright 2019, Technical Analysis, Inc.


