TRADERS’ TIPS
December 2019
For this month’s Traders’ Tips, the focus is John Devcic’s article in this issue, “Using Renko Charts.” Here, we present the December 2019 Traders’ Tips code with possible implementations in various software.
You can right-click on any chart to open it in a new tab or window and view it at it’s originally supplied size, often much larger than the version printed in the magazine.
The Traders’ Tips section is provided to help the reader implement a selected technique from an article in this issue or another recent issue. The entries here are contributed by software developers or programmers for software that is capable of customization.

TRADESTATION: DECEMBER 2019
In “Using Renko Charts” in this issue, author John Devcic explains the advantages he finds in using renko charts to help visualize pure price movement, and he explains that while they may not be as well-known as other styles of charts, users may be well served in learning more about them.
The TradeStation platform allows users to display standard renko charts as well as custom renko charts that can be further tailored to the trader’s needs. The author describes a trading algorithm based simply on renko bar patterns. Here, we are providing TradeStation EasyLanguage code for a strategy based on Devcic’s concepts. The code for this strategy can be downloaded by visiting our TradeStation and EasyLanguage support forum at the link provided after the code listing. A sample chart showing the strategy implemented on a renko chart is shown in Figure 1.

FIGURE 1: TRADESTATION. Shown here is a renko chart of TSLA with the trading strategy applied.
Strategy: Renko Bar Count
// Using Renko Charts
// John Devcic
// TASC Dec 2019

inputs:
	NumBricksForEntry( 2 ),
	DollarStopAmtPerShare( .2 ),
	AllowReversal( true ) ;

variables:
	SequenceCount( 0 ),
	MP( 0 ),
	EP( 0 ) ;


MP = MarketPosition ;
EP = EntryPrice ;

if Close > Open then
begin
	if SequenceCount < 0 then
		SequenceCount = 1
	else
		SequenceCount += 1 ;
end
else
begin
	if SequenceCount > 0 then
		SequenceCount = -1
	else
		SequenceCount -= 1 ;
end ;

if MP = 0 or AllowReversal then
begin
	if SequenceCount >= NumBricksForEntry then
		Buy ("Renko LE") this bar on Close
	else if SequenceCount <= -NumBricksForEntry then
		Sell Short ("Renko SE") this bar on close ;
end ;

if MP <> 0 then
begin
	if ( ( MaxPositionProfit - OpenPositionProfit )
		/ CurrentShares >= DollarStopAmtPerShare ) then
	begin
		BuyToCover ("Trail SX") this bar on Close ;
		Sell ("Trail LX") this bar on Close ;
	end ;
end ;
To download the EasyLanguage code, please visit our TradeStation and EasyLanguage support forum. The files for this article can be found here: https://community.tradestation.com/Discussions/Topic.aspx?Topic_ID=156727. The filename is “TASC_DEC2019.ZIP.”
For more information about EasyLanguage in general, please see: https://www.tradestation.com/EL-FAQ.
This article is for informational purposes. No type of trading or investment recommendation, advice, or strategy is being made, given, or in any manner provided by TradeStation Securities or its affiliates.
—Doug McCrary
TradeStation Securities, Inc.
www.TradeStation.com
BACK TO LIST

THINKORSWIM: DECEMBER 2019
In “Using Renko Charts” in this issue, author John Devcic discusses a trading strategy implemented on renko charts. Thinkorswim has a built-in algorithm to calculate ATR (average true range) for all range bars (including renko) depending on the time interval chosen, as explained in the article.
Thinkorswim also has two existing strategies that can provide entry and exit points for those wishing to implement Devcic’s strategy described in his article. Thinkorswim users can use ConsBarsUpLE, with the first input set to “2” and the position effect set to “To Open,” and then use ConsBarsDownSE, with the first entry set to “3” and the position effect set to “To Close.”
To load a sample of a chart with these strategies, click on https://tos.mx/nhekNtr or enter this address into “open shared item” under the setup tab. This can be further added to by using the StopLossLX and StopLoss5X strategies as well. To add these, click on studies → edit studies → strategies and then locate the strategies on the left-hand side and double-click. The “?” icon will give more information on these functions and their appropriate implementation.
Figure 2 shows a year-to-date renko chart of Boeing (BA) using an average true range (ATR) aggregation period.
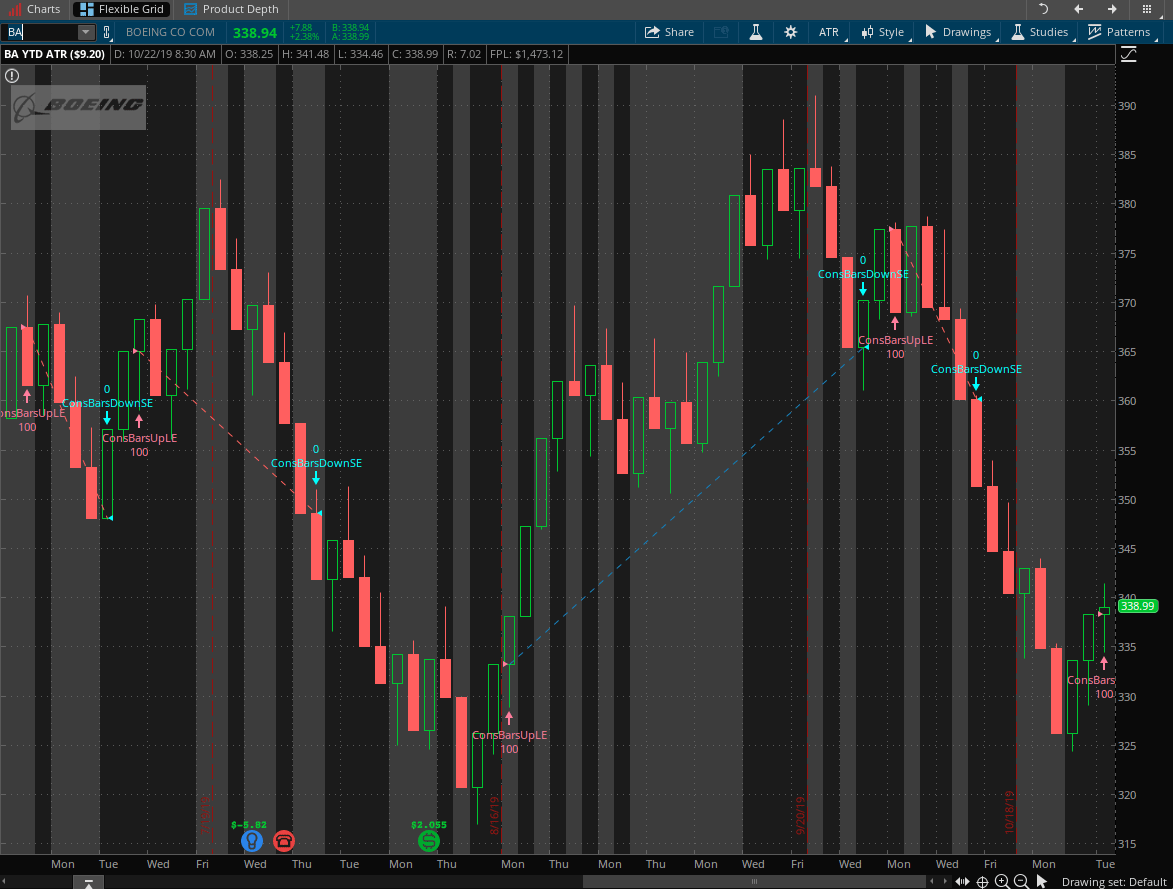
FIGURE 2: THINKORSWIM. A renko chart of Boeing (BA) using an average true range (ATR) aggregation period is shown.
—thinkorswim
A division of TD Ameritrade, Inc.
www.thinkorswim.com
BACK TO LIST

QUANTACULA STUDIO: DECEMBER 2019
Quantacula Studio provides renko charts via its Trend Chart Styles extension. The extension also supports kagi, line break, and point & figure charts. It contains several different elements related to each chart style. For renko specifically, the extension includes:
- The Renko ChartStyle, allowing you to view your charts in renko format
- A RenkoBoxCount Indicator, which returns the number of renko boxes at any point in the source data
- A Renko Reversal Condition Building Block that you can use in the drag & drop trading model builder to create renko-based trading systems without any code
- A Renko C# class that lets you easily access renko methods in your hand-coded trading systems.
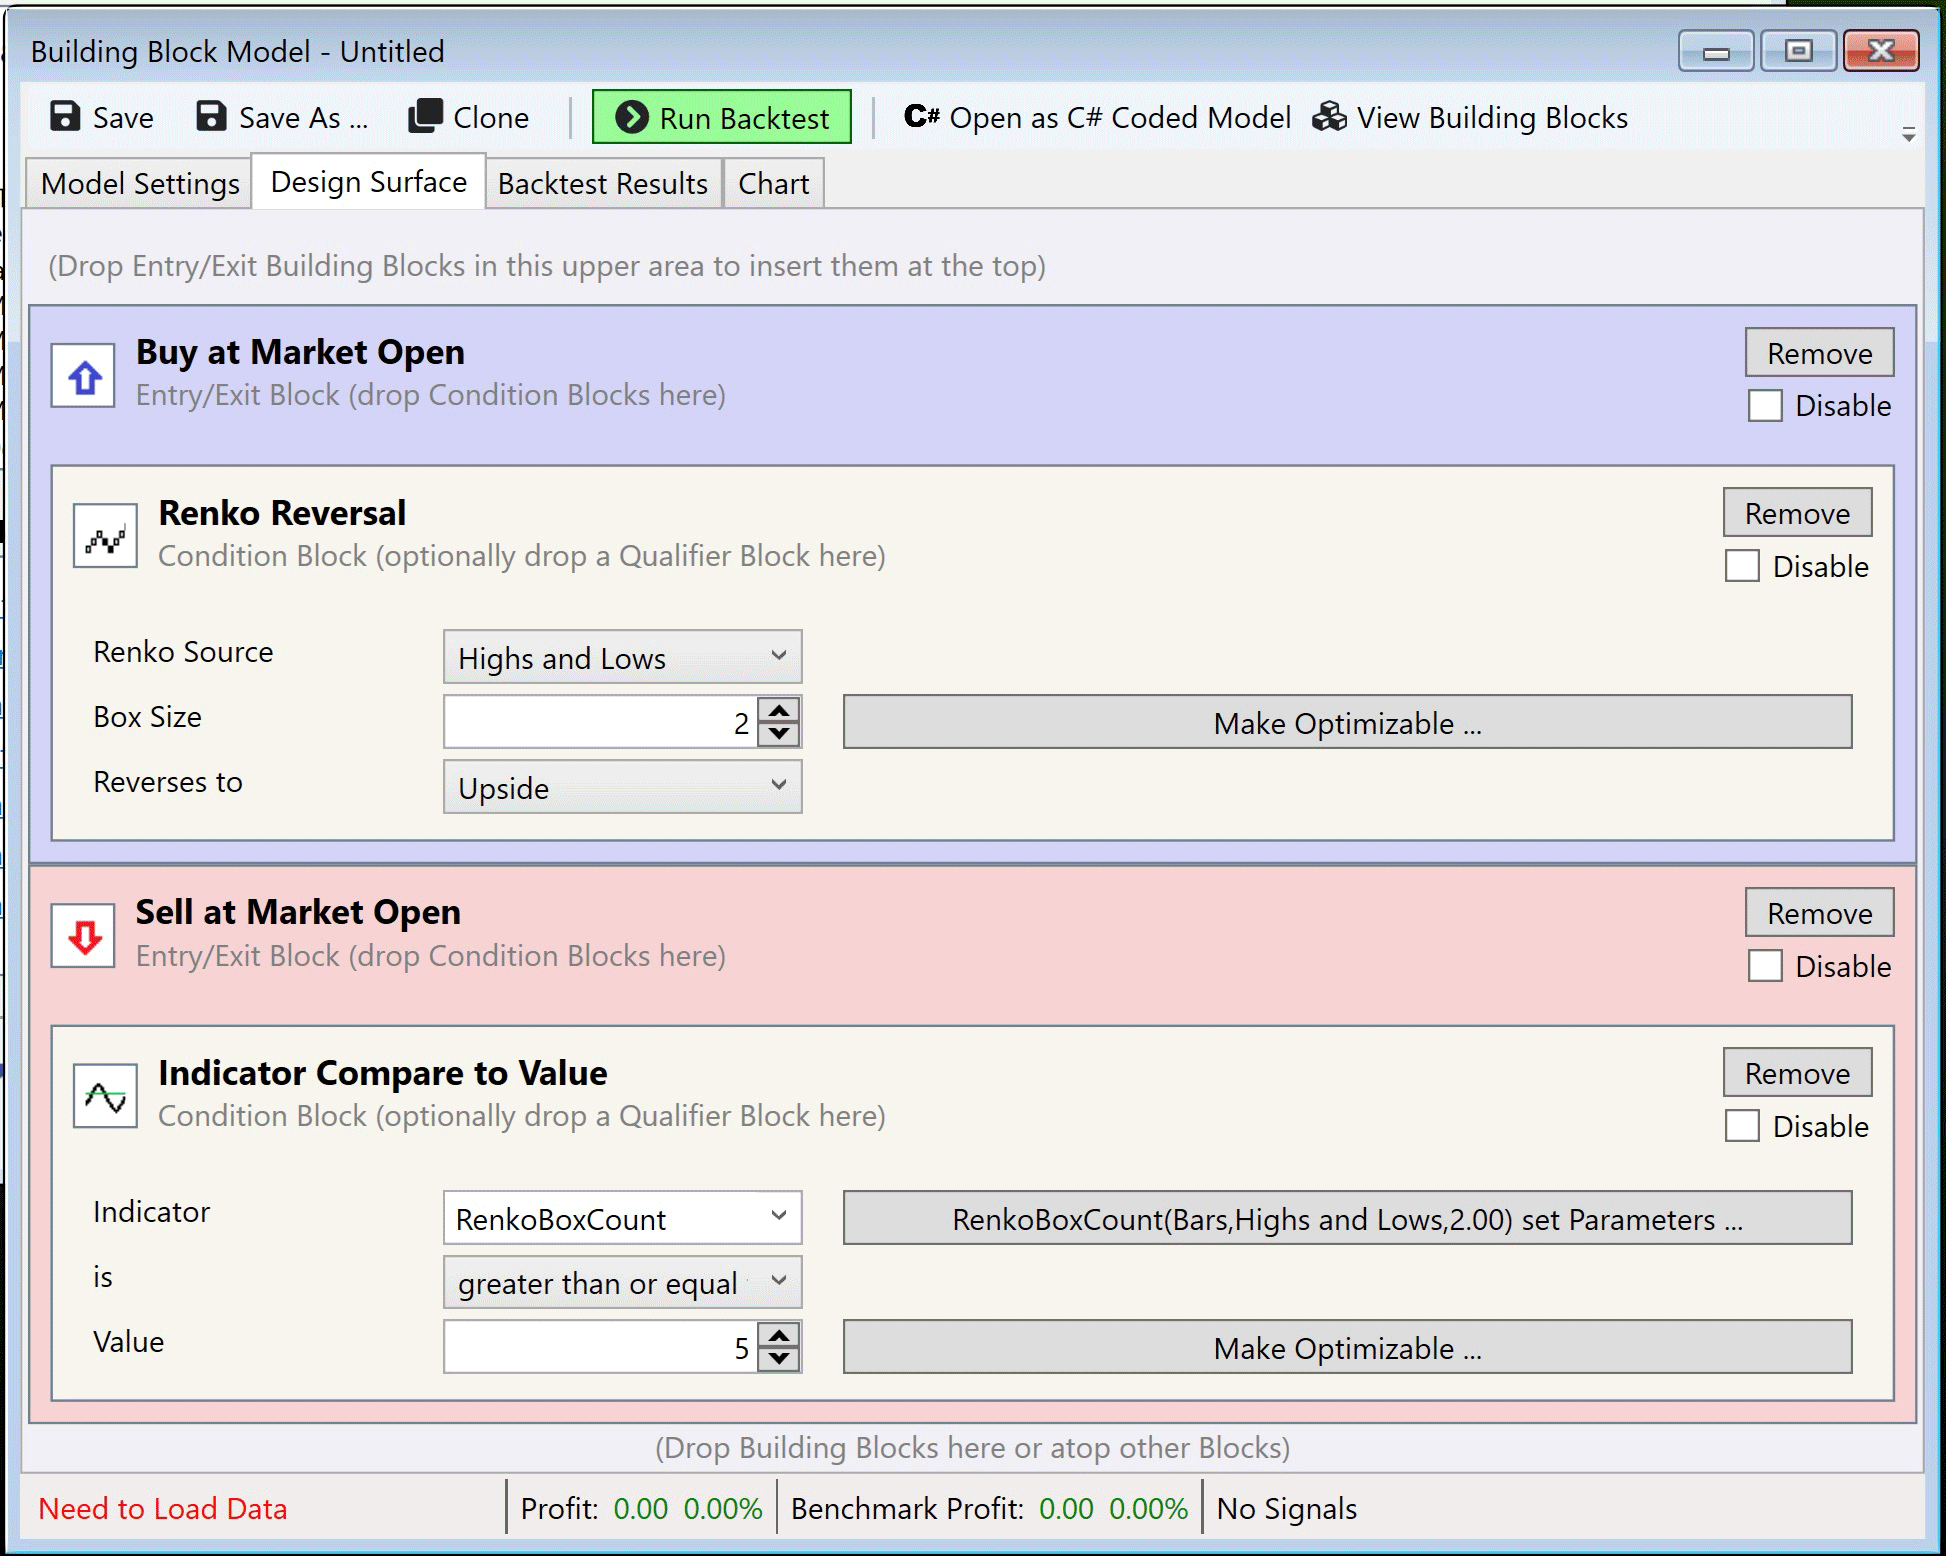
FIGURE 3: QUANTACULA STUDIO. This shows a sample renko model built using Quantacaula Studio’s drag & drop model builder.
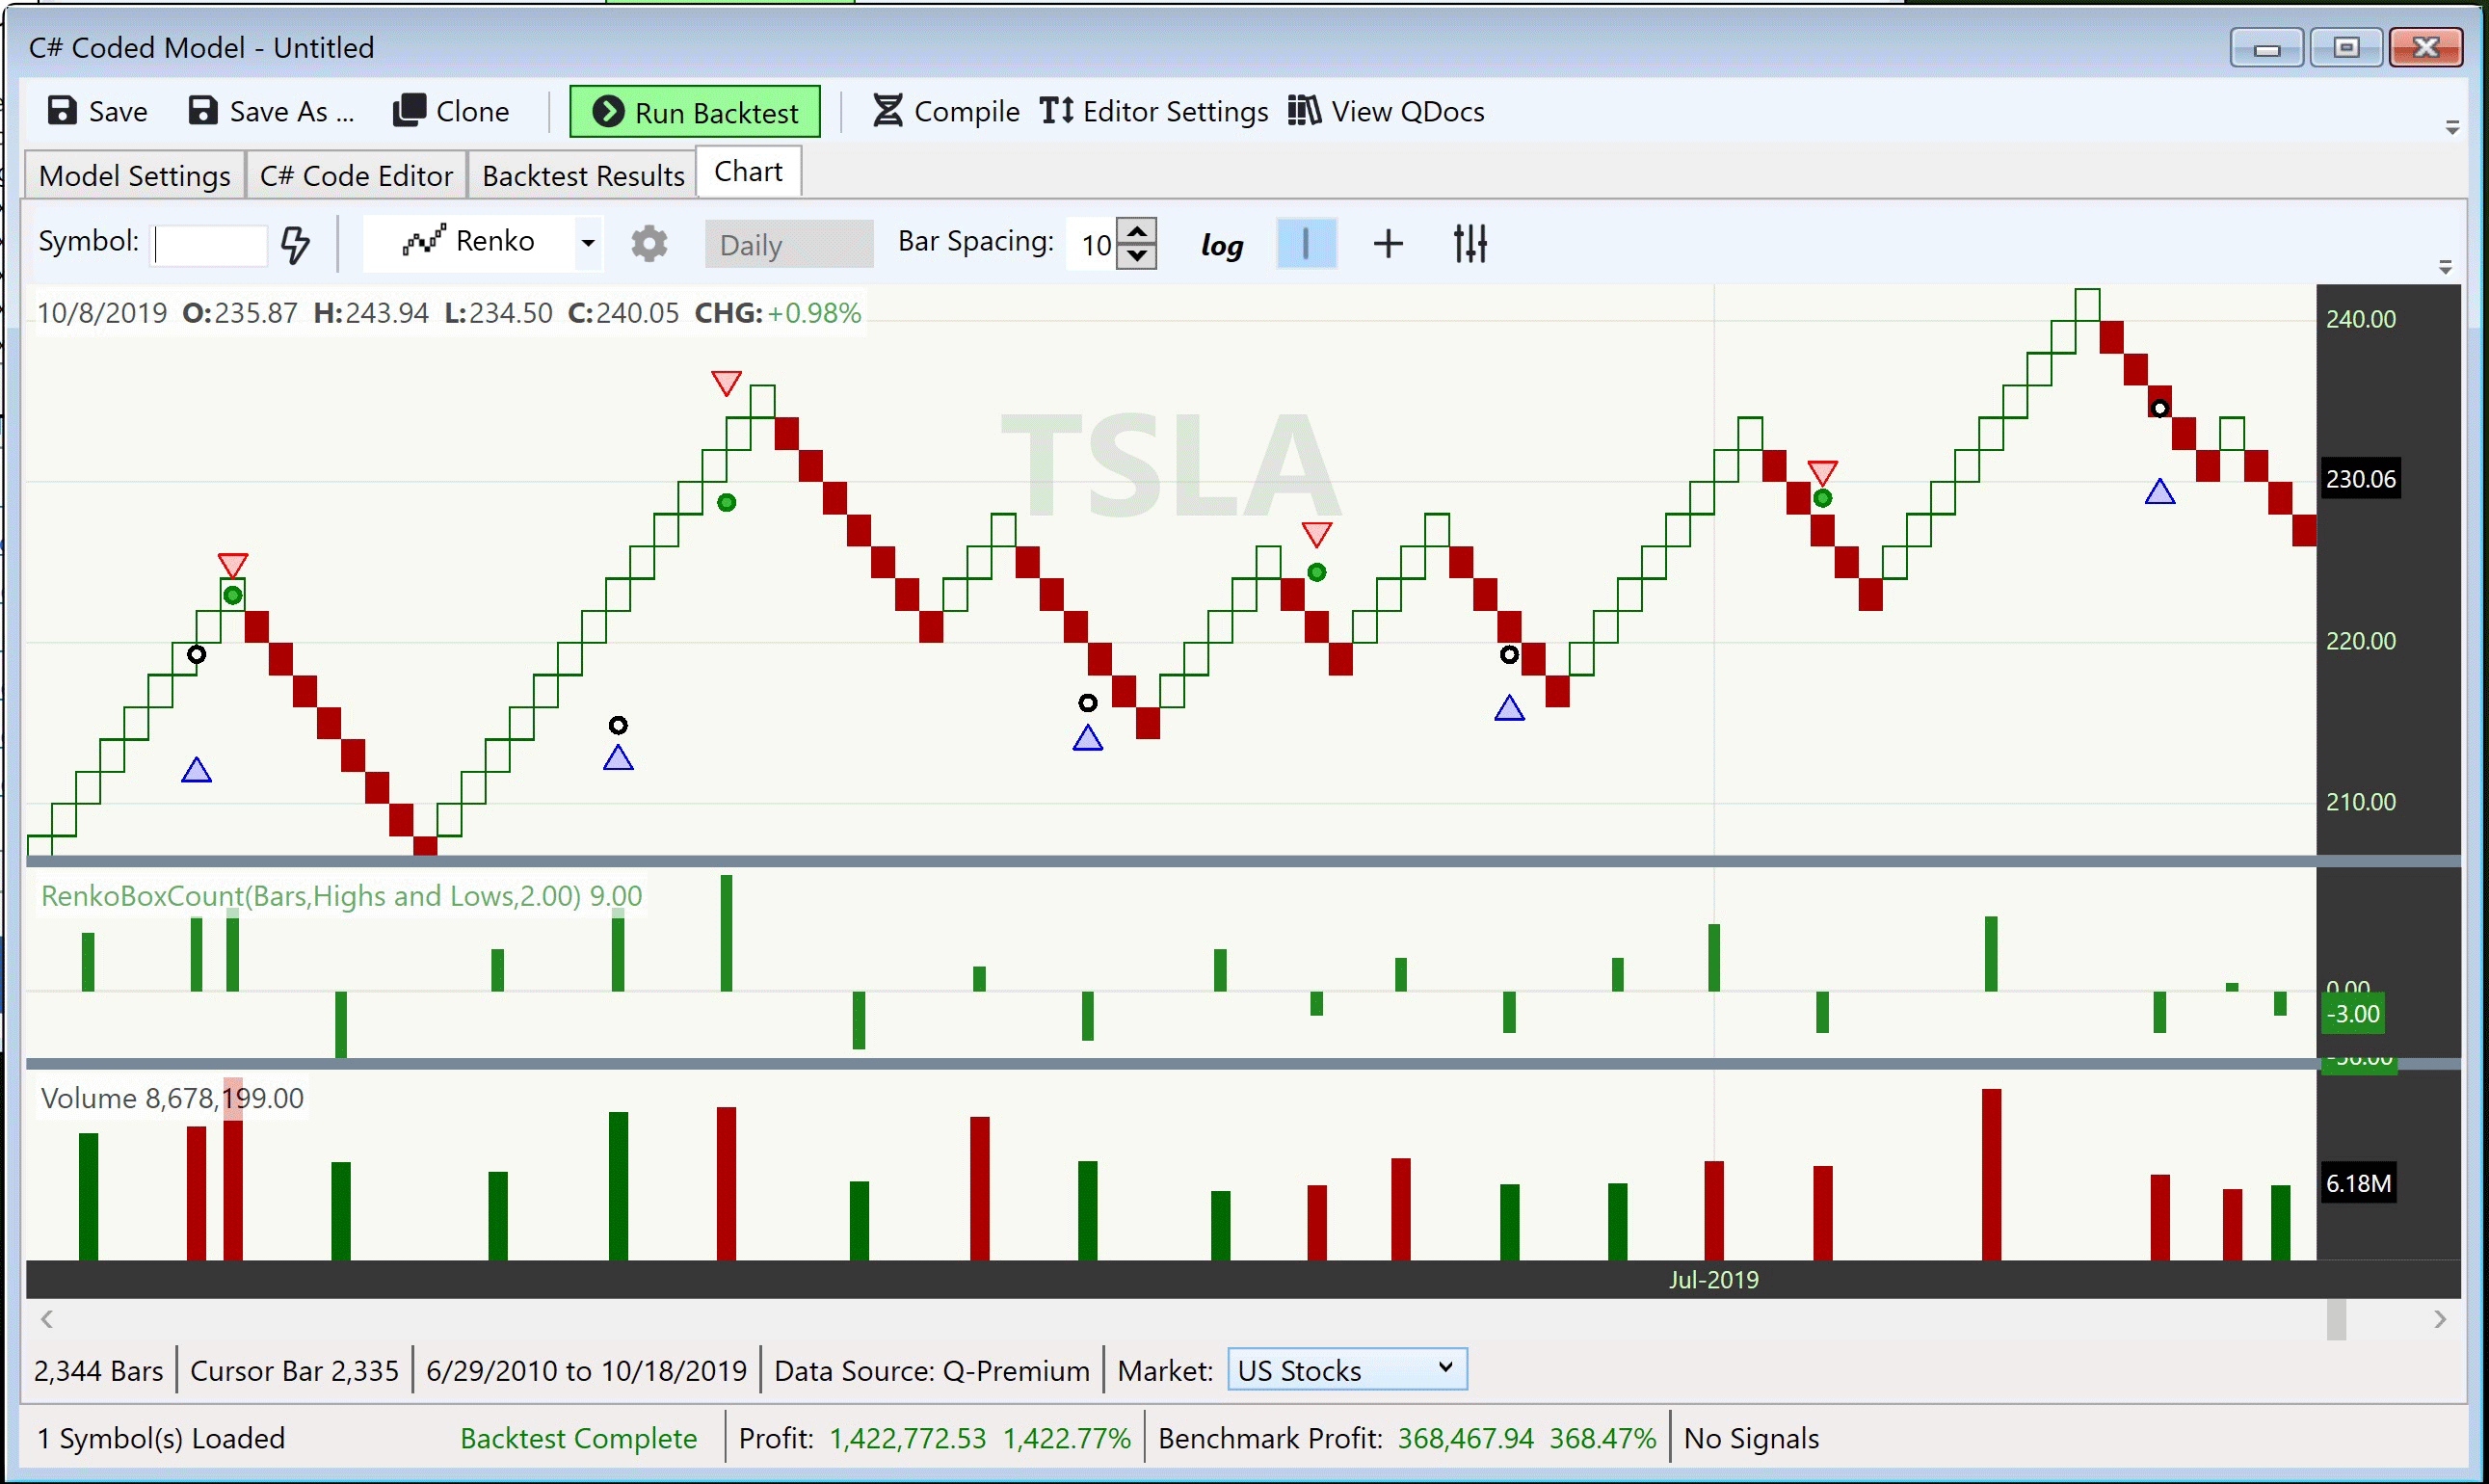
FIGURE 4: QUANTACULA STUDIO. The sample renko model was run against TSLA, resulting in a series of four consecutive profitable trades.
Figures 3 & 4 show a sample trading model built using Quantacula Studio’s drag & drop builder. The model goes long on a renko upside reversal, and closes the long position after five renko up boxes have been established. It calculates renko using highs and lows, with a box count of 2. Running this model on TSLA resulted in a 1,422% profit, compared to only 956% for buy & hold. The trend-following nature of the renko model allowed it to capture more gains in this example while getting out and avoiding some of the downside moves.
—Dion Kurczek, Quantacula LLC
info@quantacula.com
www.quantacula.com
BACK TO LIST

WEALTH-LAB: DECEMBER 2019
Wealth-Lab users have long been able to backtest and trade strategies based on renko charts. The classic version of renko charts is included in Wealth-Lab as the strategy named “renko basic [Rev.A].” It’s a simple trend-following strategy that enters after a bullish “brick” emerges and exits after a bearish brick (and vice versa for short trades). (See Figure 5.)
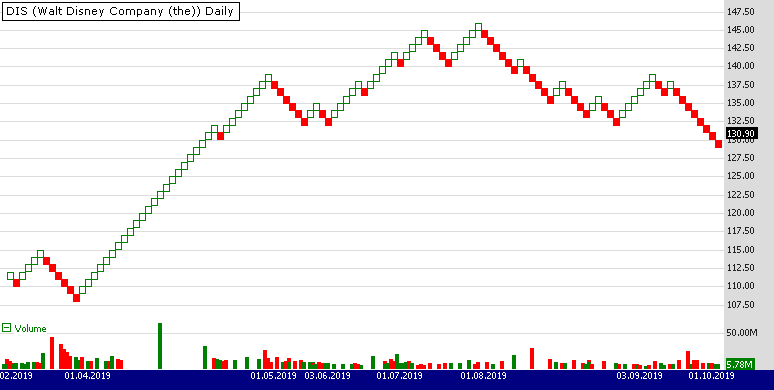
FIGURE 5: WEALTH-LAB. This shows a basic renko applied to a chart of DIS (Walt Disney Co.). (Data provided by Yahoo Finance)
The adaptive approach that author John Devcic discusses in his article in this issue, “Using Renko Charts,” is represented with a downloadable strategy named “adaptive renko.” Its entries and exits are made in the same trend-following manner as the “renko basic” strategy does, except that the brick size is set to a multiple of an ATR. (See Figure 6.)
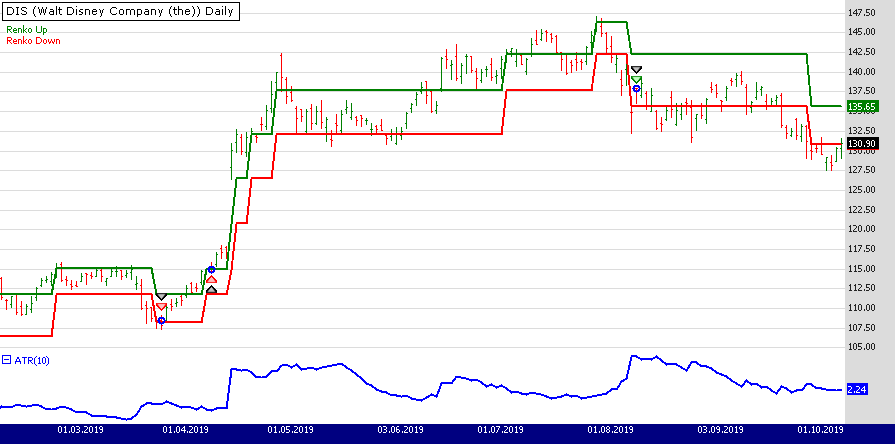
FIGURE 6: WEALTH-LAB. The adaptive “brick” size expands and contracts with volatility as the 10-day ATR changes.
You can get the strategy’s C# code by downloading it from Wealth-Lab’s open strategy dialog.
—Gene (Eugene) Geren, Wealth-Lab team
MS123, LLC
www.wealth-lab.com
BACK TO LIST

NINJATRADER: DECEMBER 2019
The renko trading strategy that’s discussed in the article in this issue by John Devcic titled “Using Renko Charts” is available for download at the following links for NinjaTrader 8 and for NinjaTrader 7:
Once the file is downloaded, you can import the strategy into NinjaTader 8 from within the control center by selecting Tools → Import → NinjaScript Add-On and then selecting the downloaded file for NinjaTrader 8. To import in NinjaTrader 7, from within the control center window, select the menu File → Utilities → Import NinjaScript and select the downloaded file.
You can review the strategy’s source code in NinjaTrader 8 by selecting the menu New → NinjaScript Editor → Strategies from within the control center window and selecting the “RenkoStrategy” file. You can review the indicator’s source code in NinjaTrader 7 by selecting the menu Tools → Edit NinjaScript → Strategy from within the control center window and selecting the “RenkoStrategy” file.
NinjaScript uses compiled DLLs that run native, not interpreted, which provides you with the highest performance possible.
A sample chart implementing the strategy is shown in Figure 7.

FIGURE 7: NINJATRADER. The renko trading strategy is displayed on a 2-renko chart of AAPL on 10/21/2019 taking two trailing stop trades.
—Raymond Deux, Chris Lauber, & Jim Dooms
NinjaTrader, LLC
www.ninjatrader.com
BACK TO LIST

NEUROSHELL TRADER: DECEMBER 2019
NeuroShell Trader uses a tool named InterChart Tools Renko Bars to impelement renko bars, which is the charting style described by John Devcic in his article in this issue (“Using Renko Charts”).
The InterChart Tools Renko Bars tool includes parameters that allow you to specify the number of ticks used to calculate the up part of the renko bar as well as the number of ticks used to compute the down part. Since any bar’s function is to absorb noise, and rising price jitter is often different from falling price jitter, the IctRenko bars permit an asymmetrical definition to accommodate this. IctRenko bars are only displayed on the chart when price has moved either up or down by the number of virtual ticks specified in either the ticks per up bar or ticks per down bar.
NeuroShell renko bars may, at the user’s discretion, be controlled by the NeuroShell Trader optimizer to identify the optimal bar size and noise absorption for a given algorithm or security.
We used the InterChart Tools Renko Bars to develop a trading strategy where the rule compared the momentum of the renko bars to a zero threshold in order to generate trading signals. The optimizer found different-size renko bars for the long and short conditions. (See Figure 8.)

FIGURE 8: NEUROSHELL TRADER. This NeuroShell Trader chart shows the long and short entry renko bars graphed on a 0.25 range bar chart for the S&P emini and the corresponding trading strategy.
Users of NeuroShell Trader can go to the Stocks & Commodities section of the NeuroShell Trader free technical support website to download a copy of this or any previous Traders’ Tips.
—Marge Sherald, Ward Systems Group, Inc.
301 662-7950, sales@wardsystems.com
www.neuroshell.com
BACK TO LIST

TRADERSSTUDIO: DECEMBER 2019
The importable TradersStudio code file based on John Devcic’s article in this issue, “Using Renko Charts,” can be obtained on request via email to info@TradersEdgeSystems.com. The code is also shown below.
'USING RENKO CHARTS
'Author: John Devcic, TASC December 2019
'Coded by: Richard Denning, 10/20/19
'www.TradersEdgeSystems.com

'function to compute Renko close
Function RENKO_C(atrLen)
Dim rC As BarArray
Dim nRbars
Dim bSize
bSize = AvgTrueRange(atrLen)
If BarNumber = FirstBar Then rC = C
nRbars = Floor(Abs(C - rC[1])/bSize)

'uptrend continues
If C - rC[1] > bSize Then
  If C[1] > C[2] Then
    rC = rC[1] + nRbars*bSize
  End If
End If
'downtrend continues
If rC[1] - C  > bSize Then
  If C[1] < C[2] Then
    rC = rC[1] - nRbars*bSize
  End If
End If
'uptrend reversal
If  rC[1] - C > bSize Then
  If C[1] > C[2] And nRbars > 1 Then
    rC = rC[1] - nRbars*bSize
  End If
End If
'downtrend reversal
If C - rC[1] > bSize Then
  If C[1] < C[2] And nRbars > 1 Then
    rC = rC[1] + nRbars*bSize
  End If
End If

RENKO_C = rC

End Function
'------------------------------------------
'indicator plot for Renko indicator
sub RENKO_CHART(atrLen,atrMult)
Dim RK As BarArray
RK = RENKO_C(atrLen*atrMult)
PLOT1(RK)
End Sub
'-------------------------------------------
'Renko indicator trading system
Sub RENKO_sys(atrLen,atrMult,longOnly,shortOnly)
Dim RENKO_CLOSE As BarArray
RENKO_CLOSE = RENKO_C(atrLen*atrMult)

'code to go long:
If (longOnly=1 And shortOnly=0) Or (longOnly=0 And shortOnly=0) Then
If MRO(RENKO_CLOSE < RENKO_CLOSE[1],atrLen,1) < MRO(RENKO_CLOSE > RENKO_CLOSE[1],atrLen,1) Then
  If RENKO_CLOSE > RENKO_CLOSE[1] Then Buy("LE",1,0,Market,Day)
End If
  If RENKO_CLOSE < RENKO_CLOSE[1] Then ExitLong("LX","",1,0,Market,Day)
End If

'code to go short
If (shortOnly=1 And longOnly=0) Or (shortOnly=0 And longOnly=0) Then
If MRO(RENKO_CLOSE > RENKO_CLOSE[1],atrLen,1) < MRO(RENKO_CLOSE < RENKO_CLOSE[1],atrLen,1) Then
  If RENKO_CLOSE < RENKO_CLOSE[1] Then Sell("SE",1,0,Market,Day)
End If
  If RENKO_CLOSE > RENKO_CLOSE[1] Then ExitShort("SX","",1,0,Market,Day)
End If

End Sub
Although TradersStudio offers an option to display renko charts, I wanted to code a custom indicator that used the renko close and then plot it against a regular bar chart. I also coded a system that trades reversals in the renko close indicator. Checking several Nasdaq 100 stocks, I found that the atrMult factor needs to be between 1.4 to 1.7 to get profitable long trades results. I could not get the short side to be profitable so I coded in variables to allow long-only trading by setting the inputs longOnly=1 and shortOnly=0.
Figure 9 shows the renko close indicator (red line) on a chart of Apple, Inc. (AAPL) during several months of the year 2014. By plotting the renko close indicator on a bar chart, we can see the relationship of the renko chart to a bar chart that uses time-based bars. The areas where the renko close indicator doesn’t change represent consolidation zones. The trade arrows show several of the trades that were taken on a long-only test.

FIGURE 9: TRADERSSTUDIO. This shows the renko close indicator (red line) on a chart of Apple, Inc. (AAPL) during several months of the year 2014.
—Richard Denning
info@TradersEdgeSystems.com
for TradersStudio
BACK TO LIST
Originally published in the December 2019 issue of
Technical Analysis of STOCKS & COMMODITIES magazine.
All rights reserved. © Copyright 2019, Technical Analysis, Inc.


