TRADERS’ TIPS
March 2020

For this month’s Traders’ Tips, the focus is Markos Katsanos’ article
in this issue, “Using Relative Strength To Outperform The Market.” Here,
we present the March 2020 Traders’ Tips code with possible implementations
in various software.
You can right-click on any chart to open it in a new tab or window
and view it at it’s originally supplied size, often much larger than
the version printed in the magazine.
The Traders’ Tips section is provided to help the reader implement
a selected technique from an article in this issue or another recent issue.
The entries here are contributed by software developers or programmers for
software that is capable of customization.

TRADESTATION: MARCH 2020
In “Using Relative Strength To Outperform The Market” in this issue, author
Markos Katsanos presents a trading system based on a new relative strength
indicator he calls RSMK. The indicator improves on the traditional relative
strength indicator by separating periods of strong or weak relative strength.
Below is the TradeStation EasyLanguage code for an indicator and strategy
based on the author’s work. The strategy can easily be tested on a portfolio
of favorite symbols using TradeStation’s Portfolio Maestro application.
Indicator: RSMK
// RSMK
// Mark Katsanos
// TASC March 2020
// Set up chart / application with
// reference symbol as Data2
// For example Data2 = SPY

inputs:
	Length( 90 ),
	EMALength( 3 ) ;

variables:
	StockPrice( 0, Data1 ),
	ReferencePrice( 0, Data2 ),
	LogVal( 0 ),
	RSMK( 0 ) ;


StockPrice = Close of Data1 ;
ReferencePrice = Close of Data2 ;

if StockPrice > 0 and ReferencePrice > 0 then
	LogVal = Log( StockPrice / ReferencePrice ) ;

RSMK = XAverage( LogVal - LogVal[Length],
	EMALength ) * 100 ;

Plot1( RSMK, "RMSK" ) ;

Strategy: RSMK
// RSMK
// Mark Katsanos
// TASC March 2020
// Set up chart / application with
// reference symbol as Data2
// For example Data2 = SPY

inputs:
	Length( 90 ),
	EMALength( 3 ),
	DaysToHold( 180 ) ;

variables:
	StockPrice( 0, Data1 ),
	ReferencePrice( 0, Data2 ),
	LogVal( 0 ),
	RSMK( 0 ) ;

StockPrice = Close of Data1 ;
ReferencePrice = Close of Data2 ;

if StockPrice > 0 and ReferencePrice > 0 then
	LogVal = Log( StockPrice / ReferencePrice ) ;

RSMK = XAverage( LogVal - LogVal[Length],
	EMALength ) * 100 ;

if RSMK crosses over 0 then
	Buy next bar at Market ;

if BarsSinceEntry = DaysToHold then
	Sell next bar at Market ;
To download the EasyLanguage code, please visit our TradeStation and EasyLanguage
support forum. The files for this article can be found here: https://community.tradestation.com/Discussions/Topic.aspx?Topic_ID=168100.
The filename is “TASC_MAR2020.ZIP.” For more information about EasyLanguage
in general, please see https://www.tradestation.com/EL-FAQ.
A sample chart is shown in Figure 1.
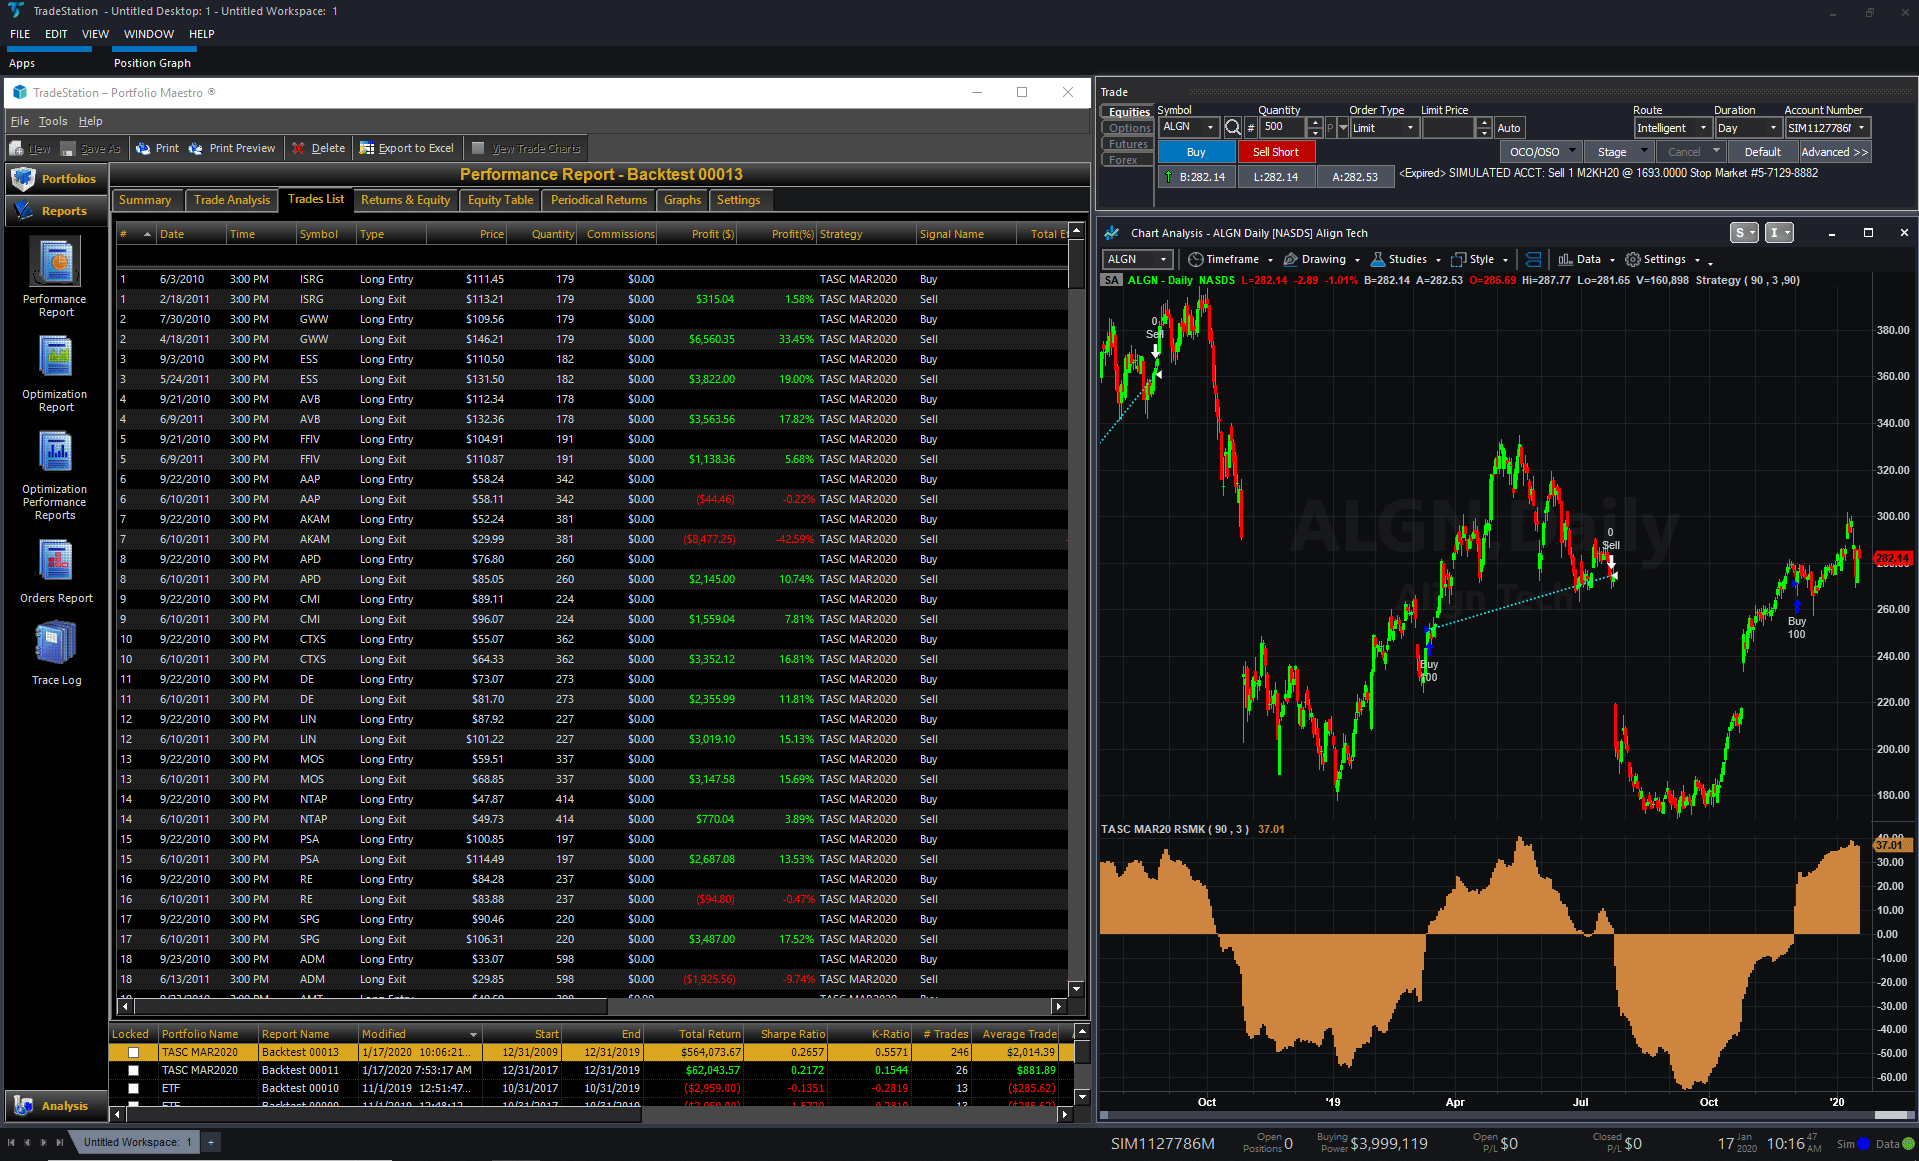
FIGURE 1: TRADESTATION. The RSMK
strategy and indicator are shown on a daily TradeStation chart of ALGN as
well as in TradeStation Portfolio Maestro applied to the S&P 500 index
stocks.
This article is for informational purposes. No type of trading or investment
recommendation, advice, or strategy is being made, given, or in any manner
provided by TradeStation Securities or its affiliates.
—Doug McCrary
TradeStation Securities, Inc.
www.TradeStation.com
BACK TO LIST

METASTOCK: MARCH 2020
Markos Katsanos’ article “Using Relative Strength To Outperform The Market”
in this issue introduces an alternative to the standard relative strength comparative
indicator. The MetaStock version of the RSMK is shown here:
RSMK:
Formula:
rsbars:= Input("RS Bars", 10, 300, 90);
sk:= Input("Smoothing Constant", 1, 5, 3);
sec1:= Security("ONLINE:SPY", C);
sk2:= LastValue(Rnd(sk));
rs:= C / sec1;
Mov( Log(rs) - Log(Ref(rs, -rsbars)), sk2, E) * 100;
—William Golson
MetaStock Technical Support
www.metastock.com
BACK TO LIST

THINKORSWIM: MARCH 2020
We have put together a study as well as a strategy based on the article in
this issue, “Using Relative Strength To Outperform The Market,” by Markos Katsanos.
To ease the loading process of the study, simply click on https://tos.mx/X5HkInN or
enter it into setup → open shared items from within thinkorswim,
then choose view thinkscript and name it “RSMKstudy.” Do the same
with https://tos.mx/aDKdOlc and
name it “RSMKstrategy” to add the strategy to thinkorswim. These can then be
added to your chart from the edit study and strategies menu within
thinkorswim charts.
The screenshot in Figure 2 shows both the study and the strategy (with P/L
graph) added to a three-year daily chart of ALGN. See Markos Katsanos’s article
on how to properly interpret these.
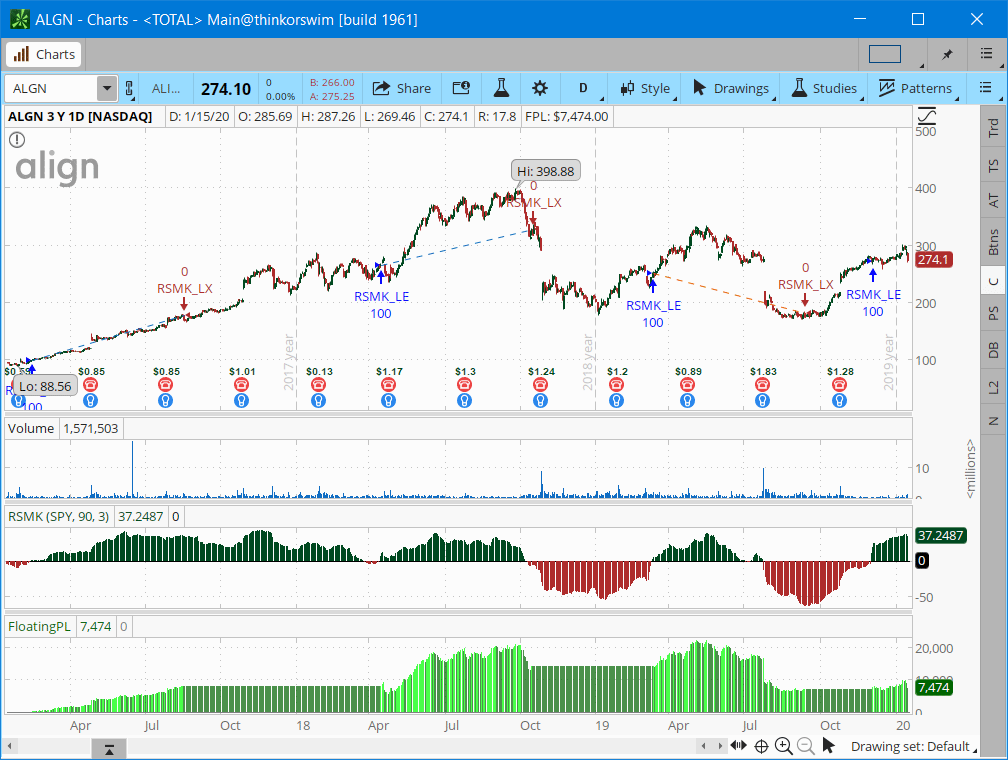
FIGURE 2: THINKORSWIM. The study
and strategy (with P/L graph) are shown on a three-year daily chart of ALGN.
—thinkorswim
A division of TD Ameritrade, Inc.
www.thinkorswim.com
BACK TO LIST

WEALTH-LAB: MARCH 2020
This month’s issue promises an interesting new take on relative strength as presented in the article by Markos Katsanos. The author describes
his new creature, the RSMK indicator, as offering many improvements over the
traditional relative strength indicator such as simple and objective interpretation,
the possibility to rank symbols, less lag, and other characteristics.
The long-only trading system presented here demonstrates how the RSMK can
be put to use in both entries and different kinds of exits:
Entry
- Buy next open when the RSMK crosses above zero
Exit
- Sell when the RSMK falls by a certain amount of indicator
points (20) off its 20-day high
- Sell when the indicator crosses below its 20-day exponential
moving average
- Sell when it crosses below zero.
CODE

using System;
using System.Collections.Generic;
using System.Text;
using System.Drawing;
using WealthLab;
using WealthLab.Indicators;
using TASCIndicators;

namespace WealthLab.Strategies
{
	public class TASCMar2020 : WealthScript
	{
		private StrategyParameter slider1;
		private StrategyParameter slider2;
		private StrategyParameter slider3;
		private StrategyParameter slider4;

		public TASCMar2020()
		{
			slider1 = CreateParameter("RSMK Period",90,50,130,10);
			slider2 = CreateParameter("RSMK EMA Period",3,2,10,1);
			slider3 = CreateParameter("Exit: off peak",20,10,40,10);
			slider4 = CreateParameter("Exit: EMA period",20,10,50,10);
		}

		protected override void Execute()
		{
			/* Autodetect Fidelity or Yahoo symbol */
			string wlp = "WealthLabPro";
			string app = System.Windows.Forms.Application.ProductName;
			string indexName = app == wlp ? ".SPX" : "^GSPC";

			var index = GetExternalSymbol( indexName, true).Close;
			var rsmk = RSMK.Series(Close, index, slider1.ValueInt, slider2.ValueInt);
			var rsmkEMA = EMAModern.Series(rsmk, slider4.ValueInt);
			var offRecentPeak = Highest.Series(rsmk, 20) - slider3.Value;
			string offPeak = string.Format("{0} pts off peak", slider3.Value);
			string ema = string.Format("{0}-period EMA of RSMK", slider4.Value);
			offRecentPeak.Description = offPeak; rsmkEMA.Description = ema;

			for(int bar = GetTradingLoopStartBar(1); bar < Bars.Count; bar++)
			{
				if ( IsLastPositionActive )
				{
					/* Sell when the indicator falls by a certain amount below its most recent peak */
					if( rsmk[bar] < offRecentPeak[bar] )
						SellAtMarket( bar + 1, LastPosition, offPeak );
					else
					/* Sell when RSMK crosses below its moving average */
					if ( CrossUnder( bar, rsmk, rsmkEMA) )
						SellAtMarket( bar + 1, LastPosition, "XU (EMA)");
					else
					/* Sell when RSMK crosses under zero */
					if ( CrossUnder( bar, rsmk, 0) )
						SellAtMarket( bar + 1, LastPosition, "XU (0)");

				}
				else
				{
					/* A buy signal is propagated when the indicator crosses over zero from below */
					if( CrossOver( bar, rsmk, 0) )
						BuyAtMarket( bar + 1);
				}
			}

			ChartPane paneRSMK1 = CreatePane(30,true,true);
			PlotSeries( paneRSMK1,rsmkEMA,Color.Red,LineStyle.Solid,1);
			PlotSeries( paneRSMK1,offRecentPeak,Color.Blue,LineStyle.Dashed,2);
			PlotSeries( paneRSMK1,rsmk,Color.DarkGreen,LineStyle.Histogram,3);
			for (int bar = 1; bar < Bars.Count; bar++)
			{
				SetSeriesBarColor( bar, rsmk, rsmk[bar] > 0 ? Color.DarkGreen : Color.Red);
				SetBackgroundColor( bar, rsmk[bar] > 0 ? Color.FromArgb(30, Color.Gray) : Color.Transparent);
			}
			HideVolume();
		}
	}
}
Mostly all of the parameters such as periods and points are optimizable. See
Figure 3 for an example chart implementation.
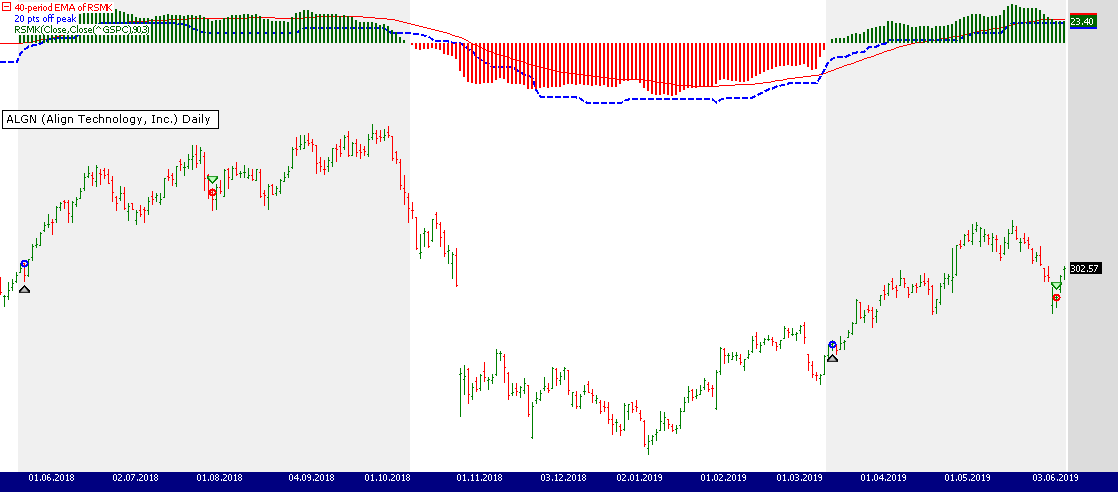
FIGURE 3: WEALTH-LAB. A Wealth-Lab
6 chart illustrating the application of the system’s rules on a daily chart
of ALGN (Align Technology). The RSMK and its derivatives, a 40-day EMA and
a level trailing 20 points off the recent 20-day peak, are plotted in the
upper pane. (Data provided by Yahoo Finance).
To execute this trading system, Wealth-Lab users need to install (or update
to) the latest version of the TASCIndicators library from our website or using
the built-in extension manager if you haven’t already done so, and restart
Wealth-Lab. Once the new indicator is listed under the TASC Magazine Indicators
group, it’s ready for use in Wealth-Lab.
—Gene (Eugene) Geren, Wealth-Lab team
MS123, LLC
www.wealth-lab.com
BACK TO LIST

NEUROSHELL TRADER: MARCH 2020
The RSMK described by Markos Katsanos in his article in this issue can be
easily implemented in NeuroShell Trader. Simply select new indicator from
the insert menu and use the indicator wizard to create the following
indicator:
RSMK:
  Mul2( ExpAvg( Momentum( Ln( Divide( Close, S&P500 Close) ), 90), 3), 100)
To set up an RSMK trading system, select new trading strategy from
the insert menu and enter the following in the appropriate locations
of the trading strategy wizard:
BUY LONG CONDITIONS:
CrossAbove(RSMK, 0)

SELL LONG CONDITIONS:
BarsSinceAct>=X(Trading Strategy,180)
After entering the system conditions, you can also choose whether the parameters
should be optimized. After backtesting the trading strategy, use the detailed
analysis button to view the backtest and trade-by-trade statistics for
the system.
Users of NeuroShell Trader can go to the Stocks & Commodities section
of the NeuroShell Trader free technical support website to download a copy
of this or any previous Traders’ Tips.
A sample chart is shown in Figure 4.
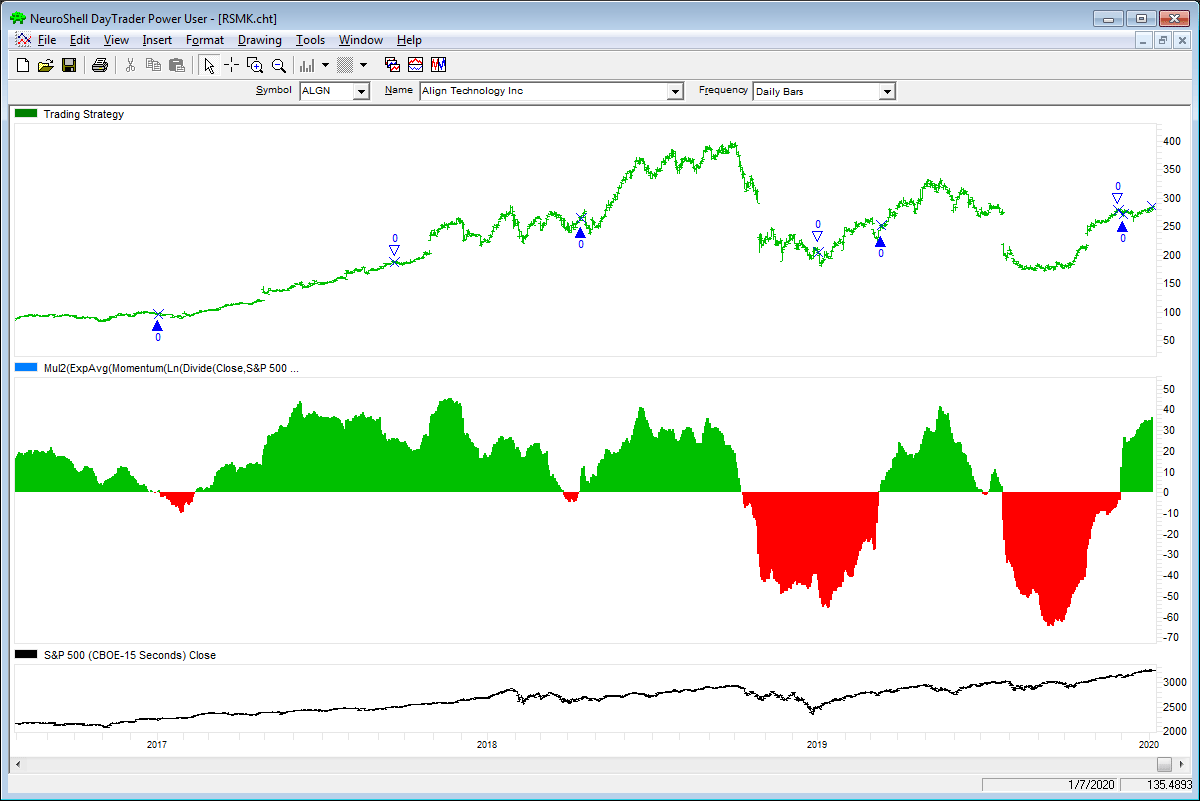
FIGURE 4: NEUROSHELL TRADER. This
NeuroShell Trader chart shows the RSMK indicator and trading system applied
to Align Technologies.
—Marge Sherald, Ward Systems Group, Inc.
301 662-7950, sales@wardsystems.com
www.neuroshell.com
BACK TO LIST

AIQ: MARCH 202
The importable AIQ EDS file based on Markos Katsanos’ article in this issue,
“Using Relative Strength To Outperform The Market,” can be obtained on request
via email to info@TradersEdgeSystems.com.
The code is also available below.
I coded the indicator described by Katsanos in his article. Figure 5 shows
the RSMK indicator with a 90-bar length on a chart of Fire Eye (FEYE). The
trading system is also coded.
!USING RELATIVE STRENGTH TO OUTPERFORM THE MARKET
!Author: Markos Katsanos, TASC March 2020
!coded by: Richard Denning, 01/13/2020
!www.TradersEdgeSystems.com

!RSMK (Relative Strength) Indicator
!Copyright Markos Katsanos 2020

C is [close].
RSBARS is 90.
SK is 3.
SEC2 is tickerudf("SPY",C).

!RSMK:
RSMK is expavg(ln(C/(SEC2))-ln(valresult(C/(SEC2),RSBARS)),3)*100.

!RSMK System:
Buy if RSMK > 0 and valrule(RSMK<0,1) and hasdatafor(200) >= 150.
Sell if {position days} >= 9*21.
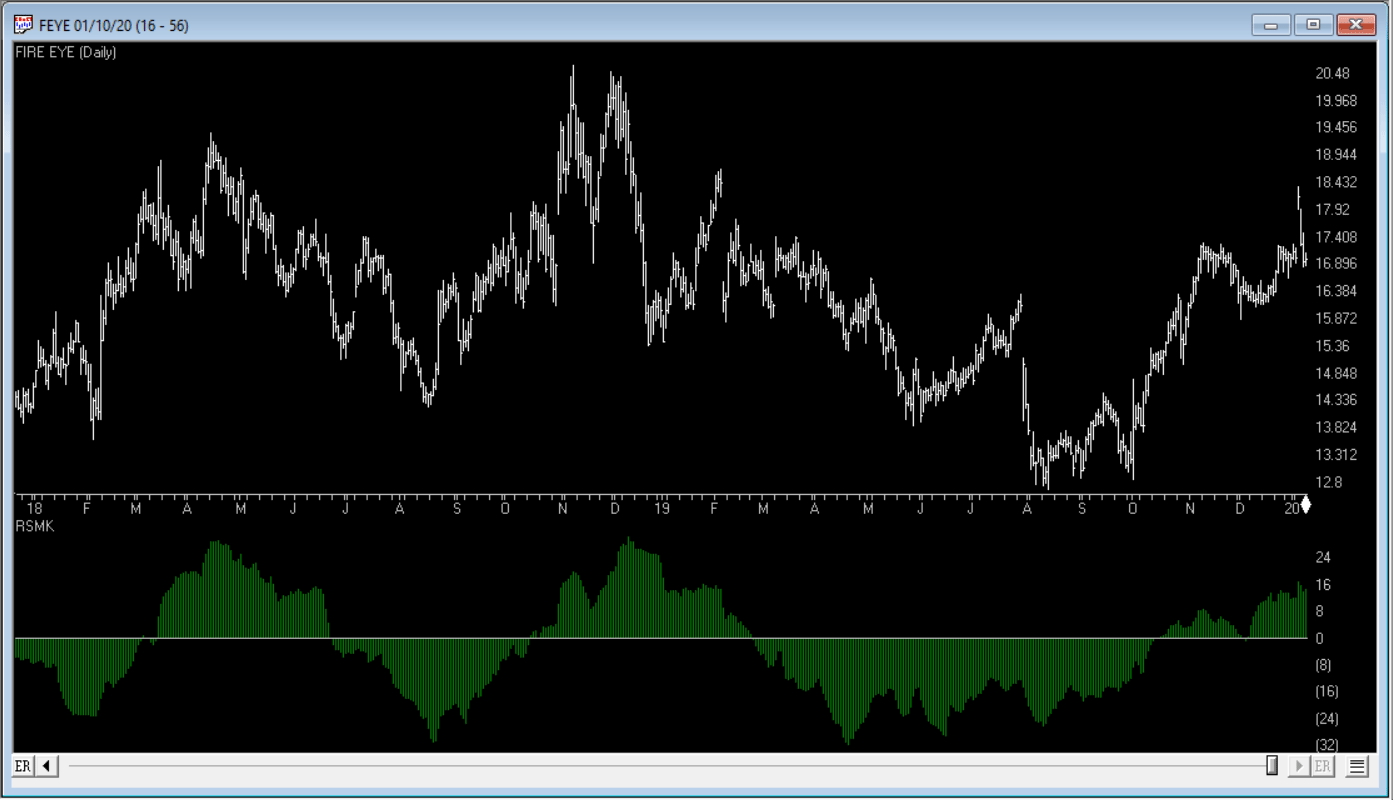
FIGURE 5: AIQ. The RSMK indicator
is shown on a chart of FEYE during 2018 and 2019.
—Richard Denning
info@TradersEdgeSystems.com
for AIQ Systems
BACK TO LIST

TRADERSSTUDIO: MARCH 2020
The importable TradersStudio files based on Markos Katsanos’ article in this
issue, “Using Relative Strength To Outperform The Market,” can be obtained
on request via email to info@TradersEdgeSystems.com.
The code is also available below.
I coded the indicator described by the author. Figure 6 shows the RSMK indicator
with a 90-bar length on a chart of Amazon (AMZN). The trading system is also
coded.
'USING RELATIVE STRENGTH TO OUTPERFORM THE MARKET
'Author: Markos Katsanos, TASC March 2020
'Coded by: Richard Denning, 01/13/2020
'www.TradersEdgeSystems.com

'Function to compute RSMK(Relative Strength) Indicator:
'Copyright Markos Katsanos 2020

Function RSMK(RSBARS,SK)
'RSBARS = 90, SK = 3
Dim SEC2 As BarArray
Dim RS1 As BarArray
Dim RS2 As BarArray
SEC2 = C Of independent1 'SPY

'RSMK:
RS1 = Log(C/SEC2)
RS2 = Log(C[RSBARS]/SEC2[RSBARS])
RSMK = XAverage(RS1-RS2,3)*100
End Function
'------------------------------------------------

'RSMK (Relative Strength) Indicator Plot:
'Copyright Markos Katsanos 2020

Sub RSMK_IND(RSBARS,SK)

Dim myRSMK As BarArray
Dim SEC2 As BarArray
sec2 = C Of independent1
myRSMK = RSMK(RSBARS,SK)
plot1(myRSMK)
plot2(0)
End Sub
'------------------------------------------------
'RSMK (Relative Strength) Trading System:
'Copyright Markos Katsanos 2020

Sub RSMK_SYS(RSBARS,SK,exitMonths)
'RSBARS = 90, SK = 3, exitMonths = 9
Dim myRSMK As BarArray
Dim SEC2 As BarArray
SEC2 = C Of independent1
myRSMK = RSMK(RSBARS,SK)
If myRSMK > 0 And myRSMK[1]<0 Then
  Buy("LE",1,0,Market,Day)
End If
If BarsSinceEntry >= exitMonths*21 Then
  ExitLong("LX","",1,0,Market,Day)
End If

End Sub
'-------------------------------------------------
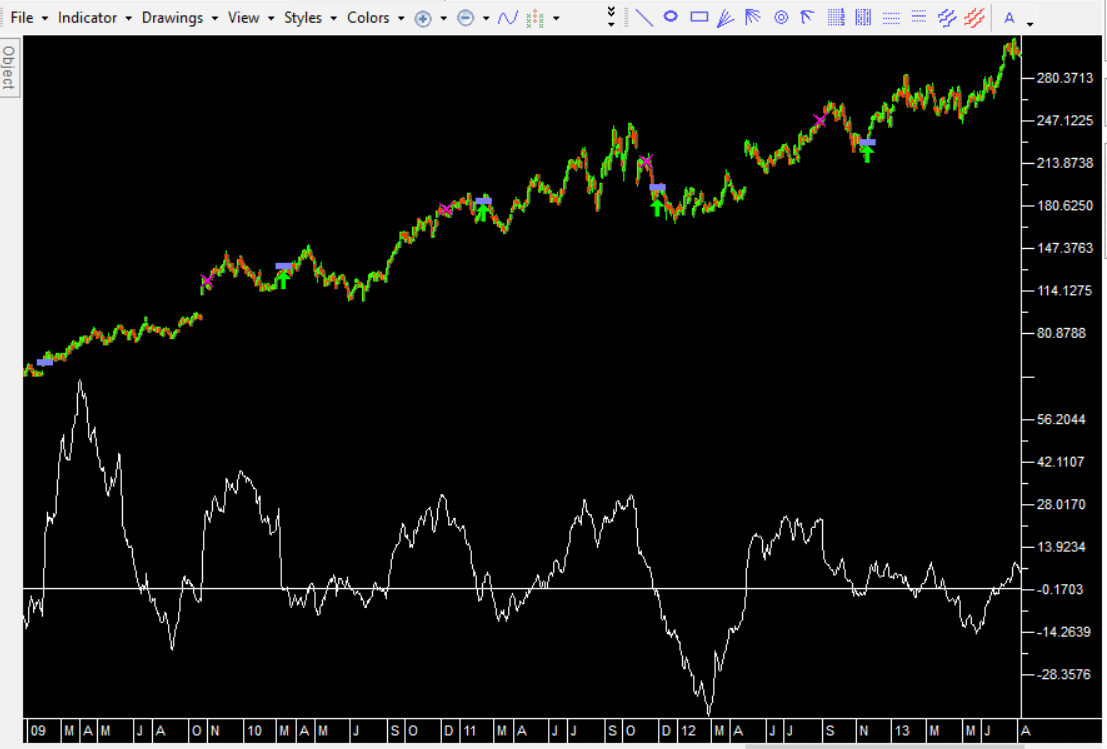
FIGURE 6: TRADERSSTUDIO. The RSMK
indicator is shown on a chart of AMZN with trading system signals.
—Richard Denning
info@TradersEdgeSystems.com
for TradersStudio
BACK TO LIST

NINJATRADER: MARCH 2020
The RSMK indicator and strategy, as discussed in “Using Relative Strength
To Outperform The Market” by Markos Katsanos in this issue, is available for
download at the following links for NinjaTrader 8 and for NinjaTrader 7:
Once the file is downloaded, you can import the strategy into NinjaTader 8
from within the control center by selecting Tools → Import → NinjaScript
Add-On and then selecting the downloaded file for NinjaTrader 8. To import
into NinjaTrader 7, from within the control center window, select the menu
File → Utilities → Import NinjaScript and select the downloaded file.
You can review the indicator and strategy source code in NinjaTrader 8 by
selecting the menu New → NinjaScript Editor → Indicators or Strategies
from within the control center window and selecting the RSMK or RSMKSystem
file, respectively. You can review the indicator and strategy source code in
NinjaTrader 7 by selecting the menu Tools → Edit NinjaScript → Indicator
or Strategy from within the control center window and selecting the RSMK or
RSMKSystem file, respectively.
NinjaScript uses compiled DLLs that run native, not interpreted, which provides
you with the highest performance possible.
A sample chart implementing the strategy is shown in Figure 7.
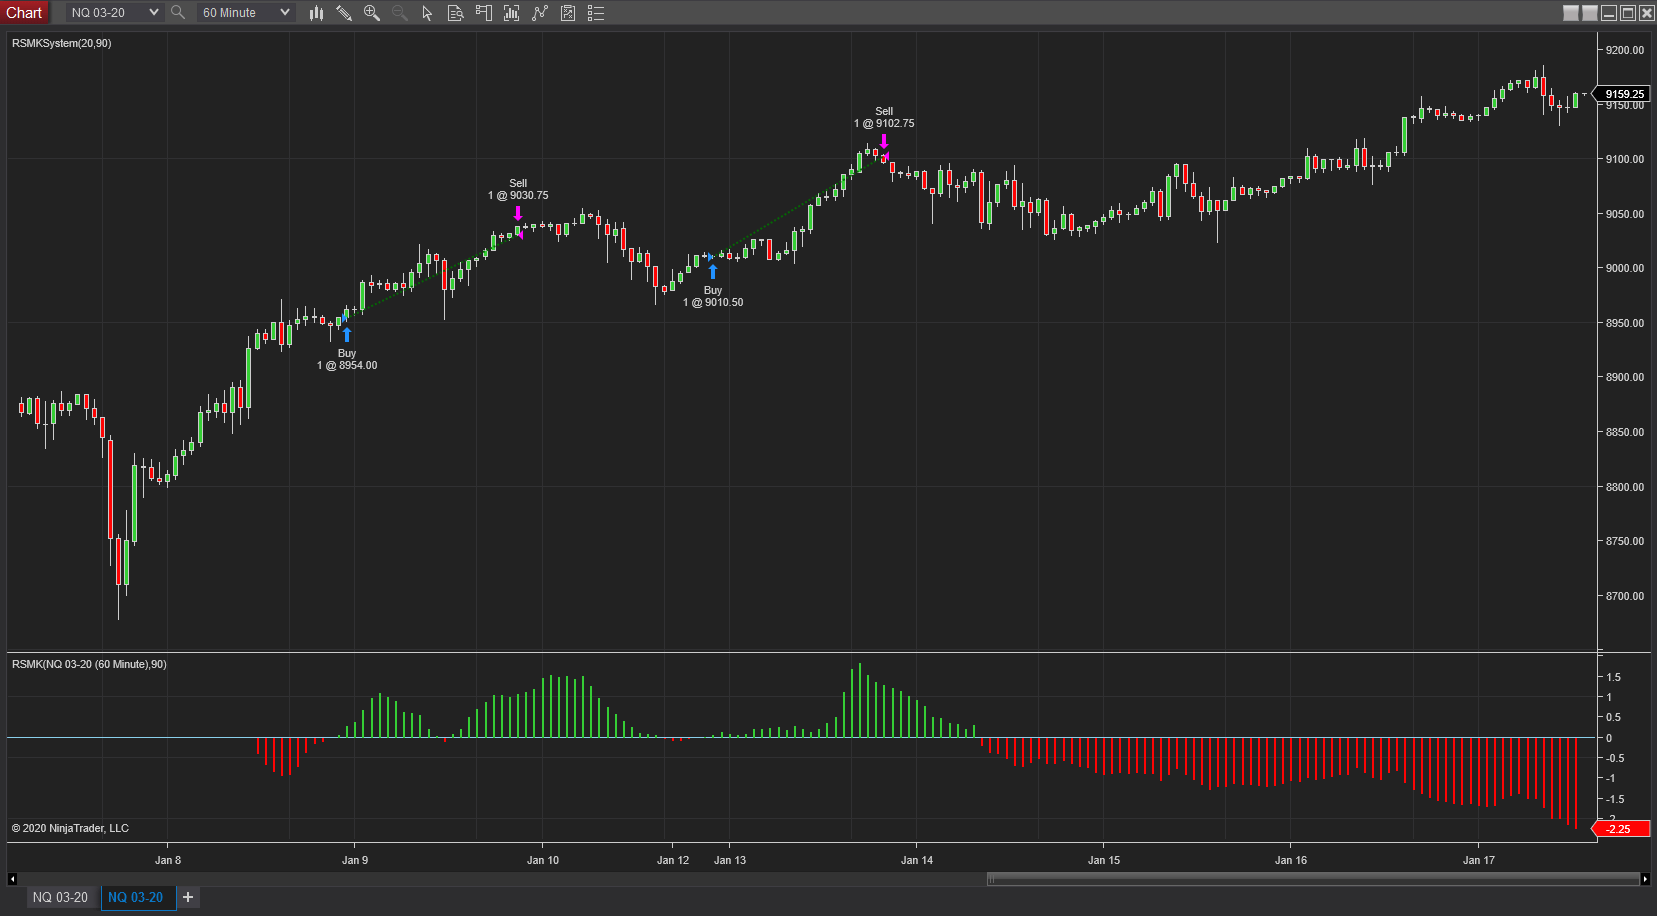
FIGURE 7: NINJATRADER. The RSMK
indicator and RSMK system strategy are shown on a 60-minute NQ chart from
January 8, 2020 to January 17, 2020.
—Chris Lauber
NinjaTrader, LLC
www.ninjatrader.com
BACK TO LIST

QUANTACULA STUDIO: MARCH 2020
We’ve added the RSMK indicator, described in Markos Katsanos’ article in this
issue, “Using Relative Strength To Outperform The Market,” to our TASC library
so it is available both on Quantacula.com and in Quantacula Studio. The second
parameter of the indicator is a string that represents the symbol of the index
you wish to use in the indicator. The default value is “SPY.” The indicator
automatically collects the data for the index and calculates the RSMK value.
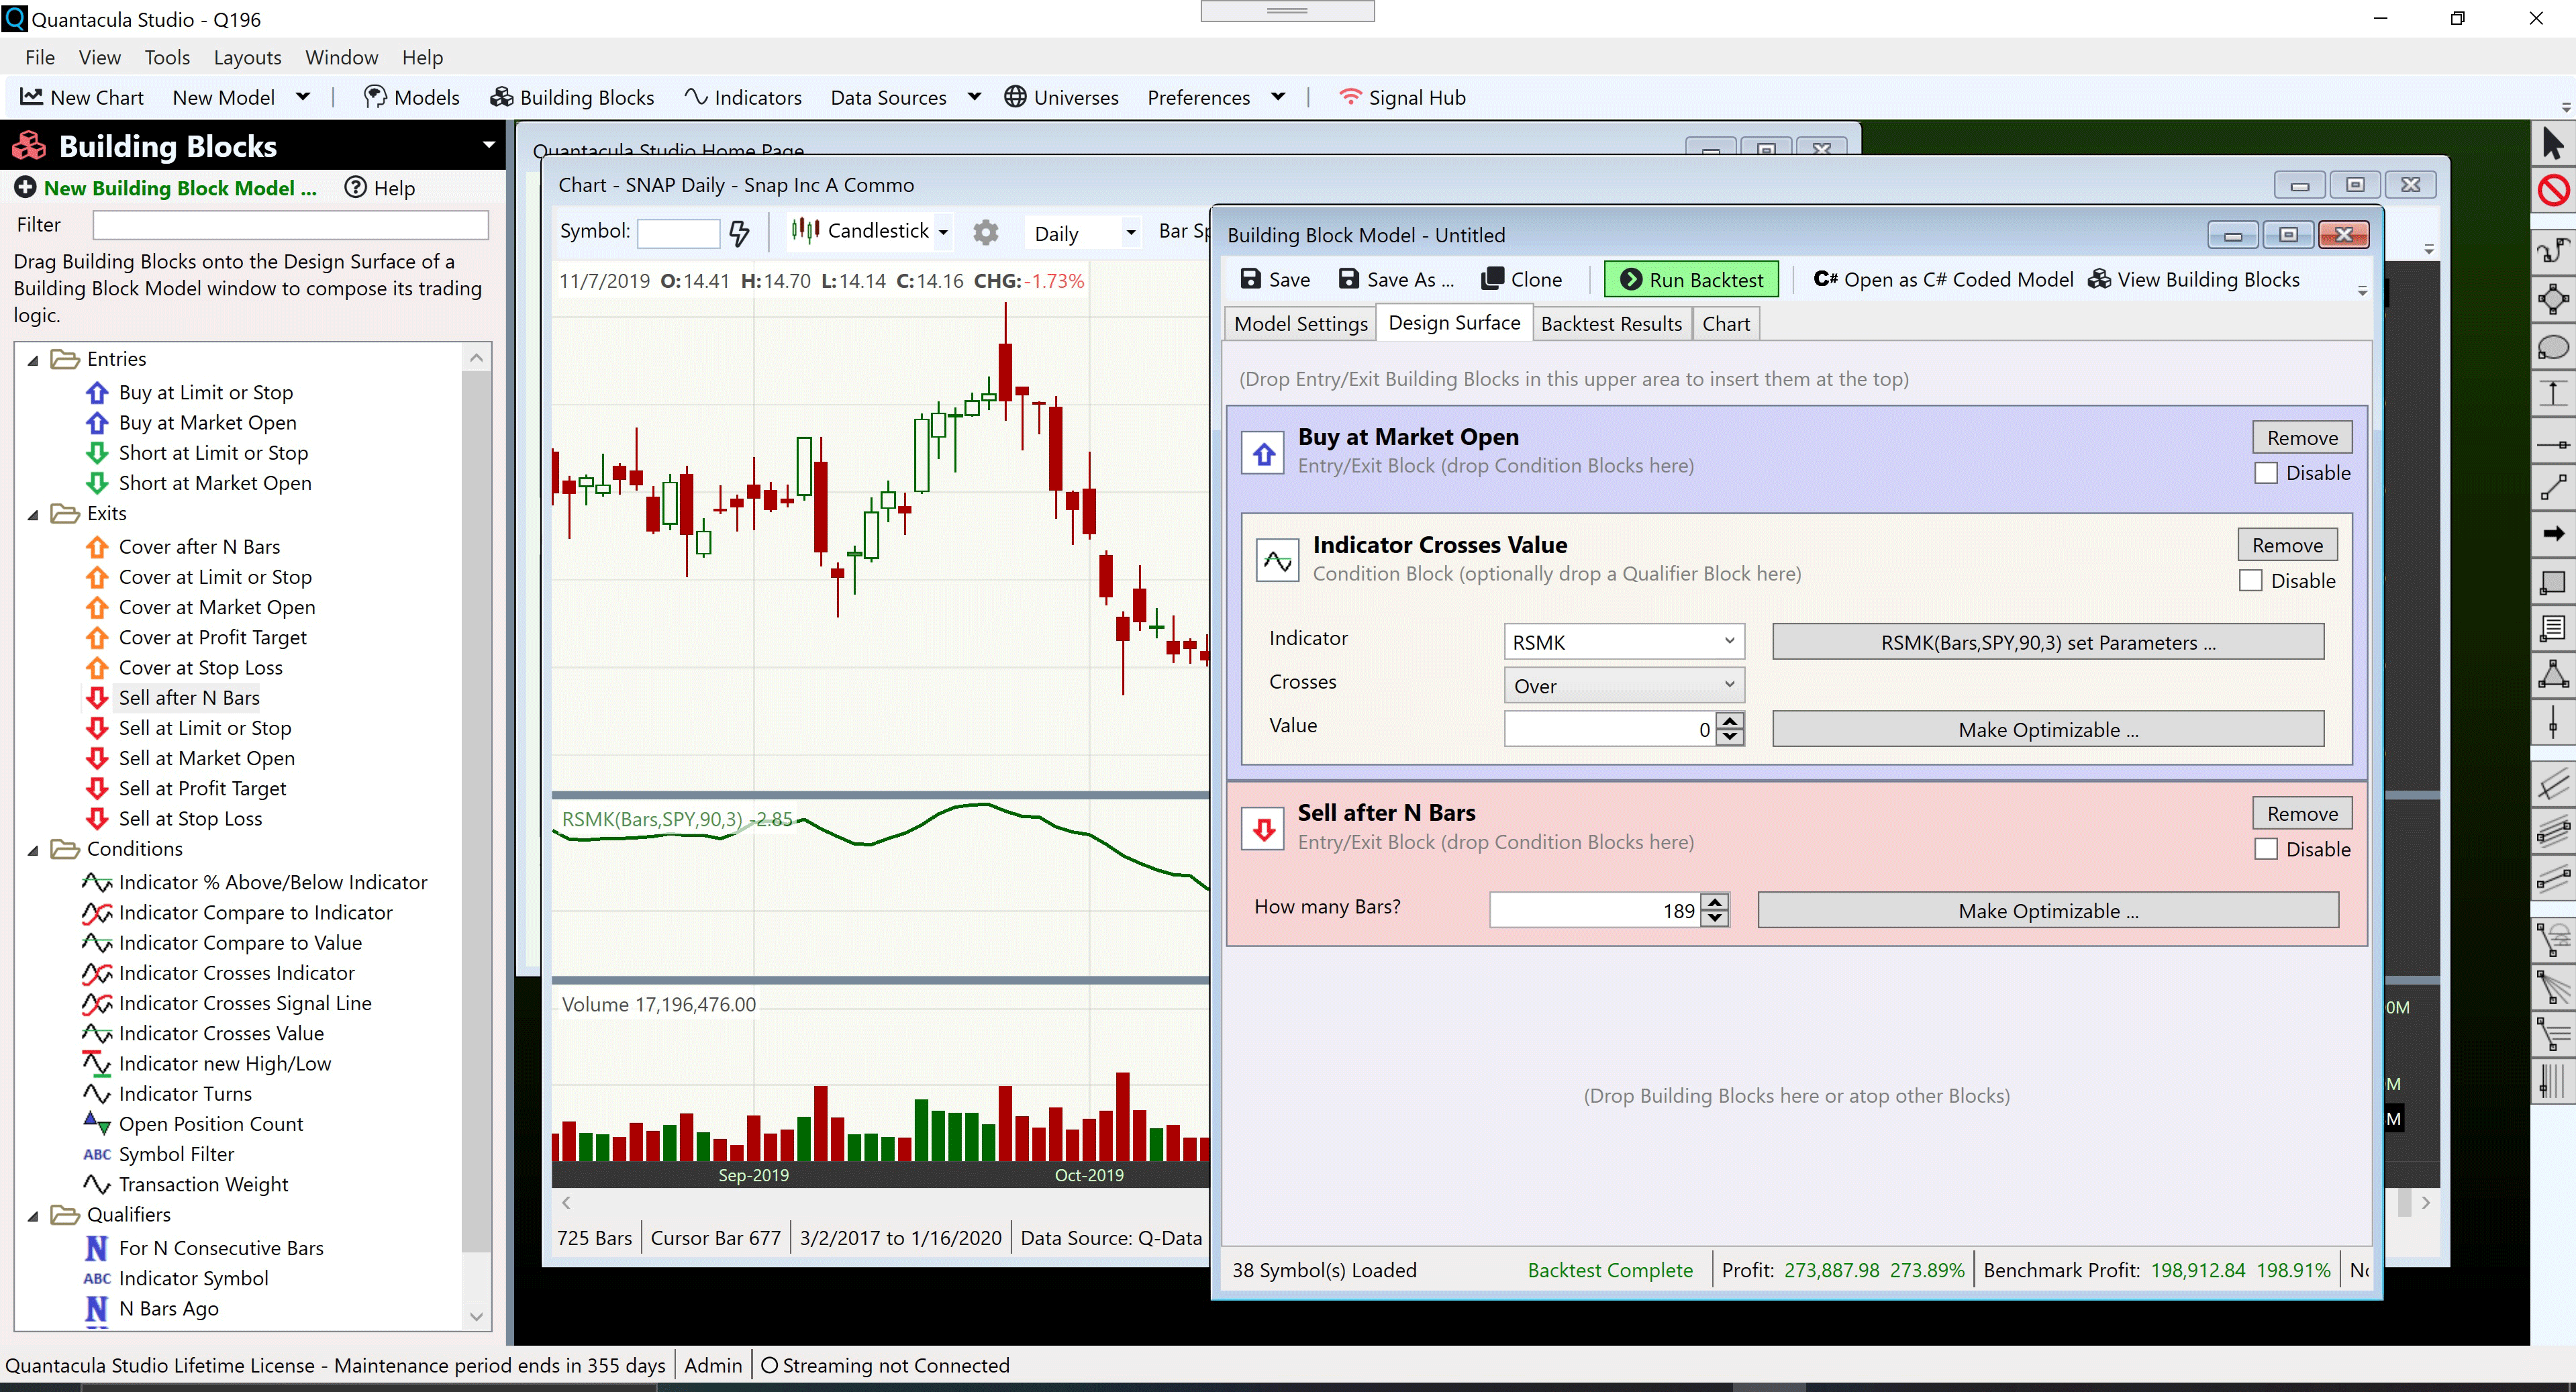
FIGURE 8: QUANTACULA. This demonstrates
the RSMK strategy mocked up using Quantacula Studio Building Blocks.
Shown in Figure 8 is the simple entry and exit rules for the strategy implemented
as a Quantacula Studio Building Block Model. Using this approach, you can create
a trading model without writing any code. You can even set the various parameters
to be optimizable, and use Quantacula Studio’s optimizer to find the most profitable
parameter ranges.
—Dion Kurczek, Quantacula LLC
info@quantacula.com
www.quantacula.com
BACK TO LIST

TRADE NAVIGATOR: MARCH 2020
A special file has been created to make it easy to download the library based
on Markos Katsanos’ article in this issue, “Using Relative Strength To Outperform
The Market,” in Trade Navigator. The file name is “SC202003.”
To download it, click on Trade Navigator’s blue telephone button, select download
special file, and replace the word “upgrade” with “SC202003” (without
the quotes). Then click the start button. When prompted to upgrade, click
the yes button. If prompted to close all software, click on the continue button.
Your library will now download.
This library contains two indicators named “RSMK” and “MC,” a template named
“S&C RSMK,” and a strategy called “RSMK strategy.”
Manually creating indicators
If you would like to create these indicators manually (Figures 9 & 10),
here’s how to do it: Click on the edit dropdown menu and open the
trader’s toolbox (or use CTRL+T) and click on the functions tab. Next,
click on the new button and a new function dialog window
will open. In its text box, type in the code. (Ensure that there are no extra
spaces at the end of each line). When completed, click on the verify button.
You may be presented with an add inputs pop-up message if there are
variables in the code. If so, click the yes button, then enter a value
in the default value column. If all is well, when you click on the function tab,
the code you entered will convert to italic font. Click on the save button
and type a name for the function.
FIGURE 9: TRADE NAVIGATOR. Here,
the code is shown for the indicator named “RSMK.”
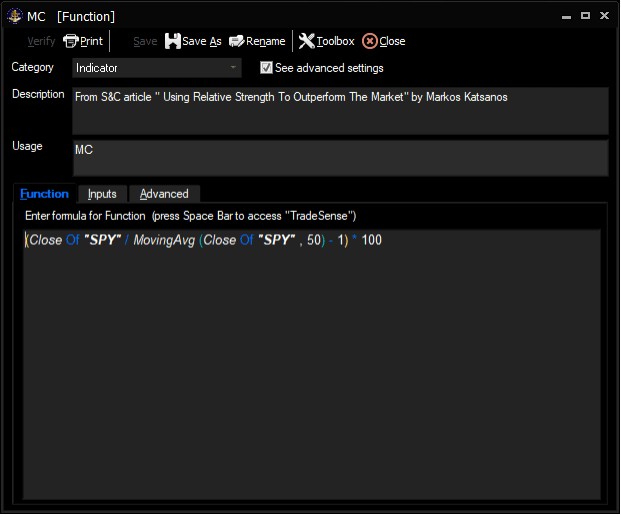
FIGURE 10: TRADE NAVIGATOR. Here,
the code is shown for the indicator named “MC.”
Adding to your chart
Once complete, you can insert these indicators onto your chart by opening the charting drop-down
menu, selecting the add to chart command, then on the indicators tab,
find your named indicator, select it, then click on the add button.
Repeat this procedure for additional indicators as well if you wish.
Template
The template can be inserted onto your chart (Figure 11) by opening the charting drop-down
menu, then selecting the templates command, then selecting the “S&C
RSMK” template.
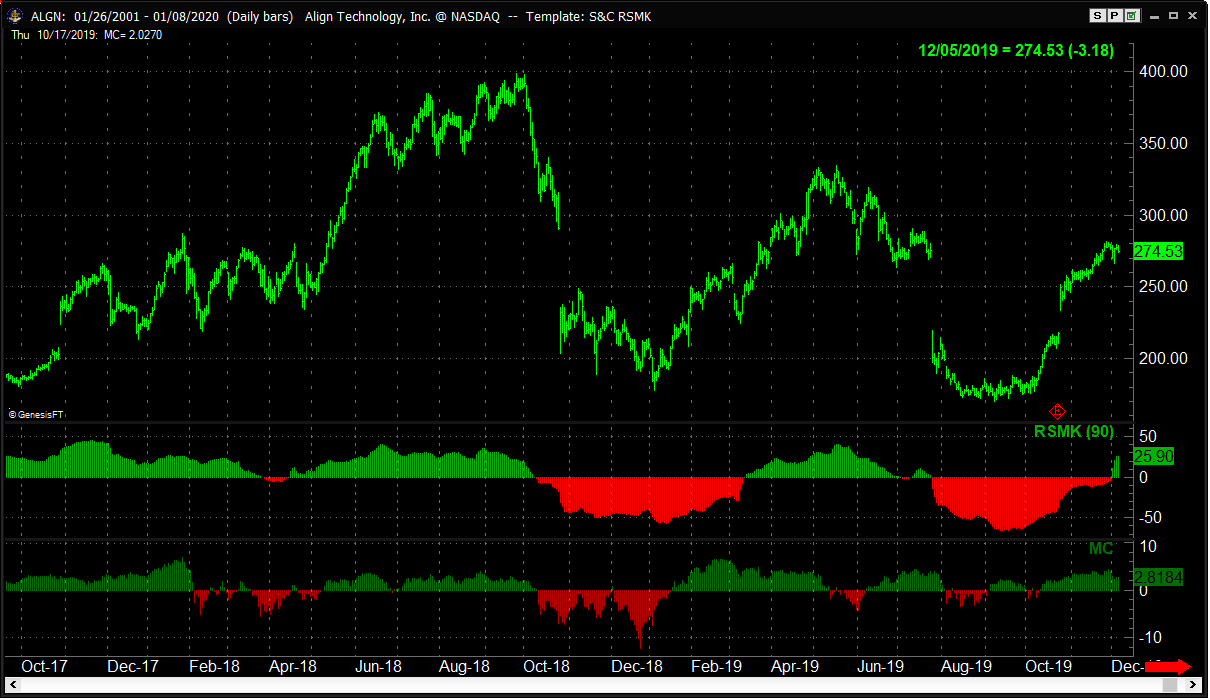
FIGURE 11: TRADE NAVIGATOR. Here,
the S&C RSMK template is applied to the chart.
Strategy
This library also contains a strategy called RSMK strategy. This pre-built
strategy can be overlaid onto your chart by opening the charting drop-down
menu, selecting the add to chart command, then selecting the strategies tab.
If you have any difficulties creating or using the indicators and/or template,
our friendly technical support staff would be happy to help. Users can call
us or use the live chat tool found in Trade Navigator’s help menu
or near the top of the page at our website, www.TradeNavigator.com.
Our support hours are M-F 6 am–7 pm US Mountain Time. Happy trading!
—Genesis Financial Technologies
Tech support 719 884-0245
www.TradeNavigator.com
BACK TO LIST
MICROSOFT EXCEL: MARCH 2020
In “Using Relative Strength To Outperform The Market” in this issue, Markos
Katsanos improves on the commonly used relative strength (RS) indicator, which
measures the performance of one security relative to another.
Background highlighting in Figures 12 and 13 demonstrates some of the subtle
decision point differences between RS and RSMK
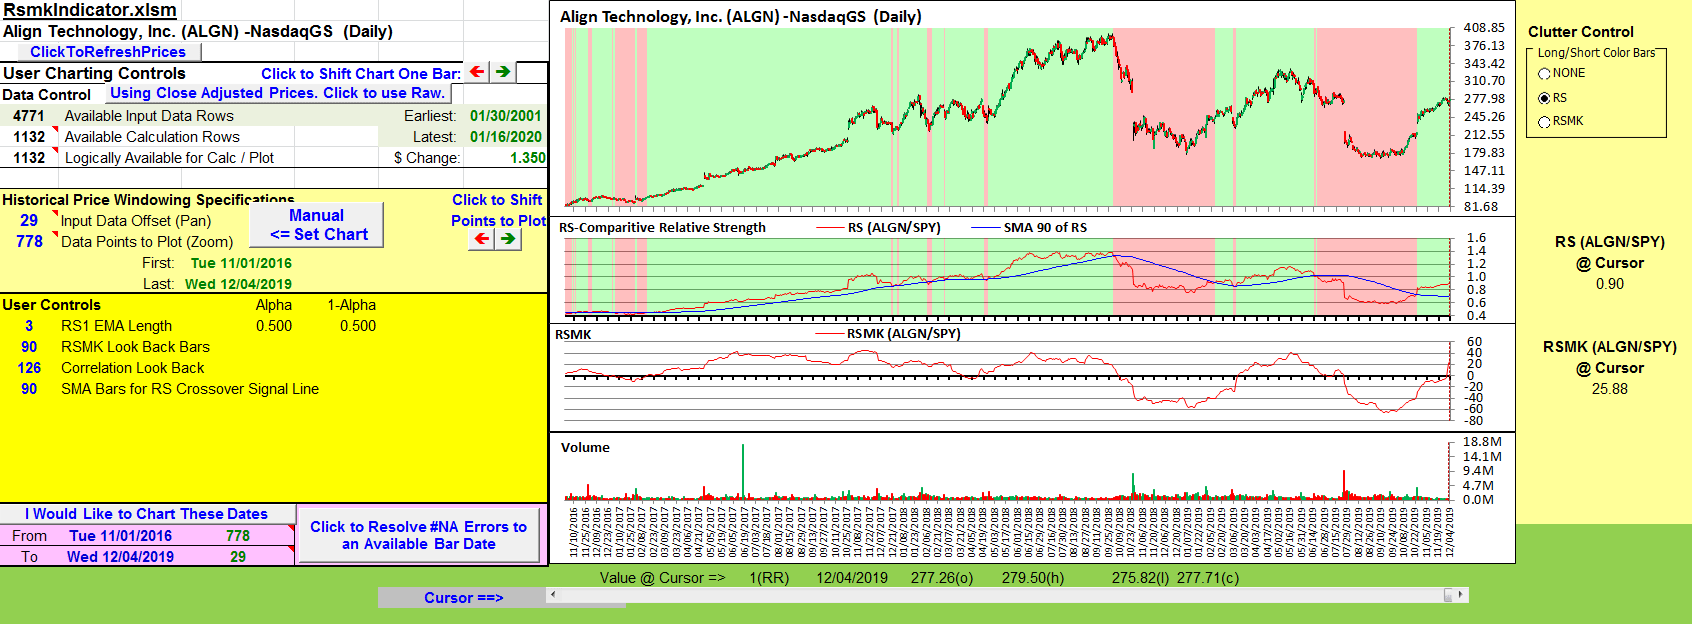
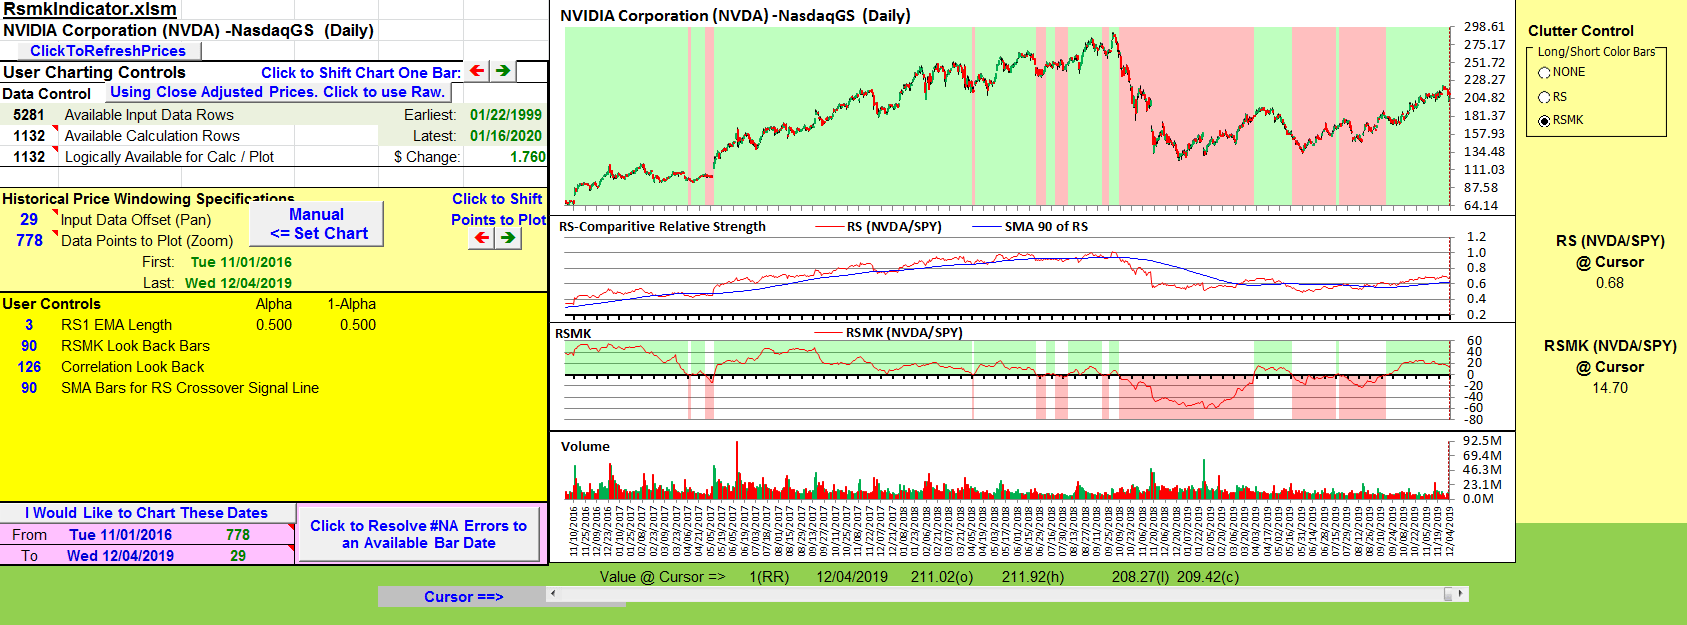
FIGURE 12: EXCEL, RELATIVE STRENGTH
(RS). Here you see the comparative relative strength of ALGN with regard
to SPY.
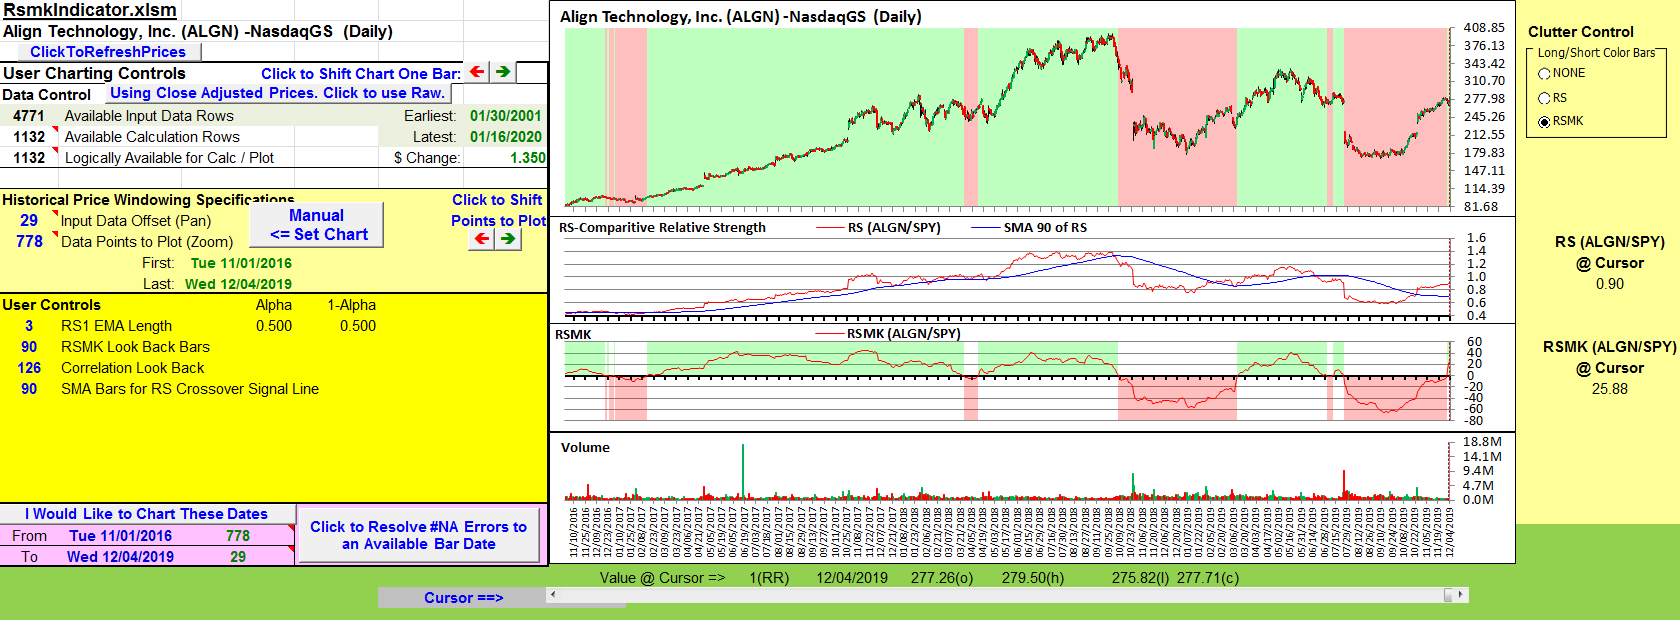
FIGURE 13: EXCEL, RSMK. Here’s
an example of looking at periods of strong and weak RSMK of ALGN versus the
SPY.
Background highlighting in Figures 13 and 14 demonstrates RSMK as a tool comparing
the behavior of ALGN and NVDA.
Just to the right of the charts are the RS and RSMK values at the current
far right cursor location.
Here’s a hypothetical question for you to consider: Say you had some free
cash ready to invest today. Which of these two might you prefer? Note the following
characteristics on the charts:
- Both demonstrate recent upward price action.
- The RSMK values for NVDA have been positive for some time.
- The local RSMK values for ALGN show an upward trend out of the negative.
And RSMK for ALGN has just crossed into positive territory on this bar. For
this bar, ALGN also has a stronger RSMK value than NVDA.
Is this the beginning of an RSMK upward trend for ALGN? Or an RSMK whipsaw
for ALGN? That is yet to be seen.
RSMK is very interesting. It will take a bit more playing with to see how
to best fit RSMK into my trading strategies.
The spreadsheet file for this Traders’ Tip can be downloaded here.
To successfully download it, follow these steps:
- Right-click on the Excel
file link, then
- Select “save as” (or “save target as”) to place
a copy of the spreadsheet file on your hard drive.
ERRATA NOTE:
On or slightly before January 20, 2020
Yahoo Finance changed the way splits are represented in downloads. Split representations
went from using a slash (/) as the separator between the new shares and old
shares numbers (ex. 3/2 or 2/1) to using a full colon as the separator (ex.
3:2 or 2:1).
This will cause a “Runtime error 9” in uncorrected code.
To fix: When you get the “error 9,” choose the debug option.
This will take you into the VBA editor and highlight the failing VBA code line.
Two lines above, you will find the line:
SplitFactors = Split(CsvColumns(CsvColNdx), "/")
Simply change the slash (/) to a full colon (:). Then close the spreadsheet
with the SAVE option. Then open and run the spreadsheet.
Note: This problem exists in all uncorrected spreadsheets
prior to March 2020.
—Ron McAllister
Excel and VBA programmer
rpmac_xltt@sprynet.com
BACK TO LIST

eSIGNAL: MARCH 2020
For this month’s Traders’ Tip, we’ve provided the RSMK
indicator.efs study based on the article by Markos Katsanos in this issue,
“Using Relative Strength To Outperform The Market.” The study compares the
relative strength between two markets.
The studies contain formula parameters that may be configured through the Edit
Chart window (right-click on the chart and select “Edit Chart”). A sample
chart is shown in Figure 15.
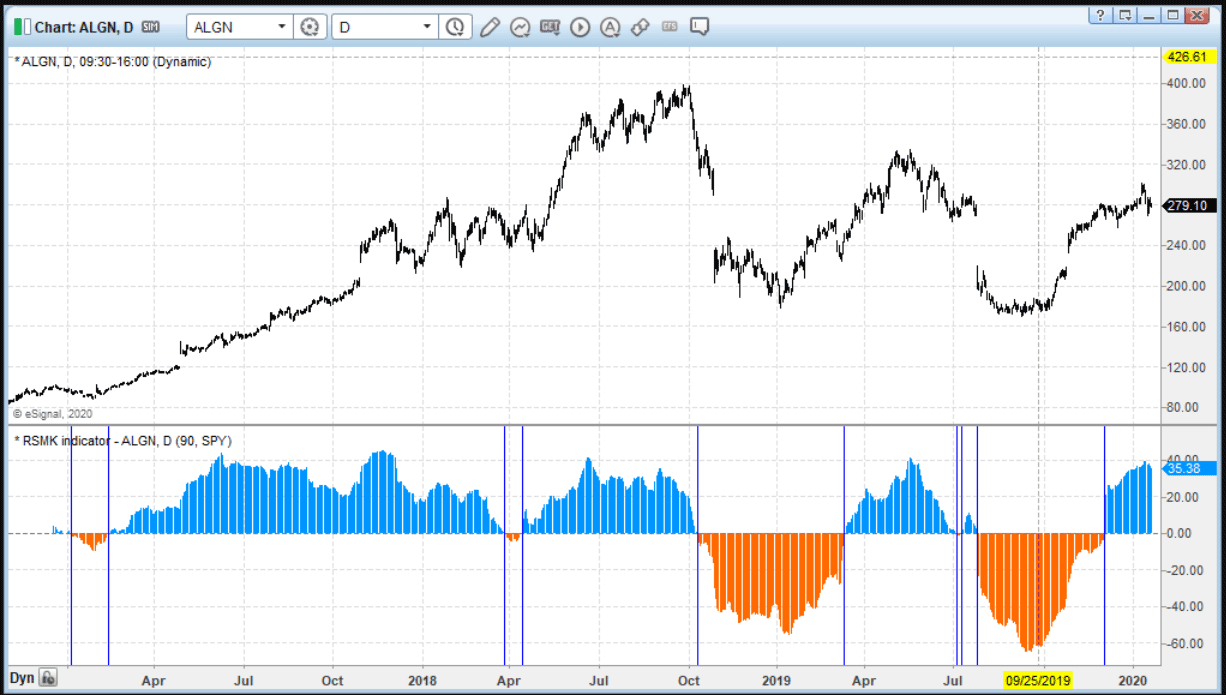
FIGURE 15: eSIGNAL. Here is an
example of the studies plotted on a daily chart of ALGN.
To discuss this study or download a complete copy of the formula code, please
visit the EFS Library Discussion Board forum under the forums link
from the support menu at www.esignal.com or
visit our EFS KnowledgeBase at https://www.esignal.com/support/kb/efs/.
The eSignal formula script (EFS) is also available
here.
/**********************************
Provided By:
Copyright 2019 Intercontinental Exchange, Inc. All Rights Reserved.
eSignal is a service mark and/or a registered service mark of Intercontinental Exchange, Inc.
in the United States and/or other countries. This sample eSignal Formula Script (EFS)
is for educational purposes only.
Intercontinental Exchange, Inc. reserves the right to modify and overwrite this EFS file with each new release.

Description:
   Using Relative Strength To Outperform The Market
   by Markos Katsanos


Version:            1.00  01/13/2020

Formula Parameters:                     Default:
RSBARS                                  90
Comparison_Symbol                       SPY

Notes:
The related article is copyrighted material. If you are not a subscriber
of Stocks & Commodities, please visit www.traders.com.

**********************************/
var fpArray = new Array();
var bInit = false;

function preMain() {
    setStudyTitle("RSMK indicator");
    setCursorLabelName("RSMK indicator", 0);
    setPriceStudy(false);
    setDefaultBarFgColor(Color.RGB(0x00,0x94,0xFF), 0);
    setPlotType( PLOTTYPE_HISTOGRAM , 0 );
    setIntervalsBackfill(true);
    addBand(0, PS_DASH, 1, Color.grey);

    var x=0;
    fpArray[x] = new FunctionParameter("RSBARS", FunctionParameter.NUMBER);
	with(fpArray[x++]){
        setLowerLimit(10);
        setUpperLimit(500);
        setDefault(90);
    }

    fpArray[x] = new FunctionParameter("Comparison_Symbol", FunctionParameter.STRING);
	with(fpArray[x++]){
        setDefault("SPY");
    }

}

var bVersion = null;
var xClose = null;
var RSMK = null;
var j = null;

function main(RSBARS,Comparison_Symbol) {
    if (bVersion == null) bVersion = verify();
    if (bVersion == false) return;

    if ( bInit == false ) {
        xClose = close();
        CS = Comparison_Symbol;
        SEC2 = close(sym(CS));
        RSMKr = efsInternal("Calc_RSMK", xClose, SEC2, RSBARS);
        RSMK = efsInternal("Calc_res", RSMKr);

        bInit = true;
    }

    if (getCurrentBarCount() < RSBARS) return;

    if (RSMK.getValue(0) > 0 ) setBarFgColor(Color.RGB(0x00,0x94,0xFF))
    else setBarFgColor(Color.RGB(0xFE,0x69,0x00))

    if ((RSMK.getValue(0) > 0 && RSMK.getValue(-1) < 0) || ((RSMK.getValue(0) < 0 && RSMK.getValue(-1) > 0))) addLineTool(LineTool.VERT,  getCurrentBarIndex(), 1, Color.blue,j++ );

    return [RSMK.getValue(0)]
}

function Calc_RSMK(xClose, xSEC2, RSBARS)
{
    var ret = 0;
    if (xSEC2.getValue(0) == null || xSEC2.getValue(-RSBARS) == null) return;
    var a = Math.log(xClose.getValue(0) /  xSEC2.getValue(0));
    var b = Math.log(xClose.getValue(-RSBARS) /  xSEC2.getValue(-RSBARS));
    ret = a - b

    return ret;
}

function Calc_res(RSMKr){
    return ema(3, RSMKr)*100
}


function verify(){
    var b = false;
    if (getBuildNumber() < 779){

        drawTextAbsolute(5, 35, "This study requires version 10.6 or later.",
            Color.white, Color.blue, Text.RELATIVETOBOTTOM|Text.RELATIVETOLEFT|Text.BOLD|Text.LEFT,
            null, 13, "error");
        drawTextAbsolute(5, 20, "Click HERE to upgrade.@URL=https://www.esignal.com/download/default.asp",
            Color.white, Color.blue, Text.RELATIVETOBOTTOM|Text.RELATIVETOLEFT|Text.BOLD|Text.LEFT,
            null, 13, "upgrade");
        return b;
    }
    else
        b = true;

    return b;
}
—Eric Lippert
eSignal, an Interactive Data company
800 779-6555, www.eSignal.com
BACK TO LIST
Originally published in the March 2020 issue of
Technical Analysis of STOCKS & COMMODITIES magazine.
All rights reserved. © Copyright 2020, Technical Analysis, Inc.